

MicroStockHub
Markets Review
(All MSCI index returns are shown net and in U.S. dollars unless otherwise noted.)
|
Sources: CAPS CompositeHubTM, Bloomberg Past performance is not indicative of future results. Aristotle International Equity Composite returns are presented gross and net of investment advisory fees and include the reinvestment of all income. Gross returns will be reduced by fees and other expenses that may be incurred in the management of the account. Net returns are presented net of actual investment advisory fees and after the deduction of all trading expenses. Aristotle Capital Composite returns are preliminary pending final account reconciliation. Please see important disclosures at the end of this document. |
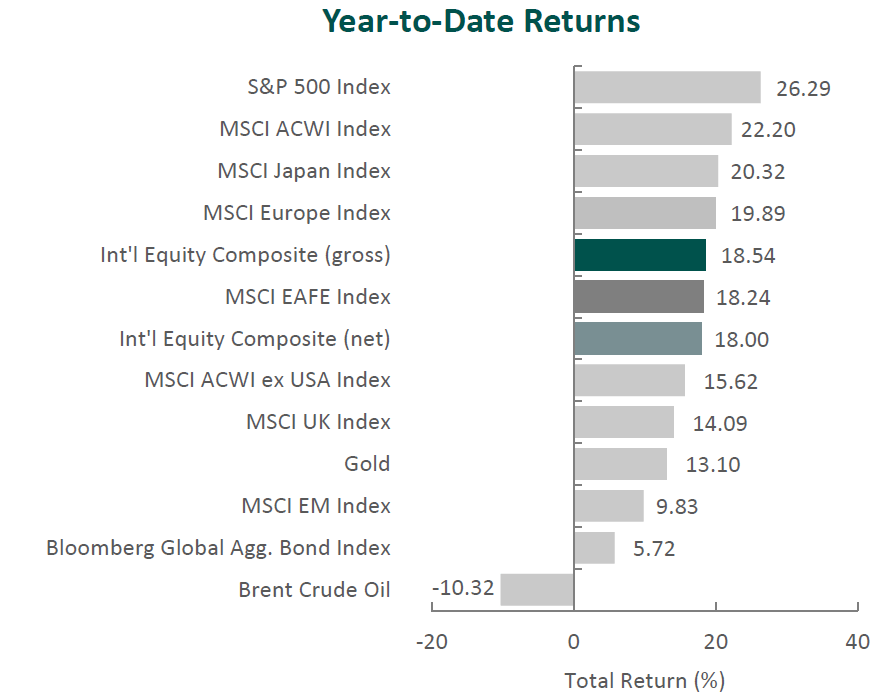
Global equity markets rallied in the fourth quarter. Overall, the MSCI ACWI Index rose 11.03% during the period. Concurrently, the Bloomberg Global Aggregate Bond Index increased 8.10%. In terms of style, value stocks underperformed their growth counterparts during the quarter, with the MSCI ACWI Value Index trailing the MSCI ACWI Growth Index by 3.57%.
The MSCI EAFE Index climbed 10.42% during the fourth quarter, while the MSCI ACWI ex USA Index increased 9.75%. Within the MSCI EAFE Index, Europe & Middle East and Asia were the strongest performers, while the U.K., though posting strong absolute results, gained the least. On a sector basis, all eleven sectors within the MSCI EAFE Index posted positive returns, with Information Technology, Materials and Real Estate generating the largest gains. Conversely, Energy, Health Care and Consumer Staples gained the least.
Despite posting overall gains, global equity markets were shocked with another war and humanitarian crisis as tensions between Israel and Hamas reached a watershed during the quarter. In response to the deadly terrorist attack on civilians by Hamas, Israel commenced a military campaign in the Gaza Strip. While concerns that the war might spread throughout the entire Middle East abated during the period, the complex religious, ethnic and political makeup of the region could complicate diplomatic relationships in the future.
Meanwhile, in Europe, Ukraine’s 2023 counteroffensive against Russia was confirmed as a failure, and Western support for the beleaguered nation seems to be waning. President Putin has stated that Russia’s war goals have not changed, but reports indicate that he may be open to a cease-fire. In Asia, President Xi Jinping claimed that reunification is inevitable, adding to the mounting Chinese pressure on Taiwan ahead of Taiwan’s 2024 election.
On the economic front, global labor markets remained tight, and most countries and regions continued to make inroads in the battle against inflation, as the U.S., U.K., eurozone and Japan all reported slowing annual inflation in November; 3.1%, 3.9%, 2.4% and 2.8%, respectively. In response to the improving conditions, both major western and eastern nations largely kept interest rate policy steady during the quarter. However, future policy direction looks to be divided heading into the new year, as the U.S. signaled potential rate cuts, the U.K. and eurozone rebuffed premature discussions of cuts, and Japan looks to end its policy of negative rates in 2024. Nevertheless, the International Monetary Fund expects global inflation to continue to steadily decline due to overall tighter monetary policy and lower commodity prices, which have been further suppressed by the bursting of China’s property bubble.
Annual Markets Review
After a tumultuous year in 2022, global equity markets rebounded in 2023, as the MSCI ACWI posted a full-year return of 22.20%. Additionally, after underperforming value in 2022 by the largest amount since 2000, growth recovered, as the MSCI ACWI Growth Index outperformed the MSCI ACWI Value Index by 21.41% in 2023. Meanwhile, fixed income markets also rose, as the Bloomberg Global Aggregate Bond Index increased 5.72%.
Though markets trended in a positive direction, 2023 still had its share of twists and turns in the form of a banking crisis and geopolitical conflicts in Europe, the Middle East and Asia. Furthermore, inflation, corresponding central bank policies, and economic recovery in areas like Europe and Asia generated significant headlines and proved to be key macroeconomic factors.
Given the multitude of headlines in a year and their fickle nature, short-term returns are often volatile and inconsistent. Therefore, we instead choose to focus on business fundamentals over the long term. By finding great businesses that are undervalued with actionable catalysts within our investment time horizon, we believe we can provide consistent and lasting value to our clients.
Performance and Attribution Summary
For the fourth quarter of 2023, Aristotle Capital’s International Equity Composite posted a total return of 10.41% gross of fees (10.31% net of fees), underperforming the MSCI EAFE Index, which returned 10.42%, and outperforming the MSCI ACWI ex USA Index, which returned 9.75%. Please refer to the table below for detailed performance.
| Performance (%) | 4Q23 | 1 Year | 3 Years | 5 Years | 10 Years | Since Inception* |
|---|---|---|---|---|---|---|
| International Equity Composite (gross) | 10.41 | 18.54 | 3.32 | 8.81 | 5.17 | 5.63 |
| International Equity Composite (‘net’) | 10.31 | 18.00 | 2.84 | 8.30 | 4.66 | 5.13 |
| MSCI EAFE Index (‘net’) | 10.42 | 18.24 | 4.02 | 8.16 | 4.28 | 2.76 |
| MSCI ACWI ex USA Index (‘net’) | 9.75 | 15.62 | 1.55 | 7.08 | 3.83 | 2.35 |
| *The inception date for the International Equity Composite is January 1, 2008. Past performance is not indicative of future results. Aristotle International Equity Composite returns are presented gross and net of investment advisory fees and include the reinvestment of all income. Gross returns will be reduced by fees and other expenses that may be incurred in the management of the account. Net returns are presented net of actual investment advisory fees and after the deduction of all trading expenses. Aristotle Capital Composite returns are preliminary pending final account reconciliation. Please see important disclosures at the end of this document. |
|
Source: FactSet Past performance is not indicative of future results. Attribution results are based on sector returns which are gross of investment advisory fees. Attribution is based on performance that is gross of investment advisory fees and includes the reinvestment of income. |
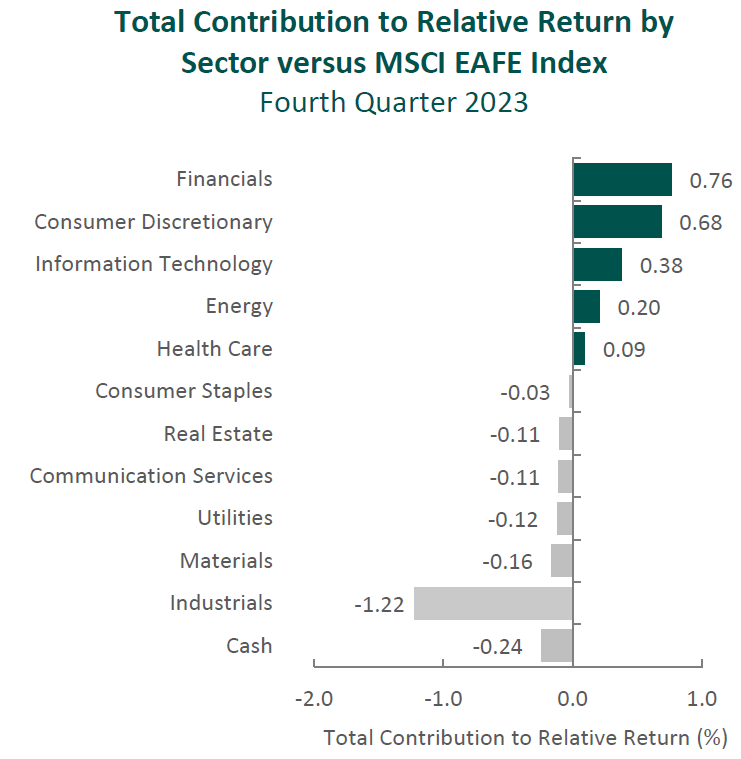
From a sector perspective in the fourth quarter, the portfolio’s modest underperformance relative to the MSCI EAFE Index can be attributed to allocation effects, while security selection had a positive impact. Security selection in Industrials and Health Care, as well as an overweight in Energy, detracted the most from the portfolio’s relative performance. Conversely, security selection in Financials, Consumer Discretionary and Energy contributed to relative return.
Regionally, security selection was responsible for the portfolio’s underperformance, while allocation effects had a positive impact. Security selection in the U.K. and Asia detracted from relative performance, while exposure to Canada and security selection in Europe & Middle East contributed.
Contributors and Detractors for 4Q 2023
Rentokil Initial, the U.K.-based pest control and hygiene services company, was the largest detractor for the quarter. The company’s pest control segment (which accounts for 94% of total operating profit) reported a slowdown in organic revenue growth from 5.6% in the first half of 2023 to 2.3% in the third quarter. As these results are short term in nature, we will continue to closely monitor the company’s progress on both integration of Terminix and further improvement of its marketing strategy. This includes the recent appointment of Brad Paulsen as CEO of the North America Region and his impact on the company’s most important geography (accounting for ~75% of pest control sales). Over the long term, we remain confident that the Terminix acquisition will create scale efficiencies and in-market densification (with a targeted $200 million in cost synergies by 2025), as well as accelerate the consolidation of the U.S. pest control market. Short-term impacts on the company’s stock price, in our opinion, are overdone given these fundamental improvements coupled with the resilient nature of the pest control business.
Japan-based Nidec, the global supplier of brushless motors, was one of the largest detractors for the quarter. The company’s electric vehicle (‘EV’) traction motor business has disappointed, with shipment assumptions dropping to 350,000 from 949,000 at the start of the fiscal year. Management also withdrew its ambitious target for the EV business to turn profitable this fiscal year, now projecting an operating loss of ¥15 billion, as it noted all motor suppliers to Chinese EV manufacturers are currently experiencing losses due to intensifying price competition. In response, Nidec has announced a shift in its strategy to both increase R&D spending to accelerate product development and shore up profitability with more selective order placement. While we continue to believe Nidec’s expertise in power efficiency provides it with a unique advantage to supply industrial motors across markets (not only for EVs, but also robots, appliances and industrial applications), we are carefully reviewing whether recent setbacks are cyclical issues or more permanent in nature, and we also continue to monitor changes in leadership, including those set to take place in April 2024.
Nemetschek, a project management software solutions provider for the architecture, engineering and construction industry, was the largest contributor for the quarter. Over the past couple of years, the company has made significant efforts to transition the business from a license to a subscription SaaS (software as a service) model, which we expected would drive higher and more stable revenues per user while creating more long-term value for customers. In line with this strategy, the company reported that ~75% of its revenues are now recurring, up from ~65% last year. Furthermore, with the backdrop of stable demand and strong operational execution, management reported EBITDA margins at the high end of guidance and raised its revenue projections for the year. We believe the optimization of Nemetschek’s business model, continued improvement in operational efficiency through efforts like internalization, and product innovation, such as the open and cloud-based dTwin platform, will lead to long-term improvements in profitability and position the company for market share gains as building complexity continues to increase.
Experian, one of the largest credit bureau companies in the world, was a primary contributor during the quarter. Amid tighter lending conditions, the company continues to show its strength. This includes recent product launches and innovation within the company’s Ascend platform, which leverages deeper analytics so that lenders can automate processes and target audiences more effectively. The credit bureau also expanded its position in employer services and verifications and has seen further digital penetration in areas like Auto and Health. During our well over a decade-long ownership of Experian, the company has increasingly found ways to monetize existing data sets and serve new types of customers. We believe Experian’s unique industry structure and massive data library (with data on ~1.5 billion consumers and ~200 million businesses) not only creates an exceptionally scalable business with high barriers to entry, but also makes it uniquely positioned to benefit from the increased need for big data across many industries.
Recent Portfolio Activity
During the quarter, we sold our positions in Dassault Systèmes and Sandoz and invested in a new position in Daikin Industries.
We first invested in Dassault in the first quarter of 2015. During our more than eight-year holding period, the company executed on a number of catalysts, including a profitable transition to a new software platform (i.e., 3DExperience) and successful entry into new verticals such as life sciences via the 2019 acquisition of Medidata. While we continue to view Dassault as a high-quality company, we decided to exit our investment in favor of what we view as a more optimal opportunity in Daikin Industries, which is discussed in detail below.
We have been Novartis shareholders for over a decade. In October of 2023, the company completed the spinoff of Sandoz, its generics and biosimilars business. This divestiture furthers Novartis’s ongoing transition to a focus on branded prescription drugs, having over the last several years also exited its eye care, vaccine, animal health and consumer healthcare businesses. Upon further analysis, we decided to sell the shares received in the Sandoz spinoff and use the proceeds for what we consider to be a more optimal investment.
Daikin Industries, Ltd.
Founded in 1924 and headquartered in Japan, Daikin Industries is the world’s largest commercial and residential air conditioner company. Daikin primarily manufactures and sells air conditioning systems, heat pumps, air purifiers and refrigeration equipment (which accounts for over 90% of revenue). Daikin has long been an industry leader in developing energy-efficient products, which was molded by its roots in Japan, a region with limited natural resources and high energy costs. The company’s R&D consists of a global Technology Innovation Center and 39 other regional development facilities in charge of tailoring offerings to their local markets. Today Daikin’s products are sold in over 170 countries, and the company boasts leading market positions in Japan and China, as well as in the U.S. residential market.
Distribution is particularly important since air conditioning systems are difficult to install. Daikin’s 2012 acquisition of Goodman in the U.S. added hundreds of distribution points across the country, providing Daikin with a leading national market position and platform from which to expand. In China, specialty retail stores (ProShops) sell directly to homeowners, focusing on high-end, multi-unit products at much higher margins than if they were selling to a developer or contractor.
High-Quality Business
Some of the quality characteristics we have identified for Daikin include:
- Strong brand recognition and a large global distribution network are, in our opinion, strong competitive advantages and serve as high barriers to entry;
- History of technological innovation, particularly in energy-saving inverters and variable refrigerant flow systems; and
- Ability to tailor products to different local preferences across geographies and varied levels of HVAC regulations, thanks to Daikin’s network of global production bases and development facilities.
Attractive Valuation
Based on our estimates, shares of the company are attractively valued. We believe greater global adoption of air conditioning, as well as higher priced and more profitable technologies (i.e., heat pumps and inverters), will lead to higher normalized FREE cash flow than currently appreciated by the market.
Compelling Catalysts
Catalysts we have identified for Daikin, which we believe will cause its stock price to appreciate over our three- to five-year investment horizon, include:
- As the largest global supplier and a leader in energy efficiency, Daikin is uniquely positioned to benefit from the increase in worldwide air conditioning adoption rates (projected to triple by 2050) while leveraging its intellectual property in inverters and heat pumps;
- Market share gains in the U.S. as Daikin further leverages its technology in premium residential air conditioning supported by Goodman’s distribution network; and
- Execution of its Fusion 25 strategic plan that includes making improvements in technological development, strengthening sales and service networks, promoting digital transformation, and more.
Conclusion
With volatile economic data points, changing central bank policies, shocks to the banking system and various geopolitical conflicts, 2023 was full of headline-worthy news. However, as the market’s attention quickly shifted from one macro event to the next, we remained true to our bottom up, fundamental investment philosophy.
As such, instead of chasing the next headline or “placing bets” on short-term predictions, our focus remains on business fundamentals and what is analyzable in the long run. For over the past quarter century, we have dedicated ourselves to a “bottom-up” process of identifying high-quality businesses trading at meaningful discounts to intrinsic value, that possess catalysts which are underway and within management’s control. By doing so, we believe we can find long-term success regardless of the macroeconomic environment or news of the day.
|
Disclosures The opinions expressed herein are those of Aristotle Capital Management, LLC (Aristotle Capital) and are subject to change without notice. Past performance is not a guarantee or indicator of future results. This material is not financial advice or an offer to buy or sell any product. You should not assume that any of the securities transactions, sectors or holdings discussed in this report were or will be profitable, or that recommendations Aristotle Capital makes in the future will be profitable or equal the performance of the securities listed in this report. The portfolio characteristics shown relate to the Aristotle International Equity strategy. Not every client’s account will have these characteristics. Aristotle Capital reserves the right to modify its current investment strategies and techniques based on changing market dynamics or client needs. There is no assurance that any securities discussed herein will remain in an account’s portfolio at the time you receive this report or that securities sold have not been repurchased. The securities discussed may not represent an account’s entire portfolio and, in the aggregate, may represent only a small percentage of an account’s portfolio holdings. The performance attribution presented is of a representative account from Aristotle Capital’s International Equity Composite. The representative account is a discretionary client account which was chosen to most closely reflect the investment style of the strategy. The criteria used for representative account selection is based on the account’s period of time under management and its similarity of holdings in relation to the strategy. Recommendations made in the last 12 months are available upon request. Returns are presented gross and net of investment advisory fees and include the reinvestment of all income. Gross returns will be reduced by fees and other expenses that may be incurred in the management of the account. Net returns are presented net of actual investment advisory fees and after the deduction of all trading expenses. All investments carry a certain degree of risk, including the possible loss of principal. Investments are also subject to political, market, currency and regulatory risks or economic developments. International investments involve special risks that may in particular cause a loss in principal, including currency fluctuation, lower liquidity, different accounting methods and economic and political systems, and higher transaction costs. These risks typically are greater in emerging markets. Securities of small‐ and medium‐sized companies tend to have a shorter history of operations, be more volatile and less liquid. Value stocks can perform differently from the market as a whole and other types of stocks. The material is provided for informational and/or educational purposes only and is not intended to be and should not be construed as investment, legal or tax advice and/or a legal opinion. Investors should consult their financial and tax adviser before making investments. The opinions referenced are as of the date of publication, may be modified due to changes in the market or economic conditions, and may not necessarily come to pass. Information and data presented has been developed internally and/or obtained from sources believed to be reliable. Aristotle Capital does not guarantee the accuracy, adequacy or completeness of such information. Aristotle Capital Management, LLC is an independent registered investment adviser under the Advisers Act of 1940, as amended. Registration does not imply a certain level of skill or training. More information about Aristotle Capital, including our investment strategies, fees and objectives, can be found in our Form ADV Part 2, which is available upon request. ACM-2401-45 Performance Disclosures 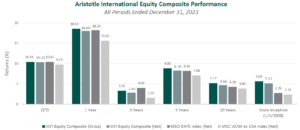 Sources: CAPS CompositeHubTM, MSCI 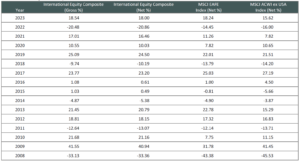 Composite returns for all periods ended December 31, 2023 are preliminary pending final account reconciliation. Past performance is not indicative of future results. The information provided should not be considered financial advice or a recommendation to purchase or sell any particular security or product. Performance results for periods greater than one year have been annualized. Returns are presented gross and net of investment advisory fees and include the reinvestment of all income. Gross returns will be reduced by fees and other expenses that may be incurred in the management of the account. Net returns are presented net of actual investment advisory fees and after the deduction of all trading expenses. Index Disclosures The MSCI EAFE Index (Europe, Australasia, Far East) is a free float-adjusted market capitalization-weighted index that is designed to measure the equity market performance of developed markets, excluding the United States and Canada. The MSCI EAFE Index consists of the following 21 developed market country indexes: Australia, Austria, Belgium, Denmark, Finland, France, Germany, Hong Kong, Ireland, Israel, Italy, Japan, the Netherlands, New Zealand, Norway, Portugal, Singapore, Spain, Sweden, Switzerland and the United Kingdom. The MSCI ACWI captures large and mid-cap representation across 23 developed market countries and 24 emerging markets countries. With approximately 3,000 constituents, the Index covers approximately 85% of the global investable equity opportunity set. The MSCI ACWI Growth Index captures large and mid-cap securities exhibiting overall growth style characteristics across 23 developed markets countries and 24 emerging markets countries. The MSCI ACWI Value Index captures large and mid-cap securities exhibiting overall value style characteristics across 23 developed markets countries and 24 emerging markets countries. The MSCI ACWI ex USA Index captures large and mid-cap representation across 22 of 23 developed markets countries (excluding the United States) and 24 emerging markets countries. With approximately 2,300 constituents, the Index covers approximately 85% of the global equity opportunity set outside the United States. The MSCI Emerging Markets Index is a free float-adjusted market capitalization-weighted index that is designed to measure the equity market performance of emerging markets. The MSCI Emerging Markets Index consists of the following 24 emerging market country indexes: Brazil, Chile, China, Colombia, Czech Republic, Egypt, Greece, Hungary, India, Indonesia, Korea, Kuwait, Malaysia, Mexico, Peru, Philippines, Poland, Qatar, Saudi Arabia, South Africa, Taiwan, Thailand, Turkey and United Arab Emirates. The S&P 500® Index is the Standard & Poor’s Composite Index of 500 stocks and is a widely recognized, unmanaged index of common stock prices. The Brent Crude Oil Index is a major trading classification of sweet light crude oil that serves as a major benchmark price for purchases of oil worldwide. The MSCI Japan Index is designed to measure the performance of the large and mid-cap segments of the Japanese market. With approximately 250 constituents, the Index covers approximately 85% of the free float-adjusted market capitalization in Japan. The Bloomberg Global Aggregate Bond Index is a flagship measure of global investment grade debt from 28 local currency markets. This multi-currency benchmark includes treasury, government-related, corporate and securitized fixed-rate bonds from both developed and emerging markets issuers. The MSCI United Kingdom Index is designed to measure the performance of the large and mid-cap segments of the U.K. market. With nearly 100 constituents, the Index covers approximately 85% of the free float-adjusted market capitalization in the United Kingdom. The MSCI Europe Index captures large and mid-cap representation across 15 developed markets countries in Europe. With approximately 430 constituents, the Index covers approximately 85% of the free float-adjusted market capitalization across the European developed markets equity universe. These indexes have been selected as the benchmarks and are used for comparison purposes only. The volatility (beta) of the Composite may be greater or less than the respective benchmarks. It is not possible to invest directly in these indexes. |
Editor’s Note: The summary bullets for this article were chosen by Seeking Alpha editors.
Editor’s Note: This article discusses one or more securities that do not trade on a major U.S. exchange. Please be aware of the risks associated with these stocks.
Be the first to comment