

Liudmila Chernetska
If it feels like this bear market has been a long one that’s because it has, at least by the standards of corrections since the Financial Crisis.
Ben Carlson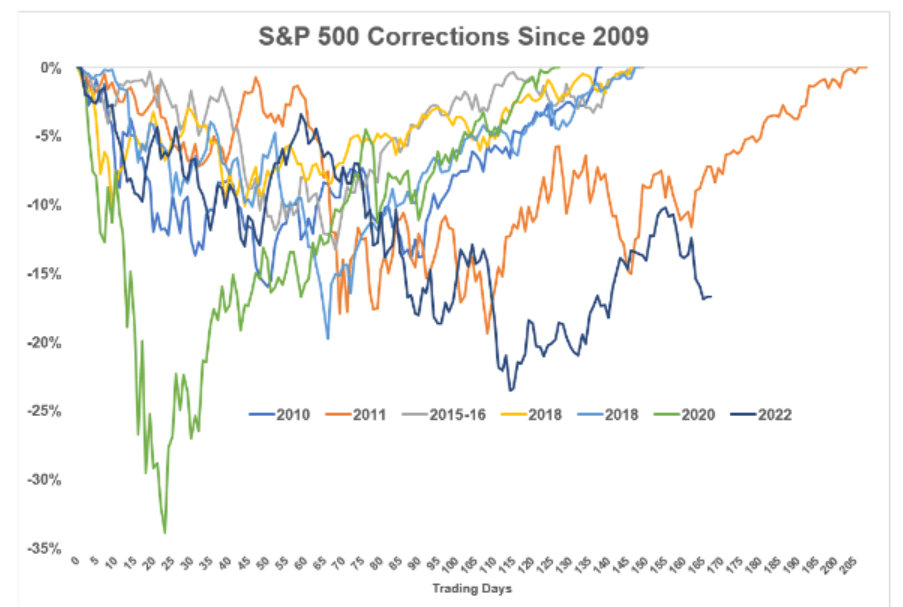
We’ve seen incredible crashes and face-ripping rallies, including the last bear market rally, which saw the average Nasdaq stock soar 42% in two months.
This isn’t unusual since recessionary bear markets tend to be long and have four bear market rallies on average. But the longest bear market, the Tech Crash of 2000, lasted 31 months and had six bear market rallies.
Daily Shot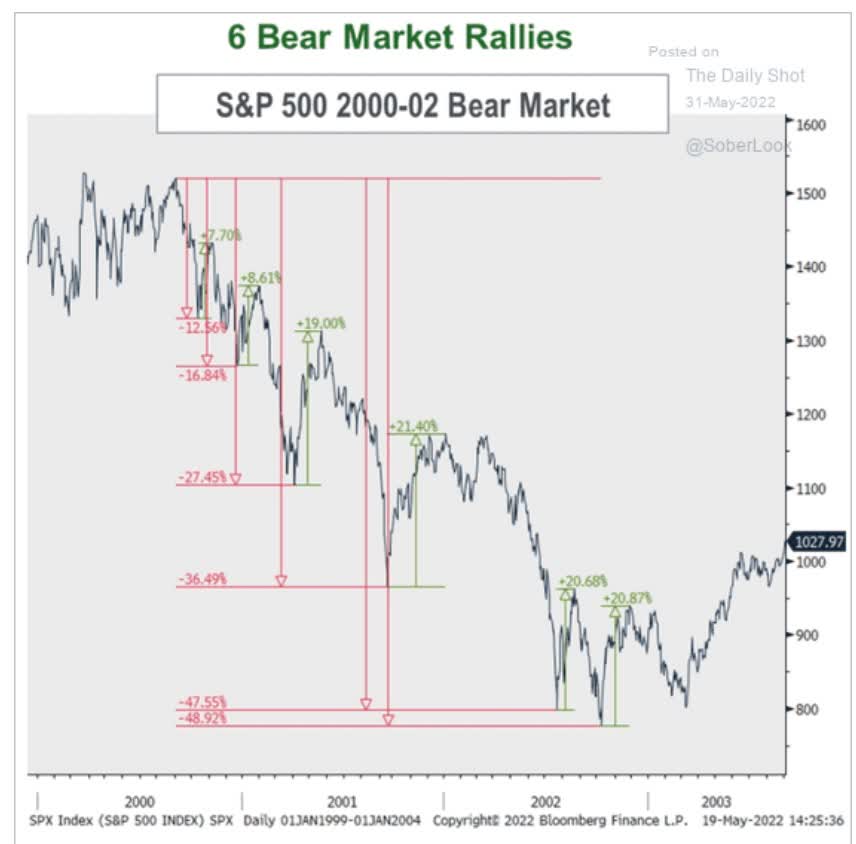
If you feel frustrated by a failed 17% rally, imagine how it felt to have three 21% bear market rallies fail. I don’t have to imagine because I lived through the tech crash and I remember well the sense of despair investors felt.
Is this bear market going to end soon? JPMorgan thinks it might end in Q1 2023. But other analysts, like Morgan Stanley, think the worst is yet to come, and that we might not see new record highs until Q1 2025.
- Three years from record high to new record high is the historical average for recessionary bear markets
What’s a smart long-term investor to do when faced with a potential multi-year bear market? As I learned in the Army “embrace the suck” and harness the power of blue-chip bargain hunting to your advantage.
Charlie Bilello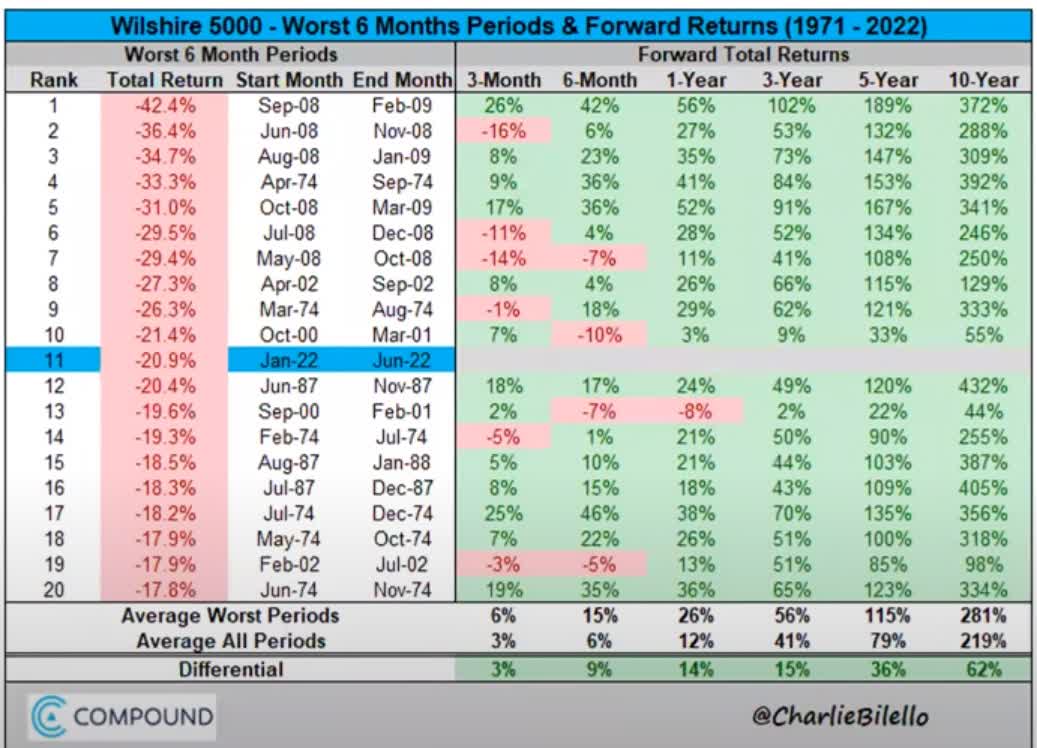
After the kind of market pain we’ve just suffered through, the average 10-year gain is 281%, or nearly 4X returns off the lows.
Whether those lows were back in June or are still in our future, the point is that more blue-chip bargains you buy now, the richer you’ll be in three-plus years when stocks are hitting new highs.
In all my articles I’m using the Dividend Kings Zen Research Terminal to find incredible blue-chip opportunities for you to consider.
The Zen Research Terminal is our flagship tool, the easiest and simplest to use if you’re looking for the best blue-chips for your specific goals, time horizon, and risk profile.
But we also have an even simpler tool – the DK Top Buy List.
This showcases our favorite five investing ideas for any given month, from each of our analysts:
- Adam Galas (aka Dividend Sensei)
- Nicholas Ward
- Justin Law (dividend aristocrats and champions guru)
- Brad Thomas (REIT guru)
- Sebastian Wolf (master of European blue-chips)
- Chuck Walston (the newest Dividend King)
Between the six of us, we have almost 300,000 followers.
Today I wanted to highlight this month’s Top Buy List recs, which number 26 companies (four overlapping ones).
Let me show you why collectively these 26 blue-chips can help you create a rock-star high-yield dividend growth portfolio that can help you:
- profit from this bear market (no matter how long it lasts)
- generate generous, very safe, and steadily growing income in all economic and market conditions
- potentially achieve Nasdaq beating long-term returns that can help you retire in safety and splendor
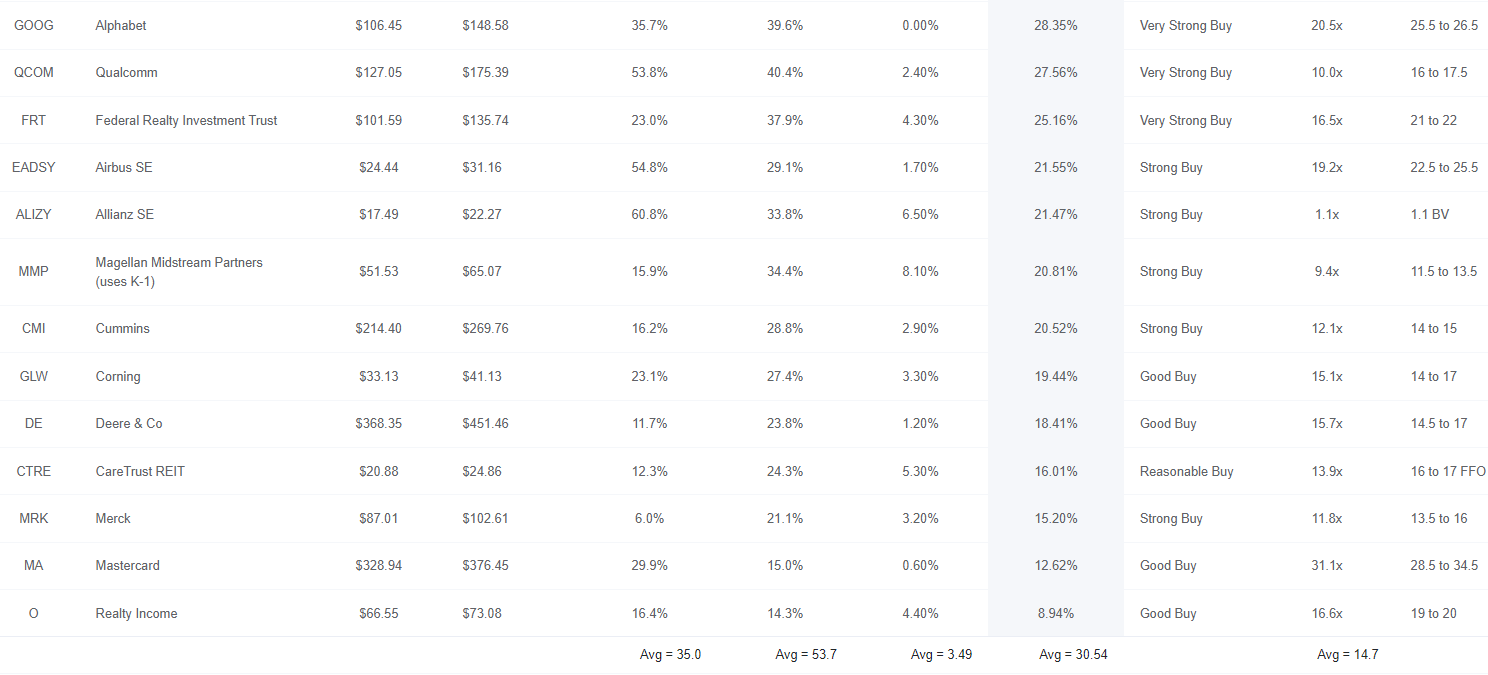
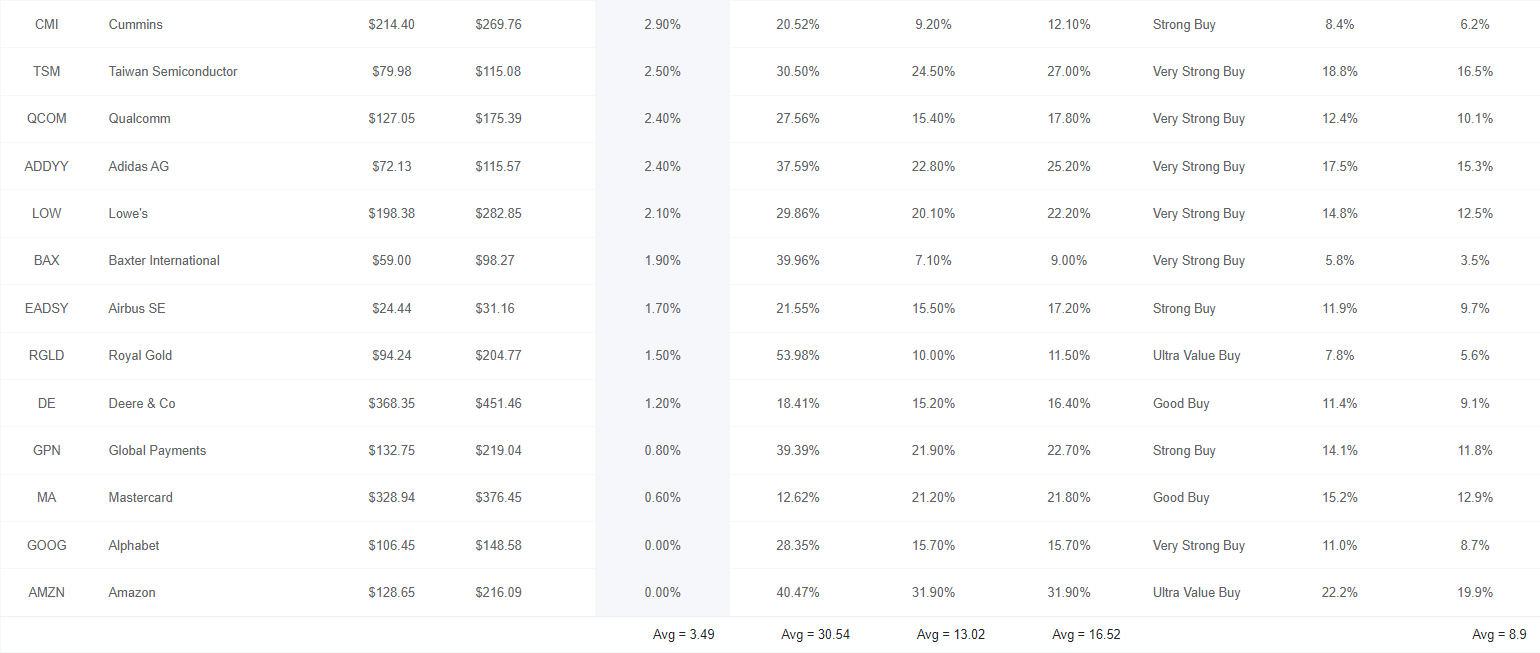
26 Incredible Bear Market Blue-Chip Bargains That Could Change Your Life
(Source: Dividend Kings Zen Research Terminal) (Source: Dividend Kings Zen Research Terminal)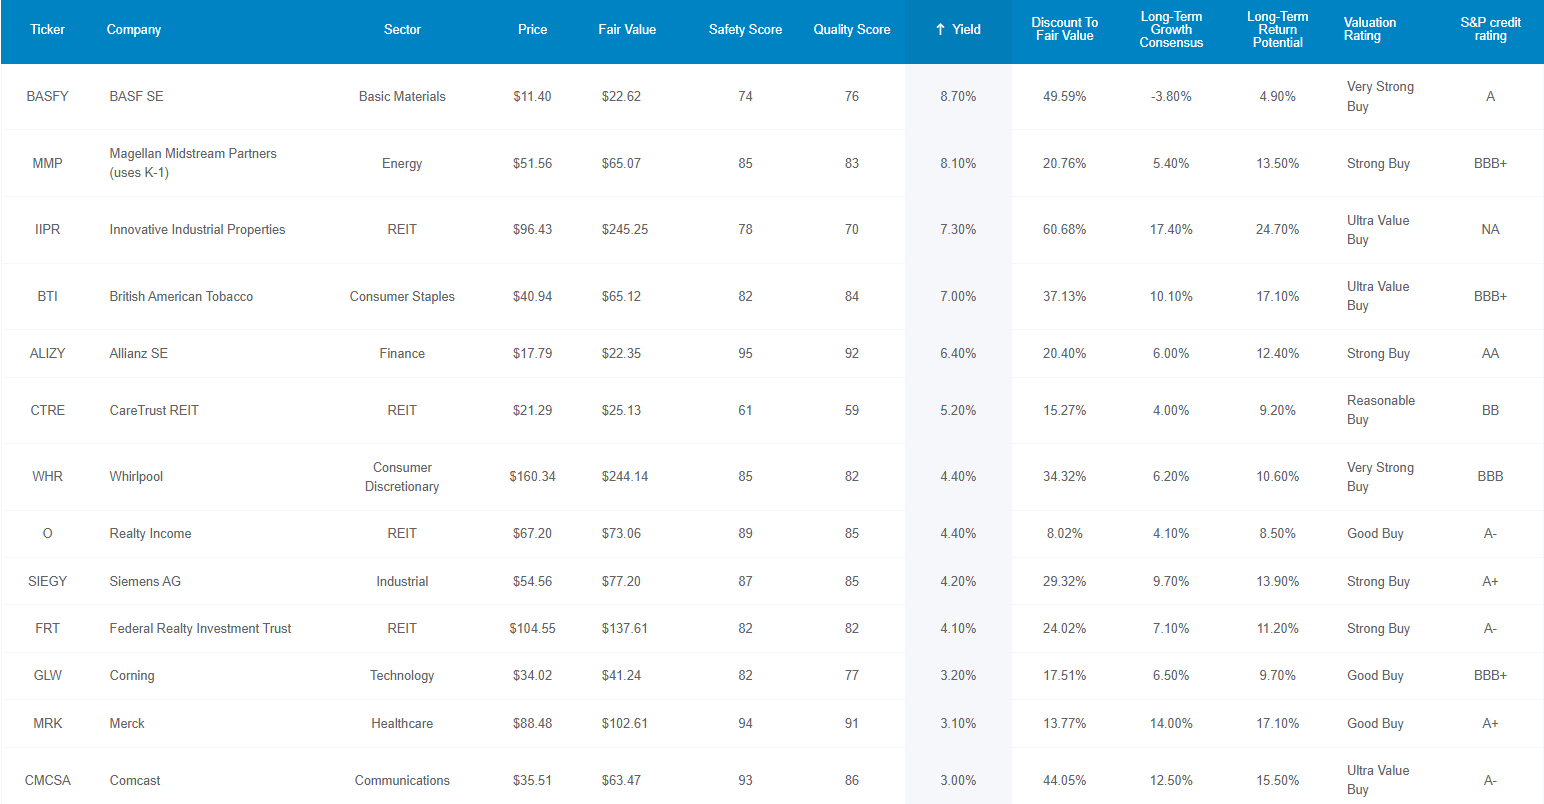
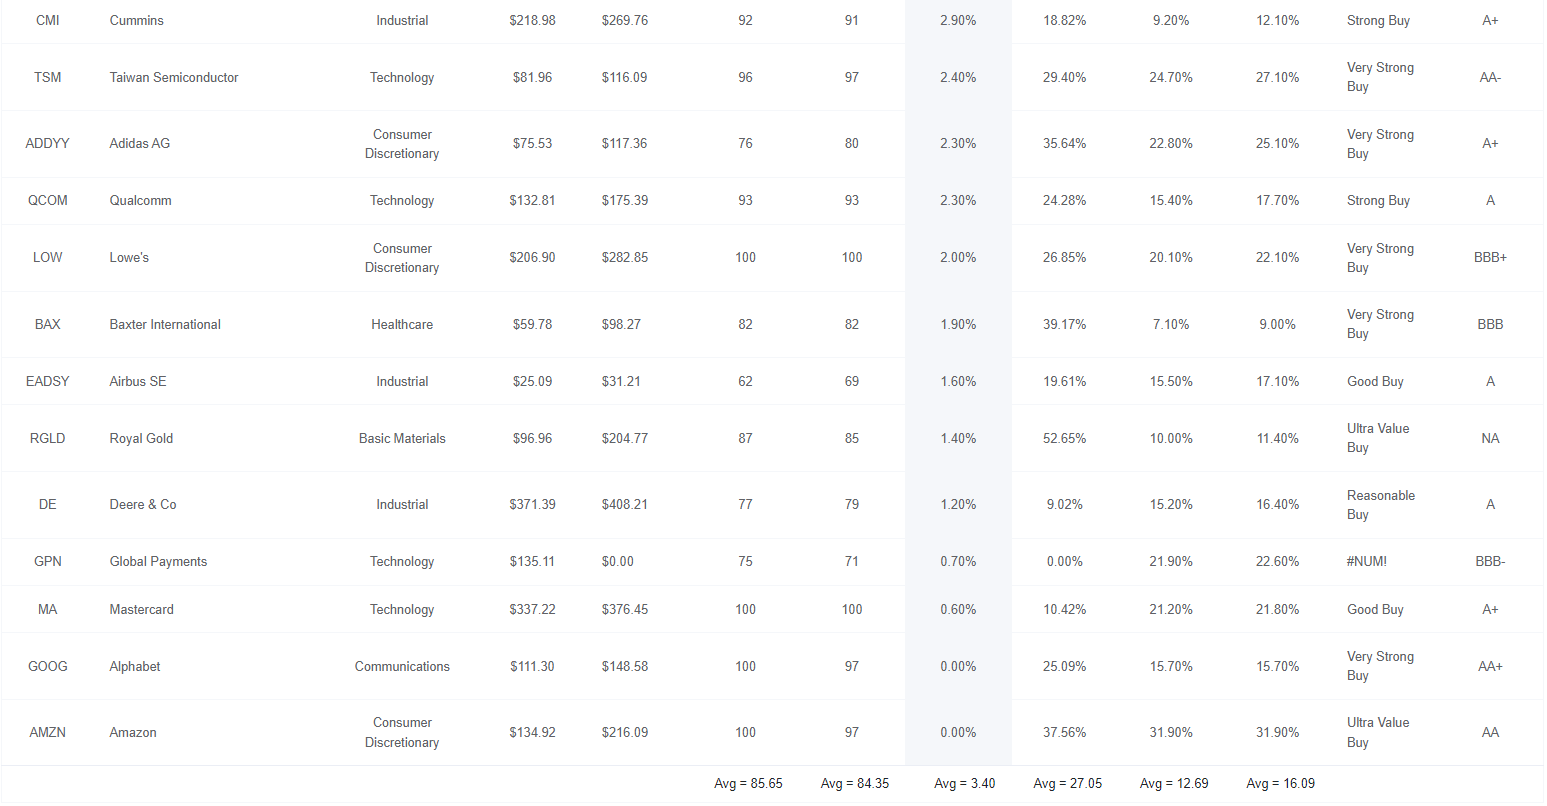
You can get the latest Top Buy list by going to the “lists” and “top buy” list, which will bring up the same data I’m showing here.
I’ve linked to articles showcasing each company’s investment thesis, growth outlook, risk profile, valuation, and total return potential. In order of highest to lowest yield:
Tax Implications
- ALIZY, SIEGY, ADDYY, and BASFY are German companies
- 26.375% dividend tax withholding
- tax credit to recoup the withholding is only available if owned in taxable accounts
- EADSY is a Dutch company
- 15% withholding
- also own in a taxable account to recoup withholding
FAST Graphs Up Front
BASF 2024 Consensus Total Return Potential
(Source: FAST Graphs, FactSet Research)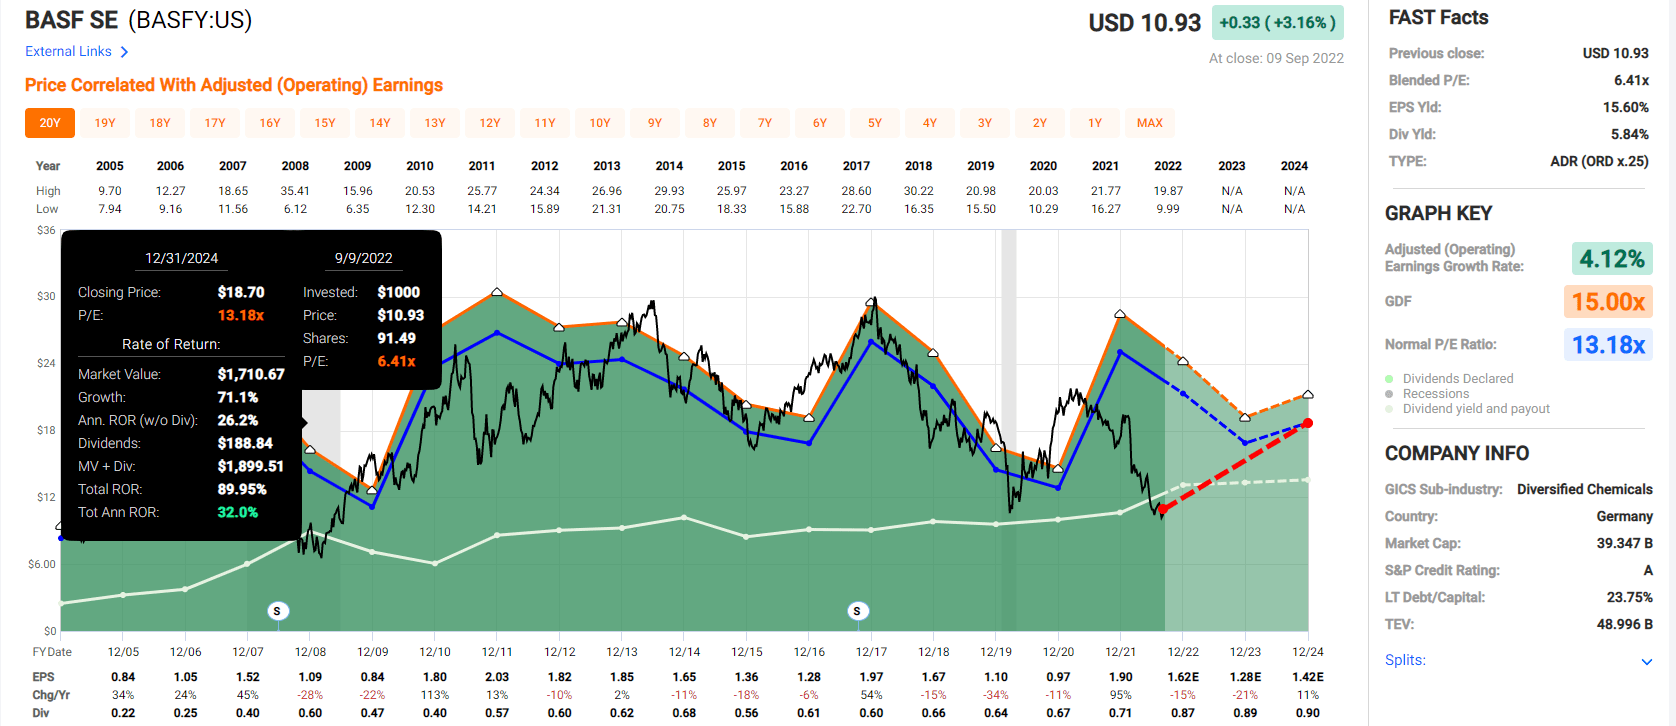
Magellan Midstream Partners 2024 Consensus Total Return Potential
(Source: FAST Graphs, FactSet Research)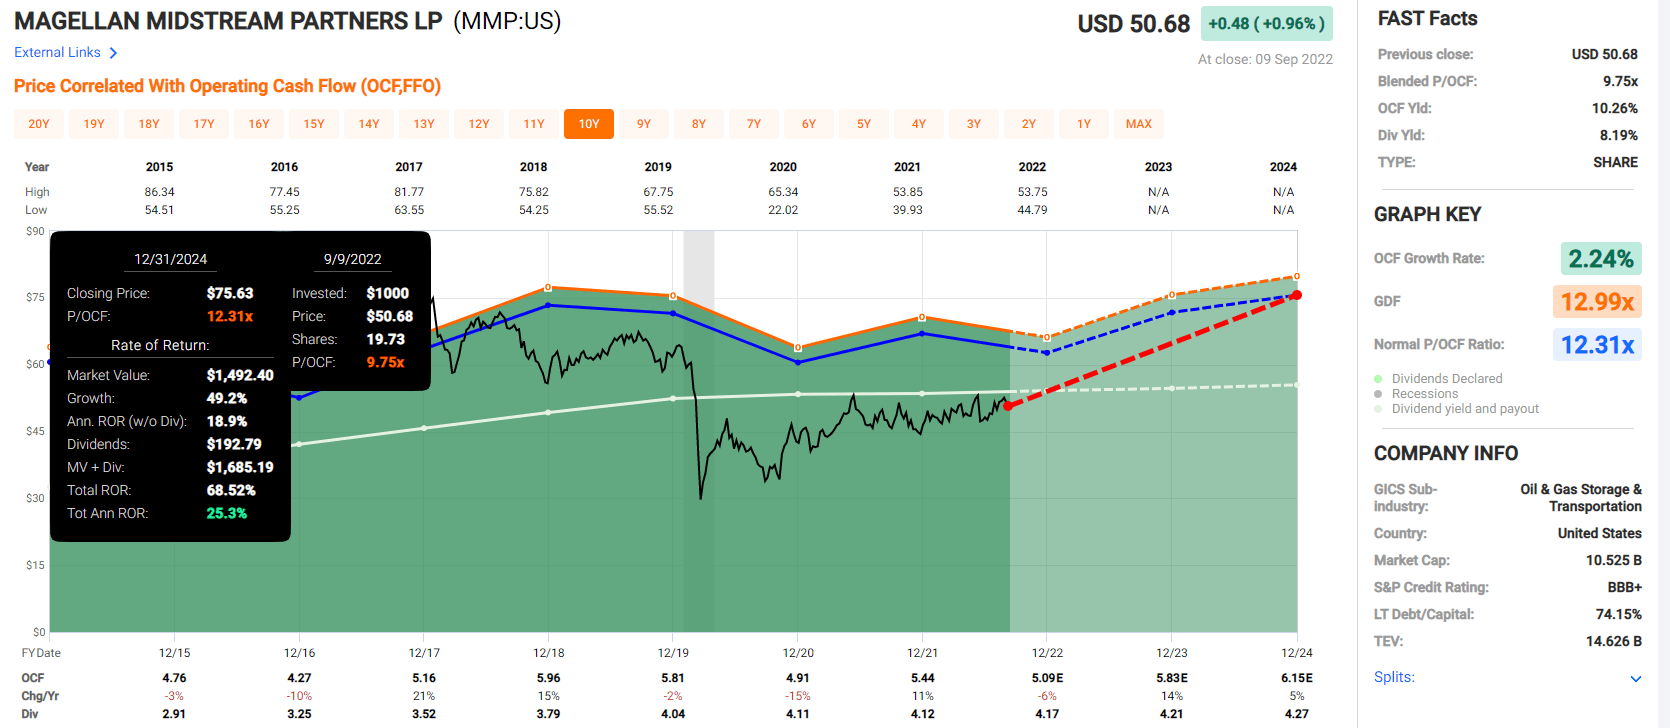
Innovative Industrial Properties 2024 Consensus Total Return Potential
(Source: FAST Graphs, FactSet Research)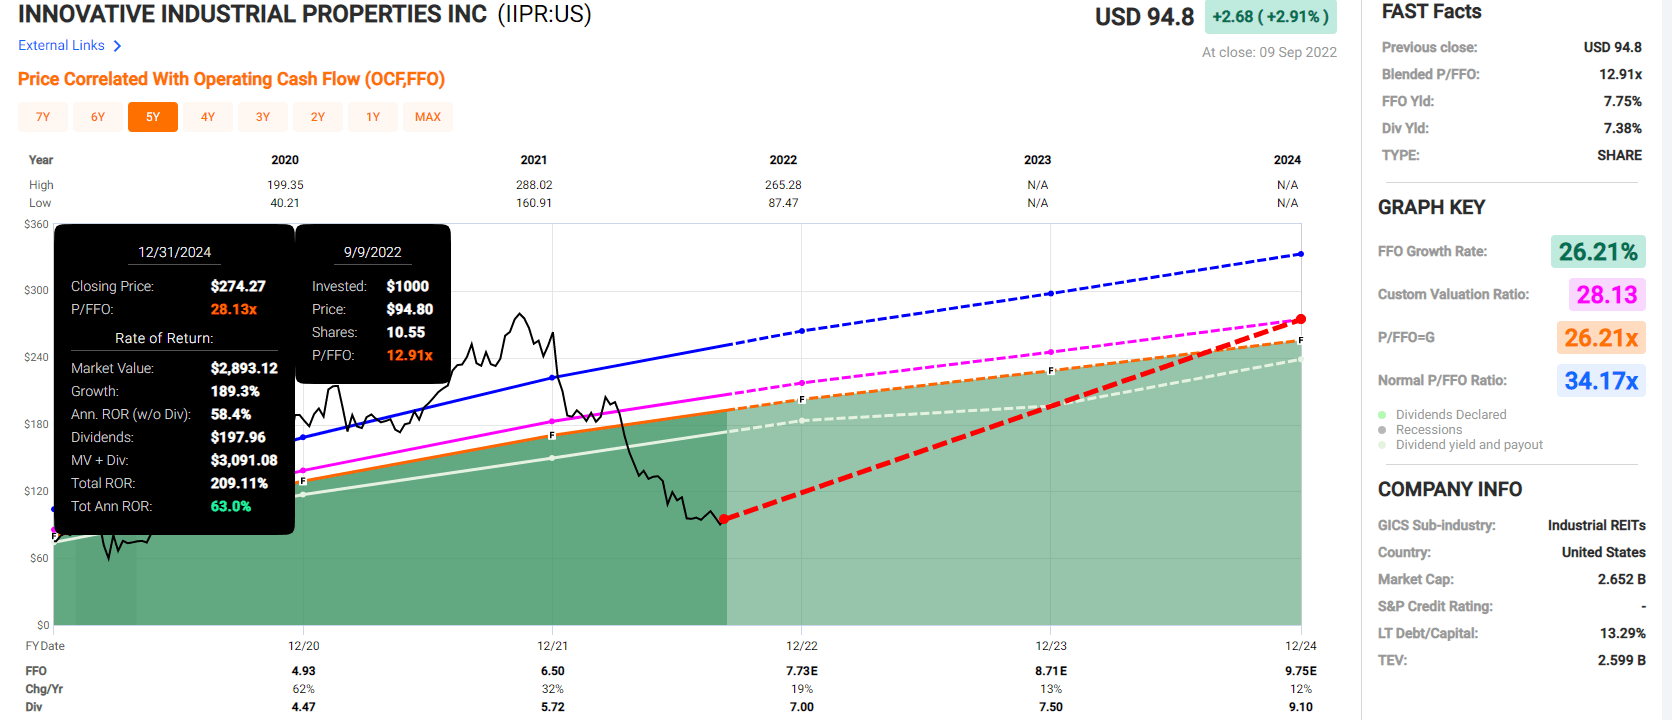
British American Tobacco 2024 Consensus Total Return Potential
(Source: FAST Graphs, FactSet Research)
Allianz 2024 Consensus Total Return Potential (9.4 PE = 1.1 Book Value)
(Source: FAST Graphs, FactSet Research)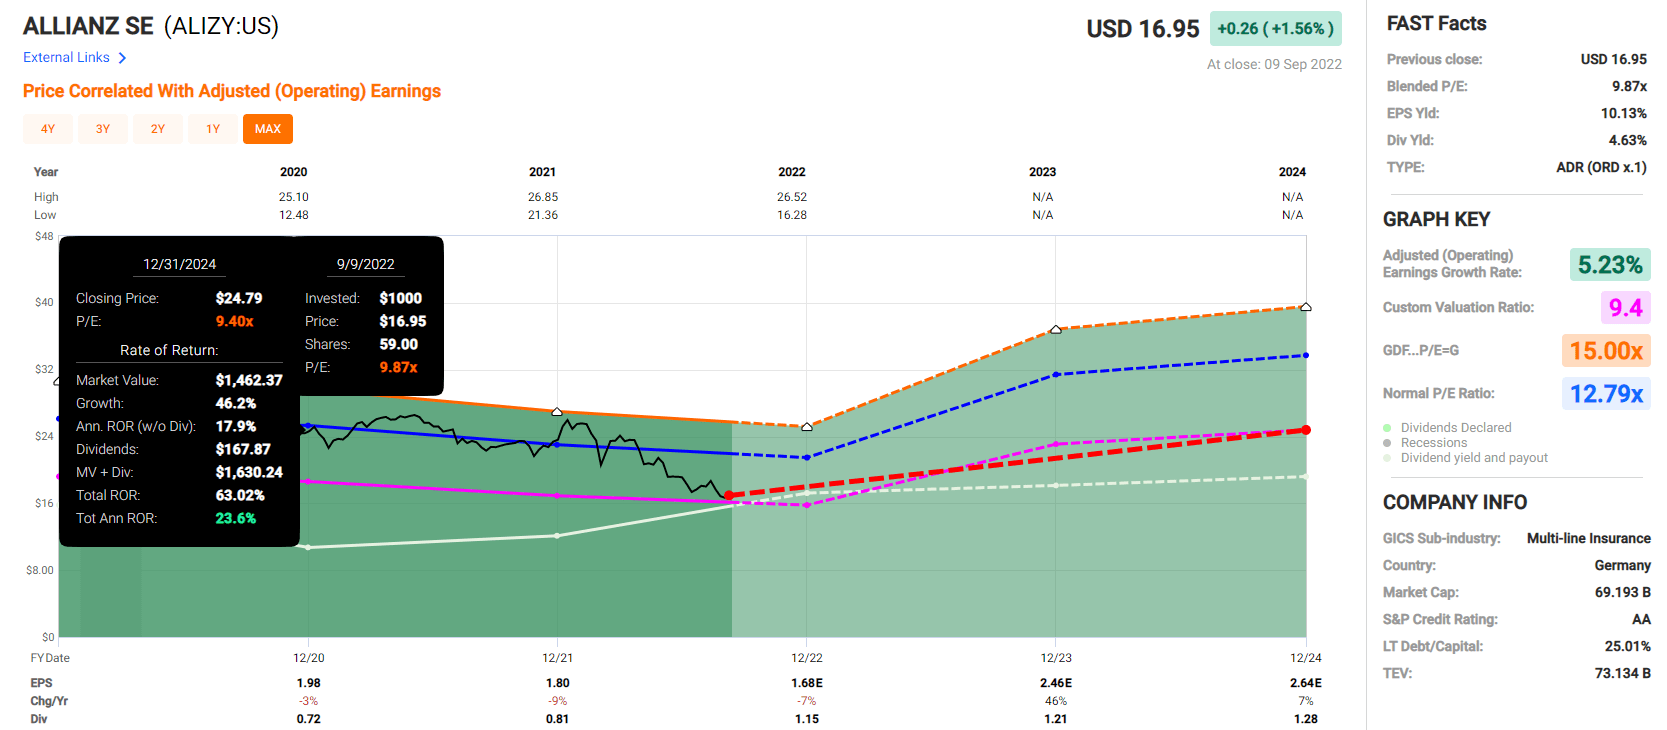
CareTrust REIT 2024 Consensus Total Return Potential
(Source: FAST Graphs, FactSet Research)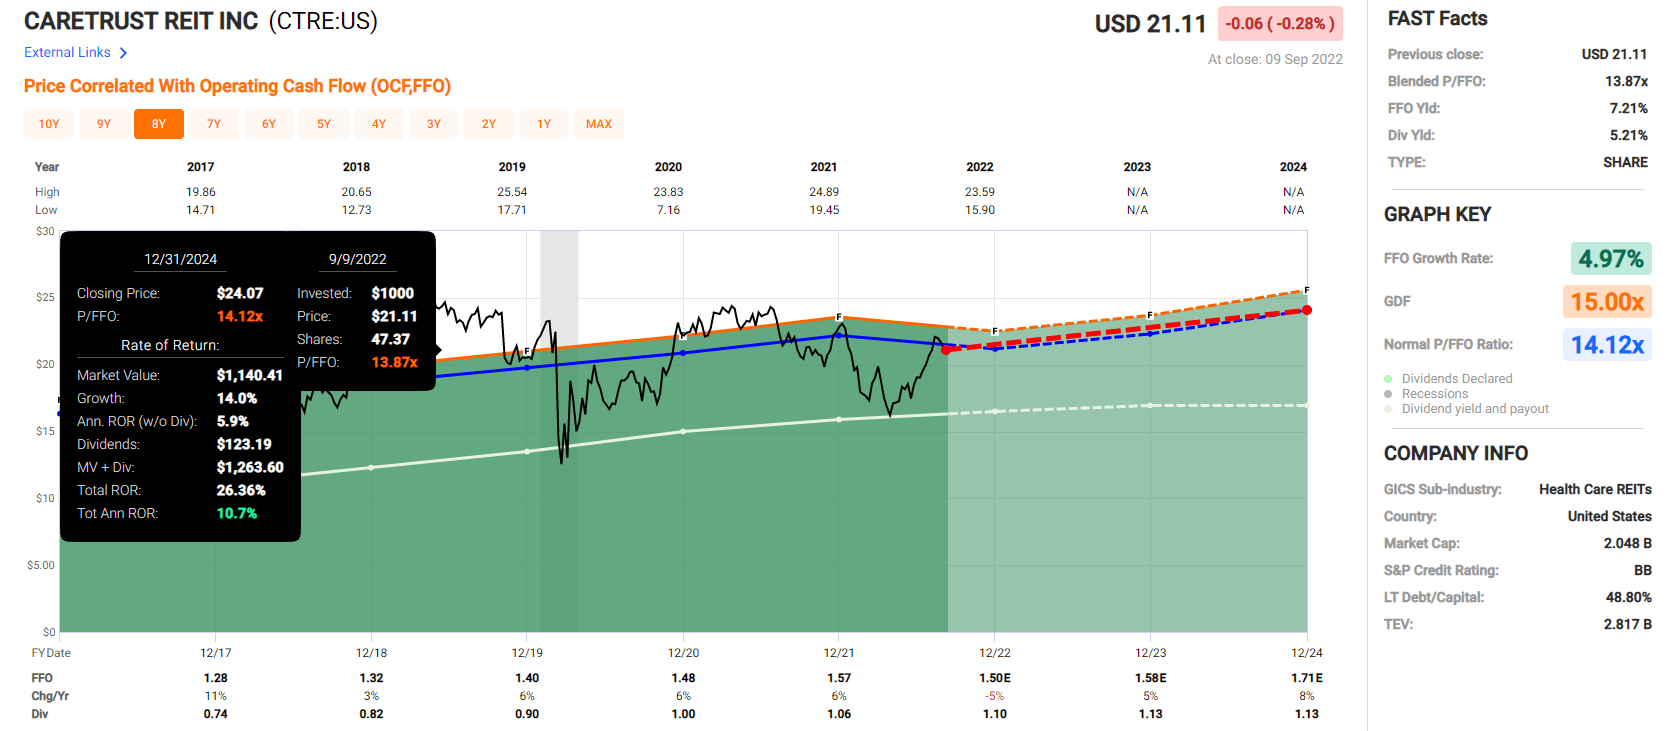
Whirlpool 2024 Consensus Total Return Potential
(Source: FAST Graphs, FactSet Research)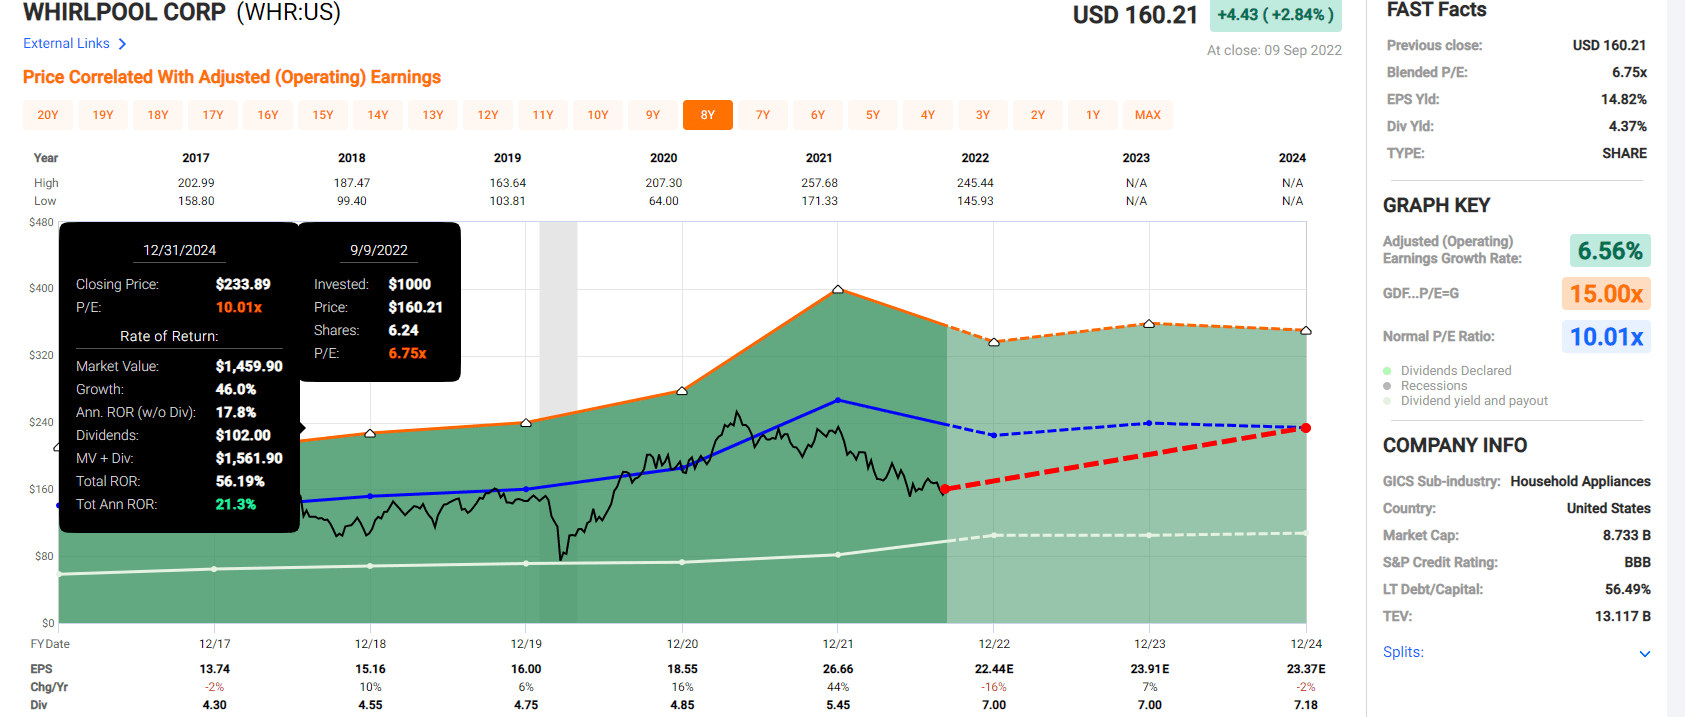
Realty Income 2024 Consensus Total Return Potential
(Source: FAST Graphs, FactSet Research)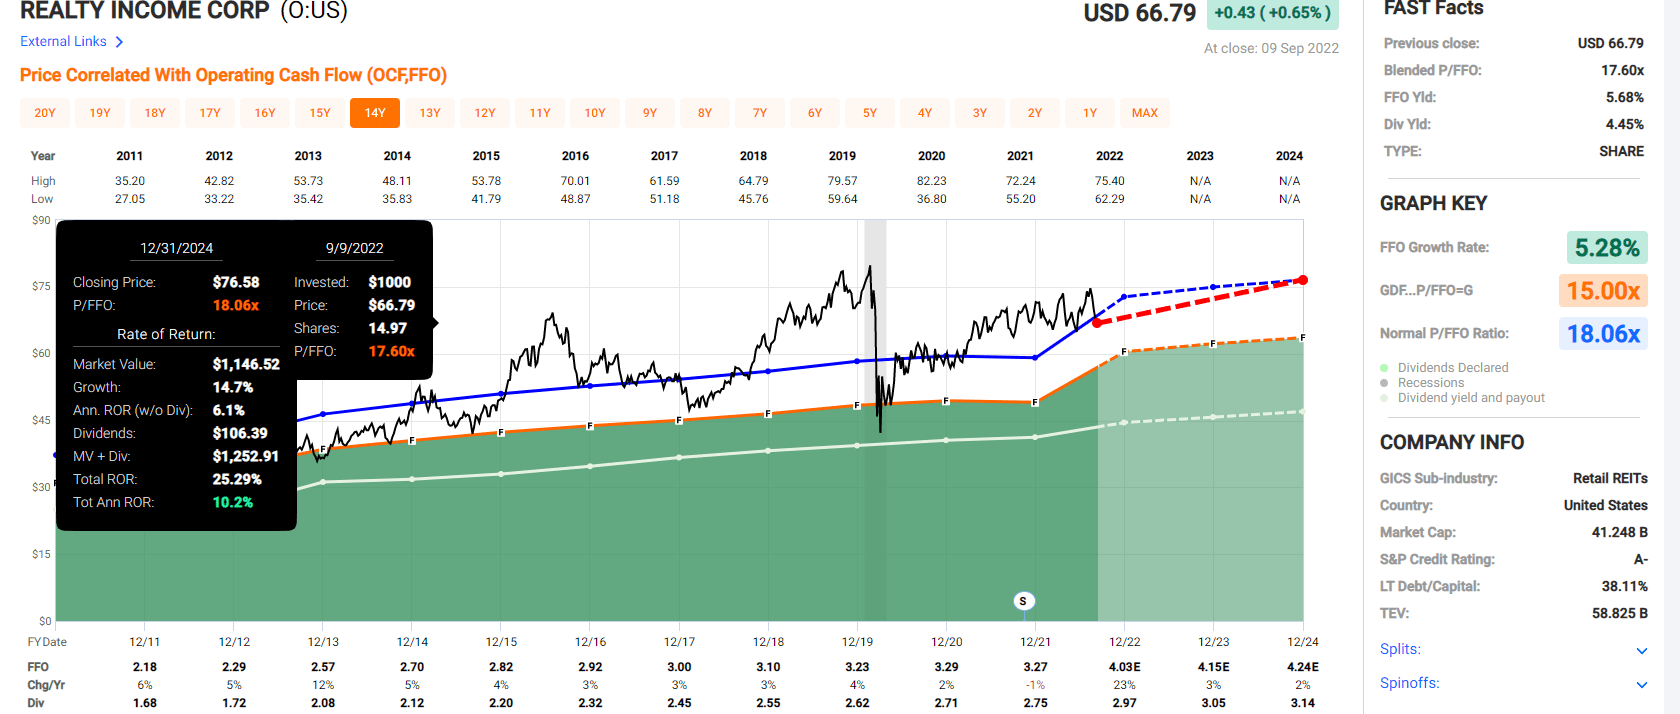
Siemens 2024 Consensus Total Return Potential
(Source: FAST Graphs, FactSet Research)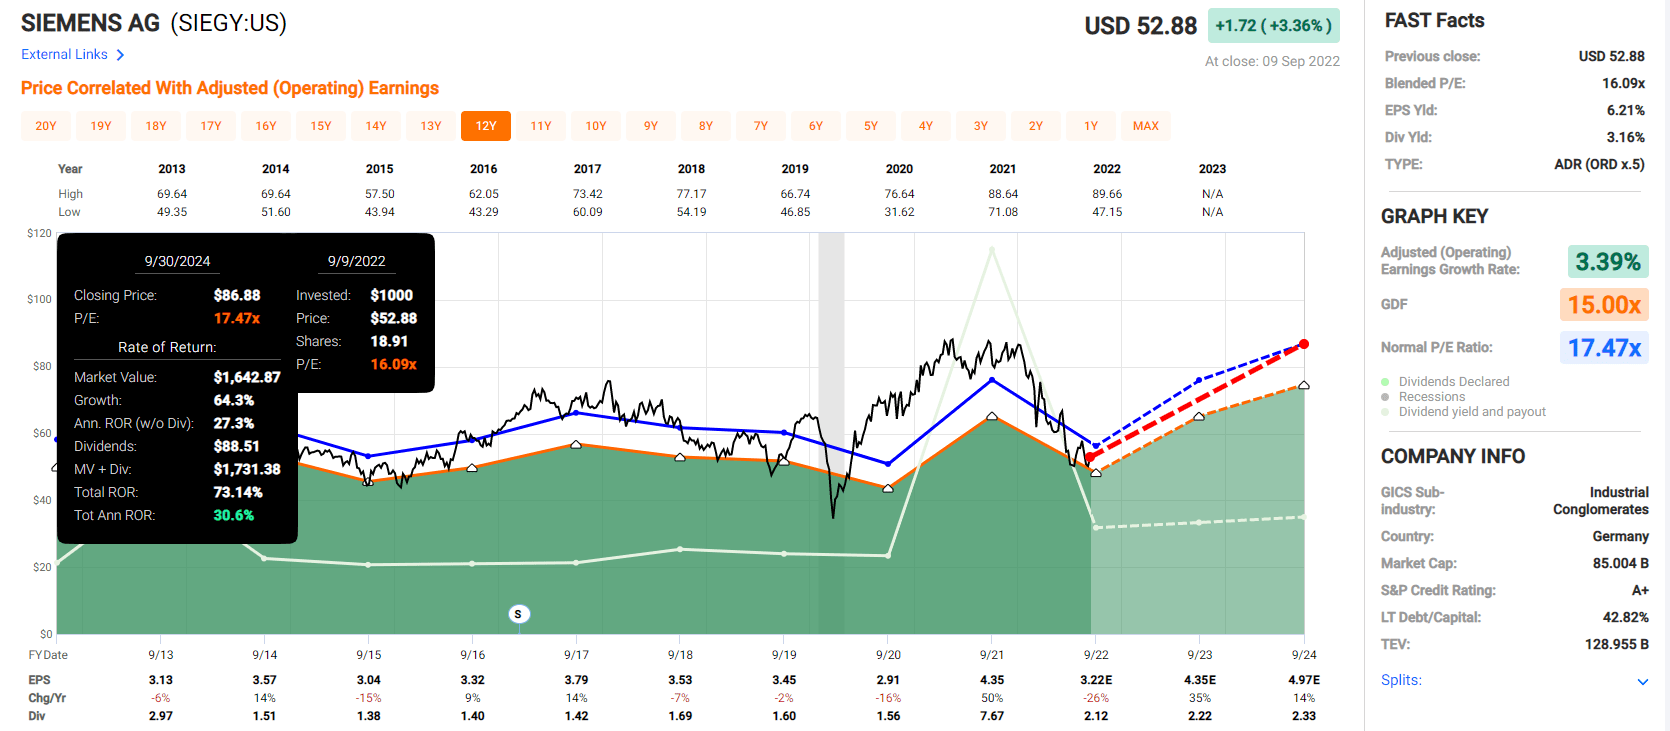
Federal Realty Investment Trust 2024 Consensus Total Return Potential
(Source: FAST Graphs, FactSet Research)
Corning 2024 Consensus Total Return Potential
(Source: FAST Graphs, FactSet Research)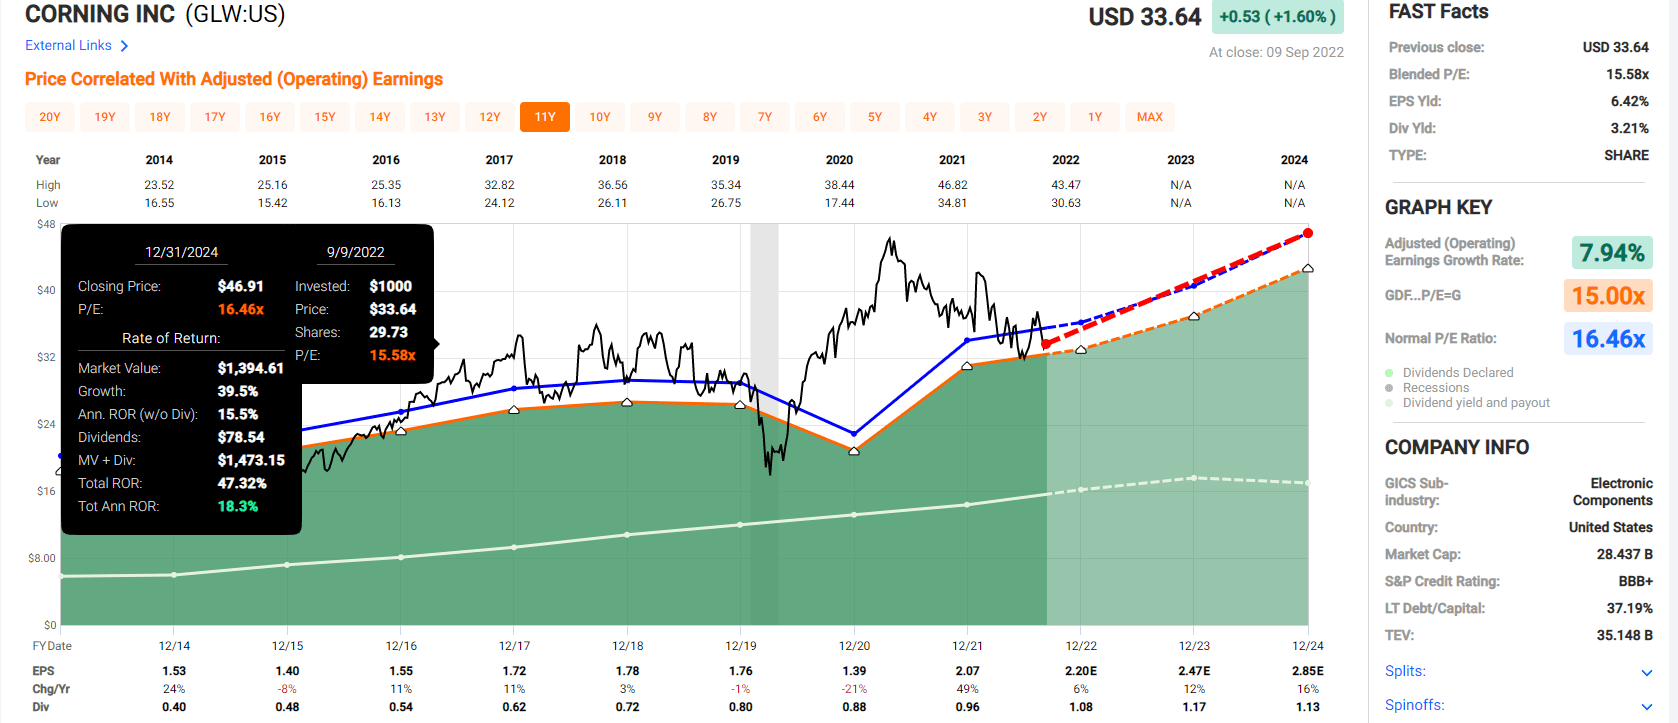
Merck 2024 Consensus Total Return Potential
(Source: FAST Graphs, FactSet Research)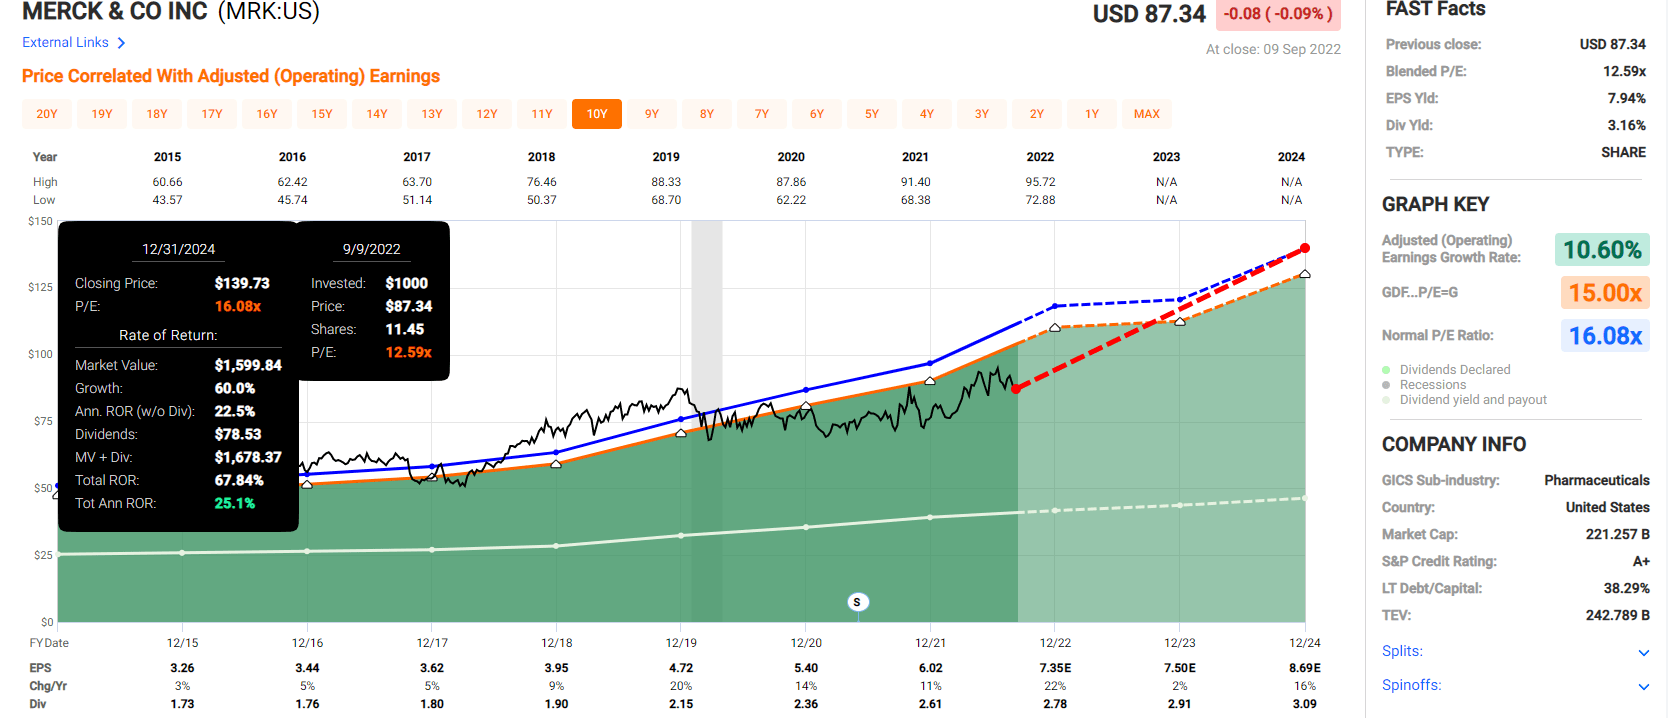
Comcast 2024 Consensus Total Return Potential
(Source: FAST Graphs, FactSet Research)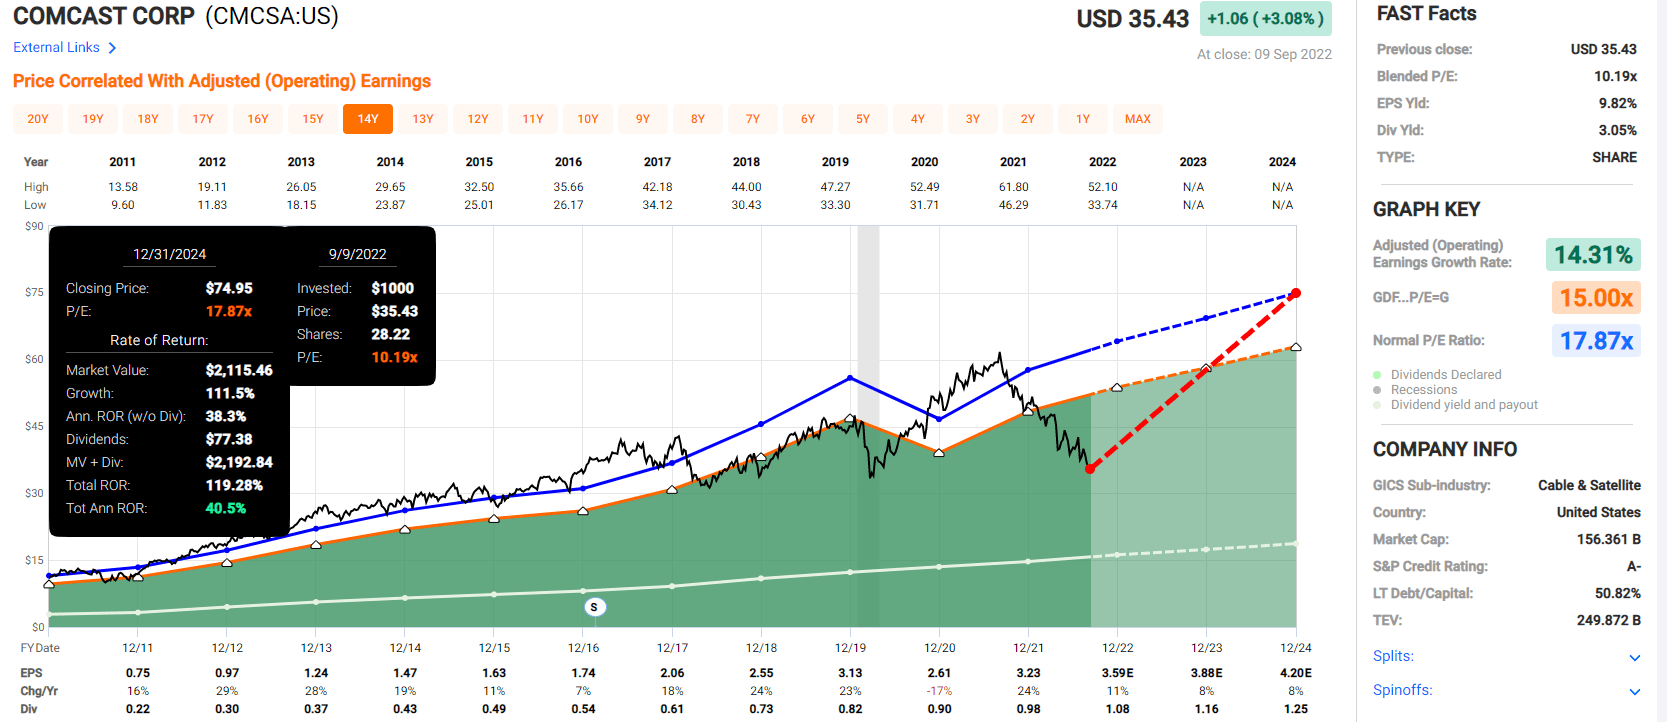
Cummins 2024 Consensus Total Return Potential
(Source: FAST Graphs, FactSet Research)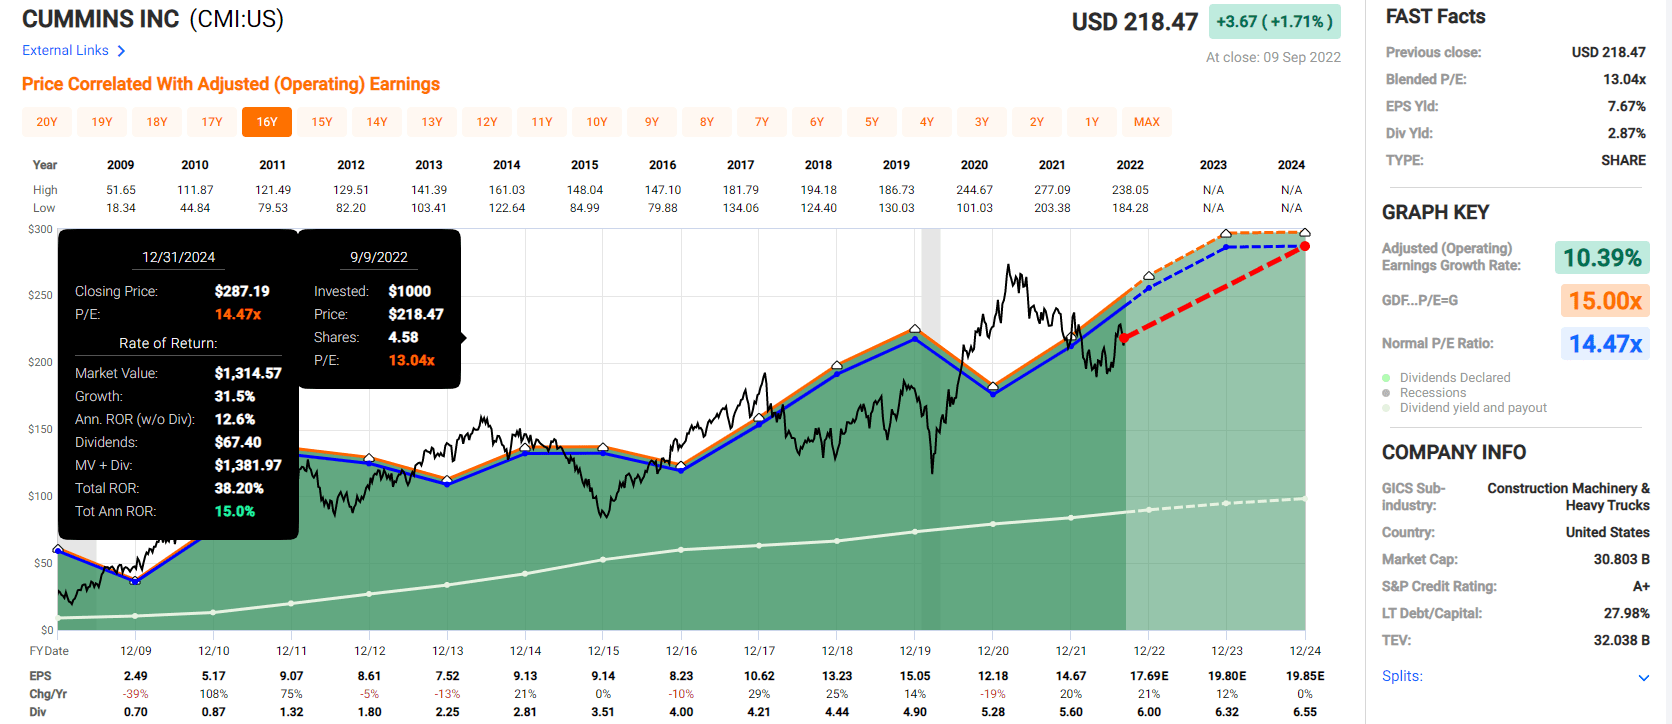
Taiwan Semiconductor 2024 Consensus Total Return Potential
(Source: FAST Graphs, FactSet Research)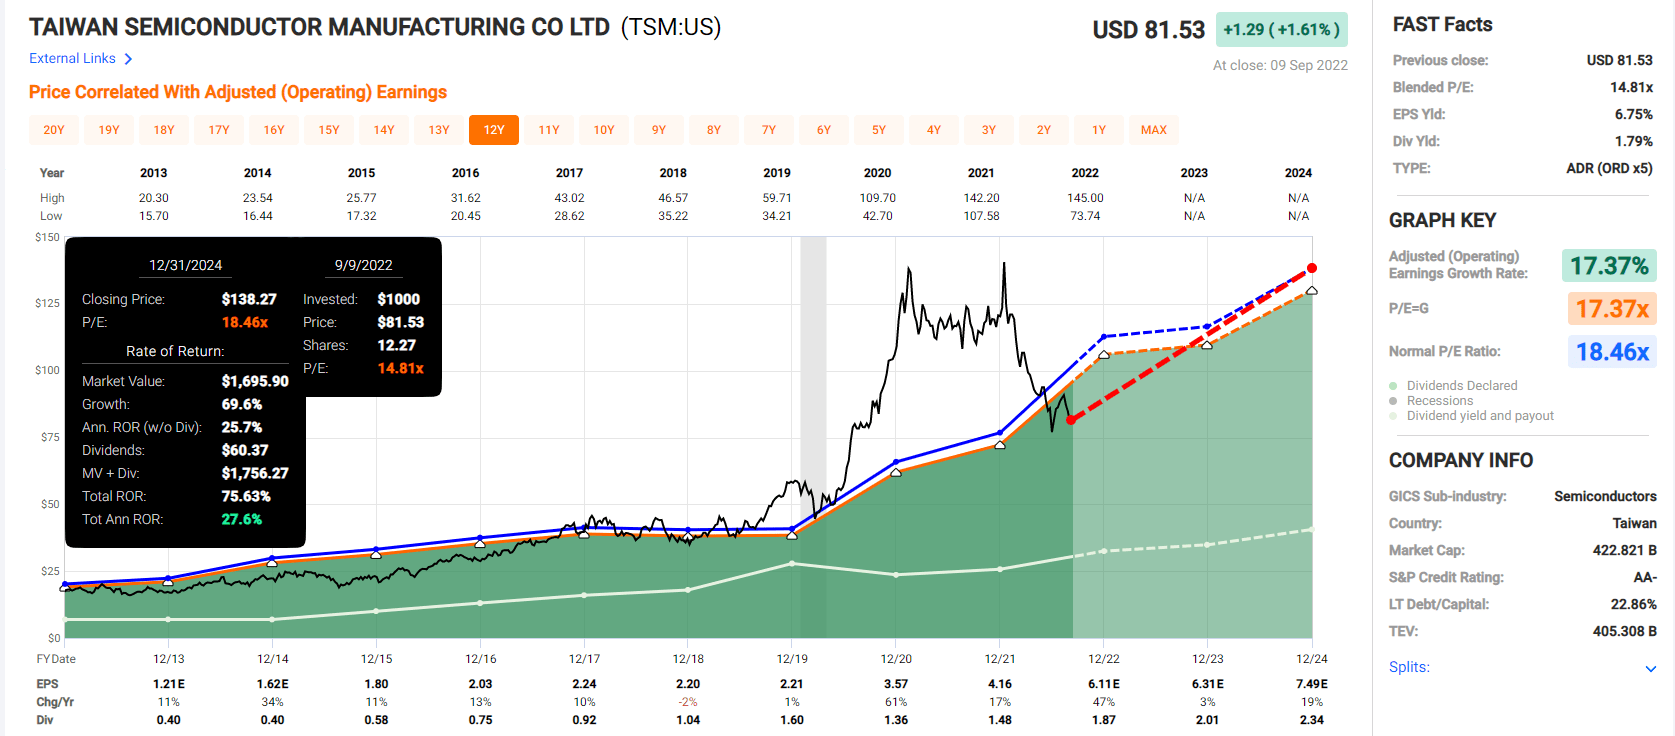
adidas 2024 Consensus Total Return Potential
(Source: FAST Graphs, FactSet Research)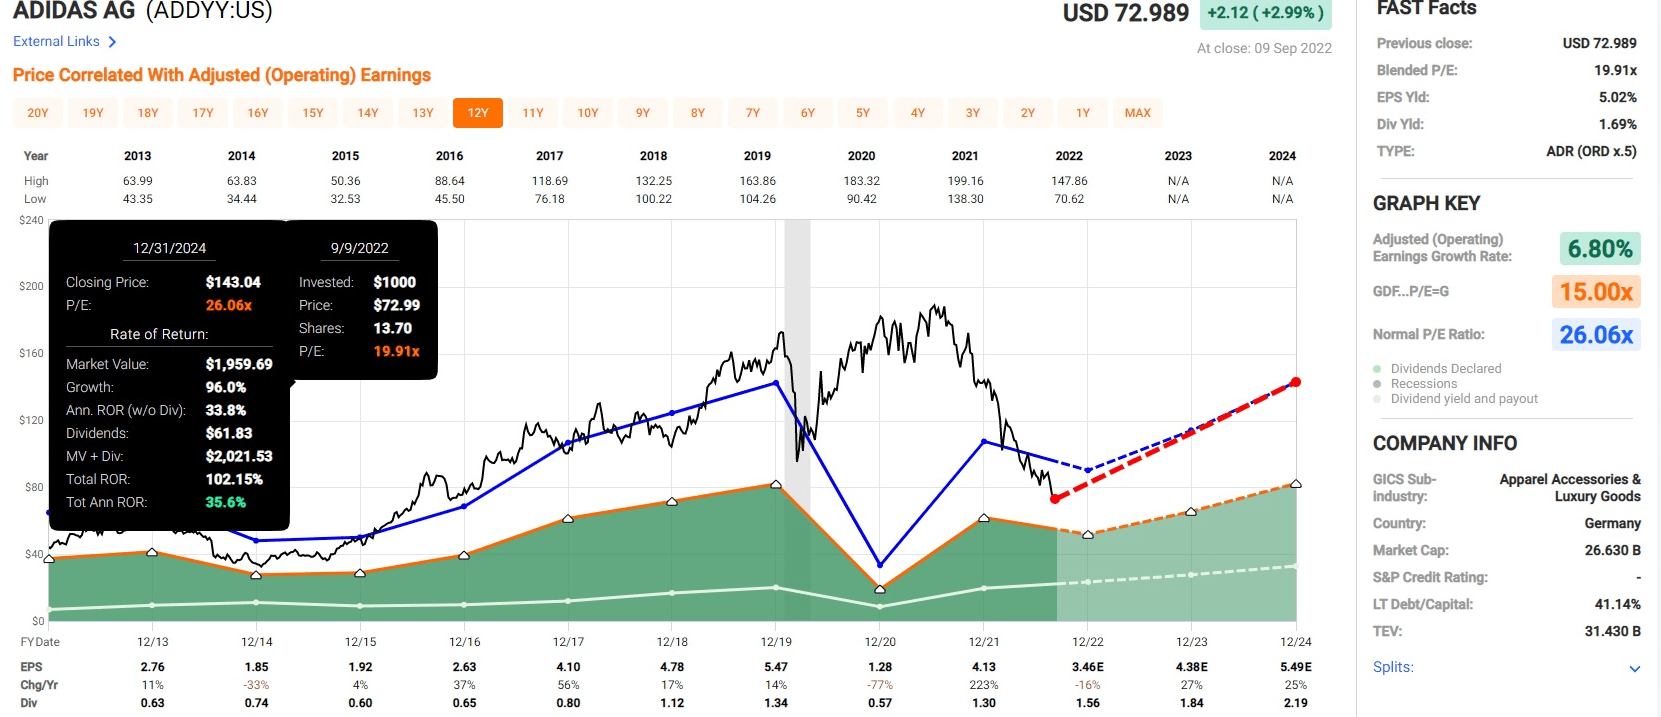
Qualcomm 2024 Consensus Total Return Potential
(Source: FAST Graphs, FactSet Research)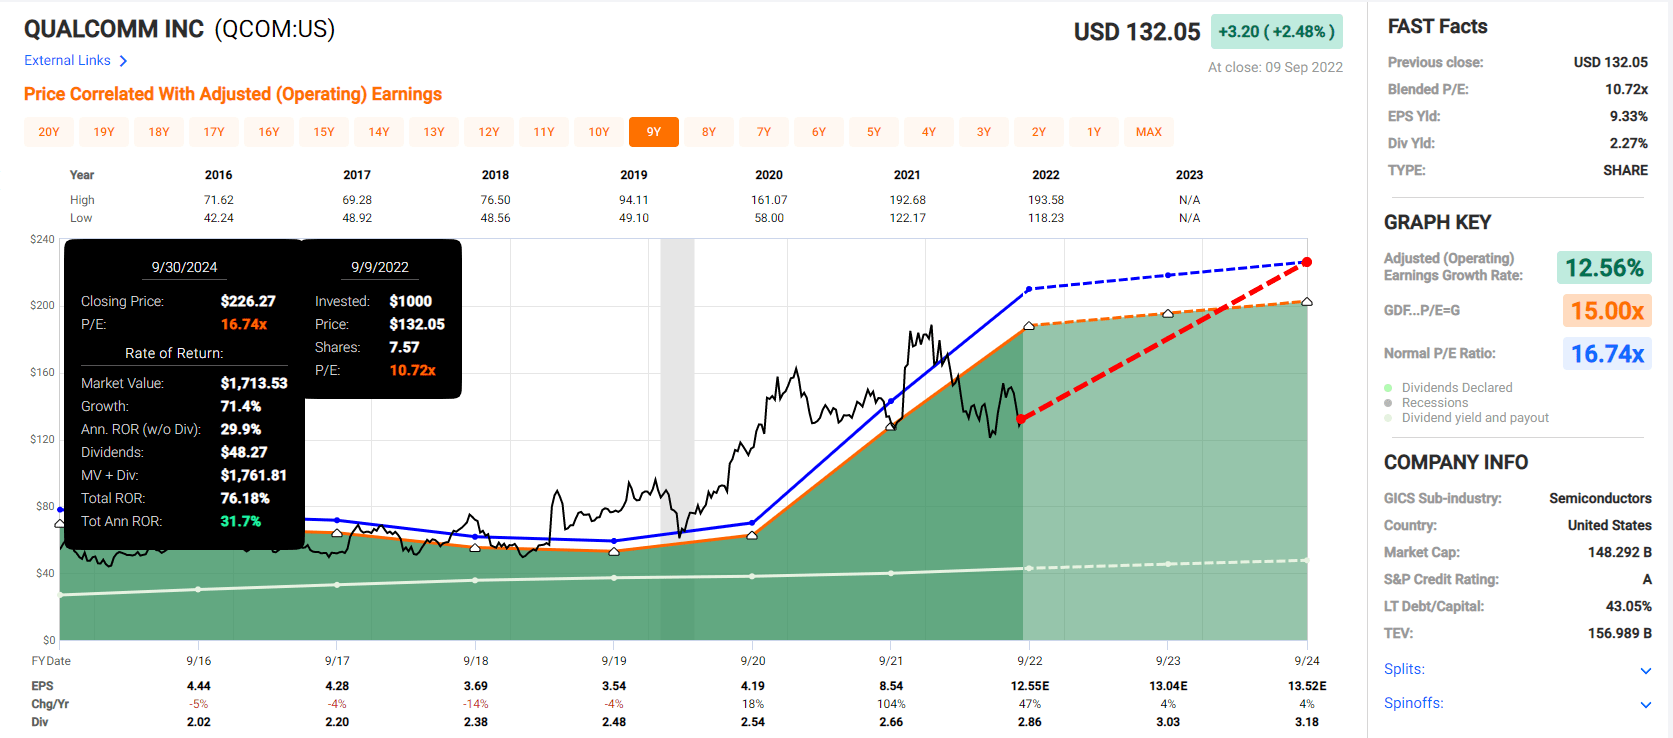
Lowe’s 2024 Consensus Total Return Potential
(Source: FAST Graphs, FactSet Research)
Baxter International 2024 Consensus Total Return Potential
(Source: FAST Graphs, FactSet Research)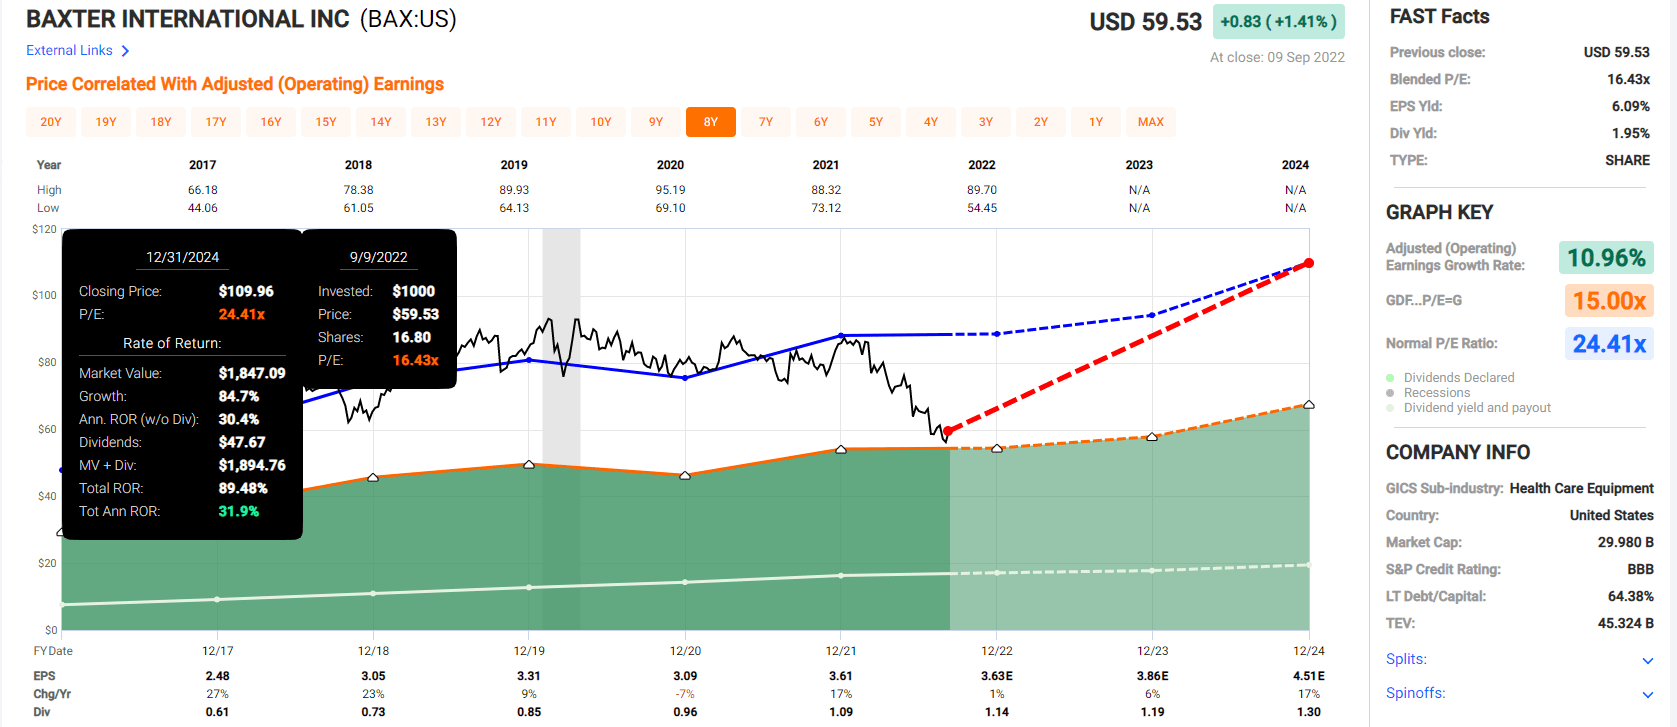
Airbus 2024 Consensus Total Return Potential
(Source: FAST Graphs, FactSet Research)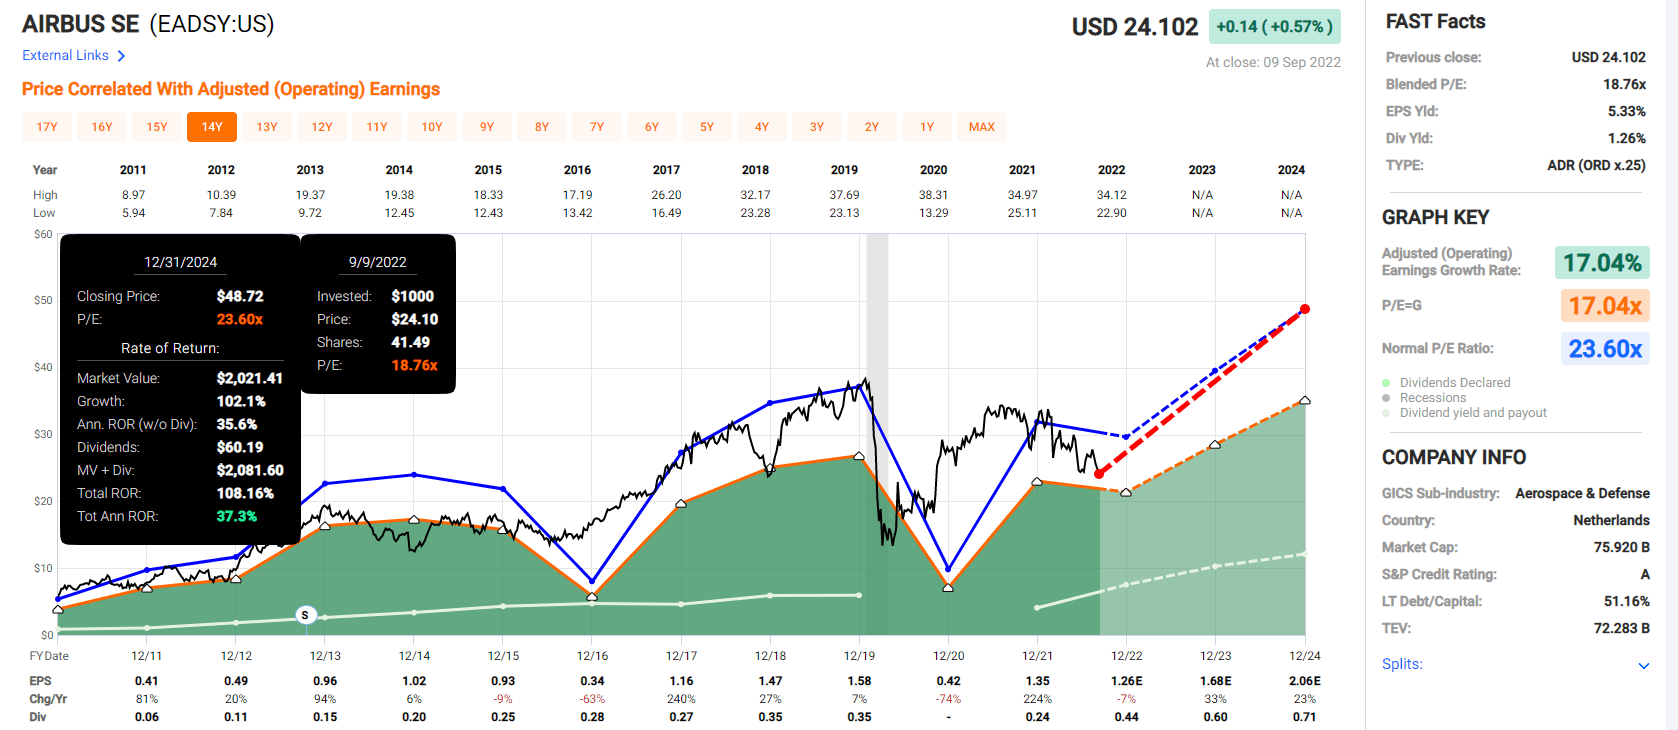
Royal Gold 2024 Consensus Total Return Potential
(Source: FAST Graphs, FactSet Research)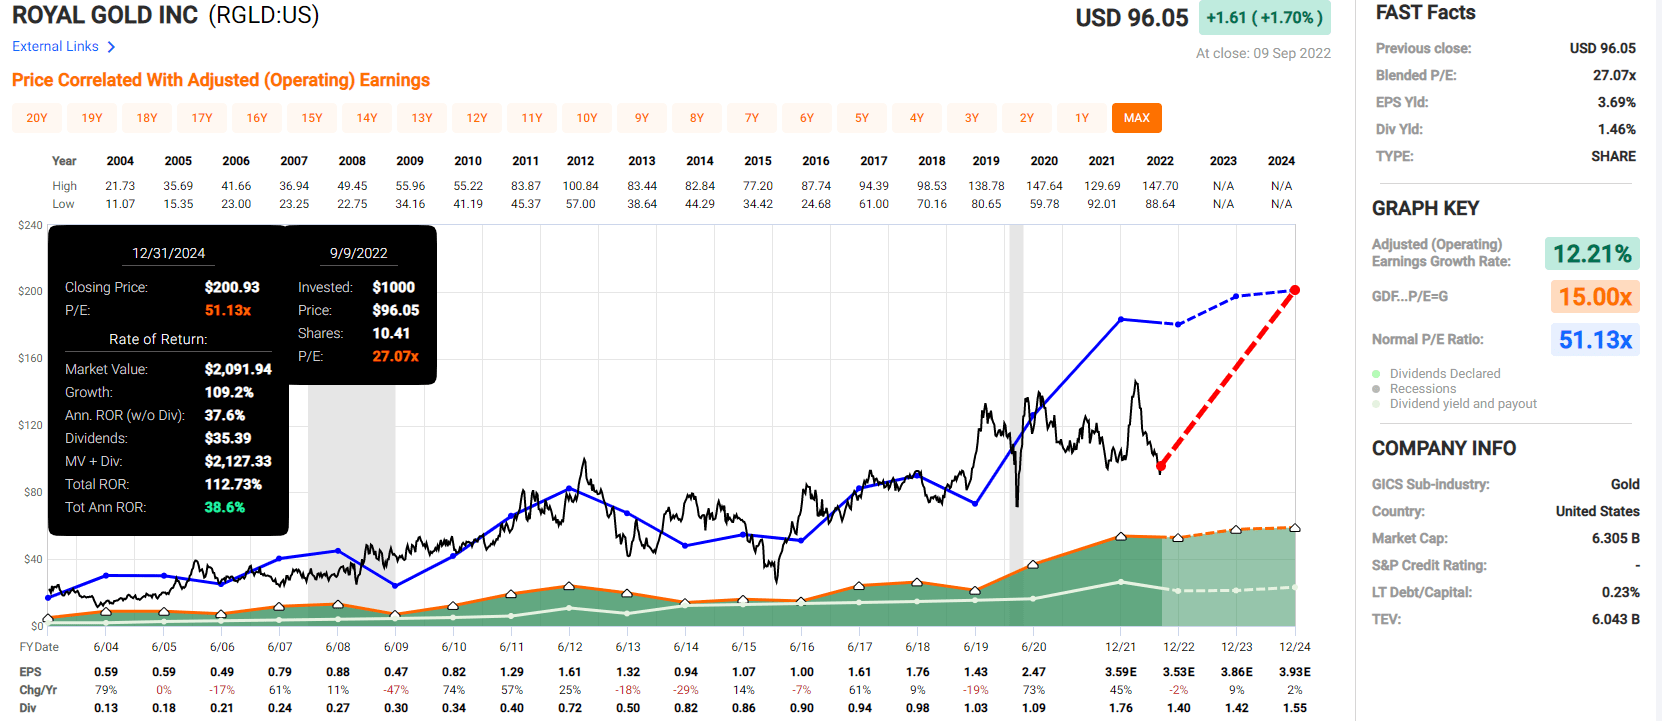
Deer & Co 2024 Consensus Total Return Potential
(Source: FAST Graphs, FactSet Research)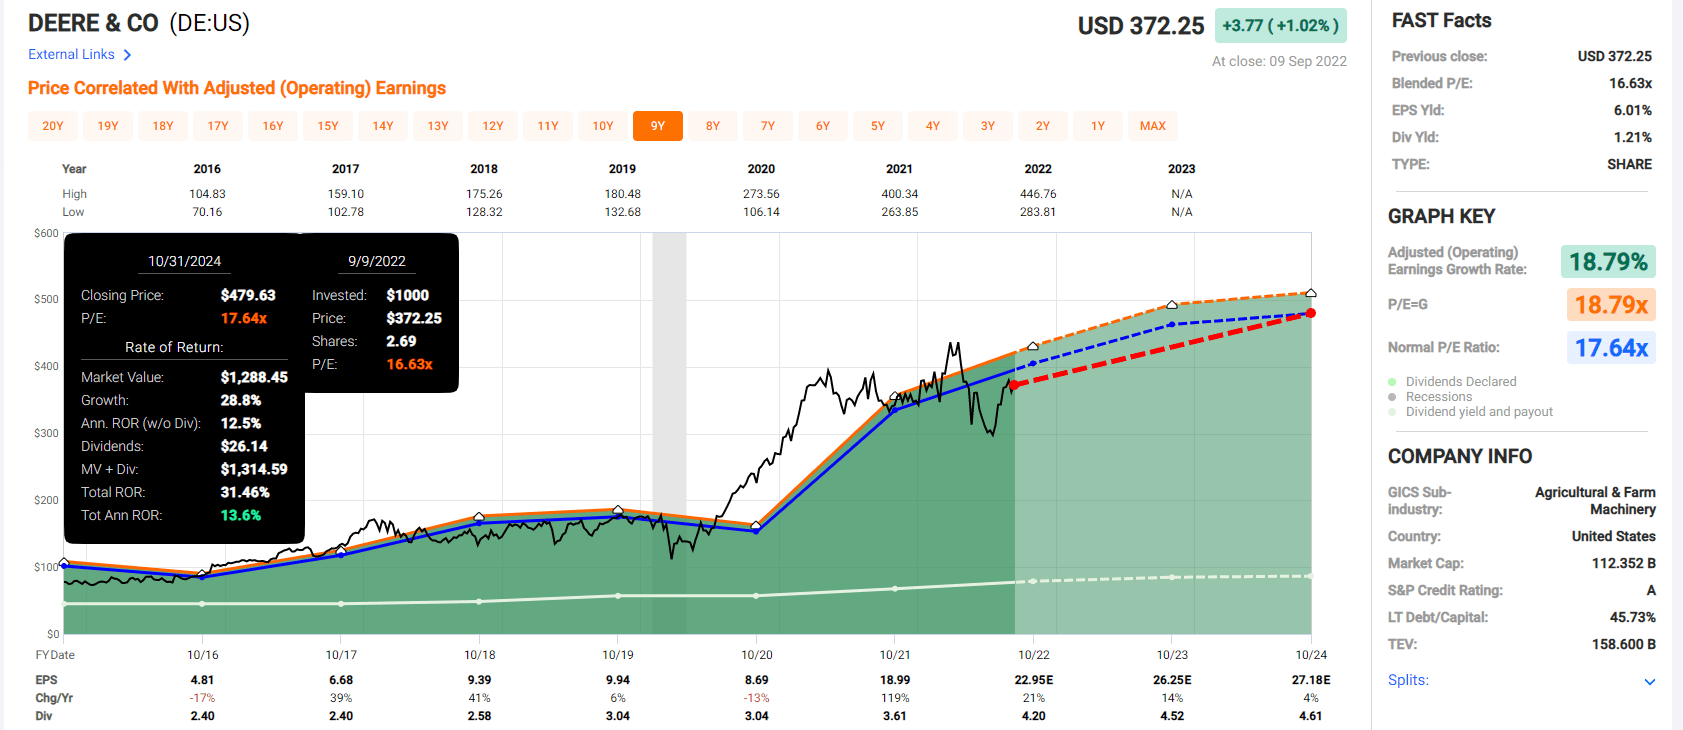
Global Payments 2024 Consensus Total Return Potential
(Source: FAST Graphs, FactSet Research)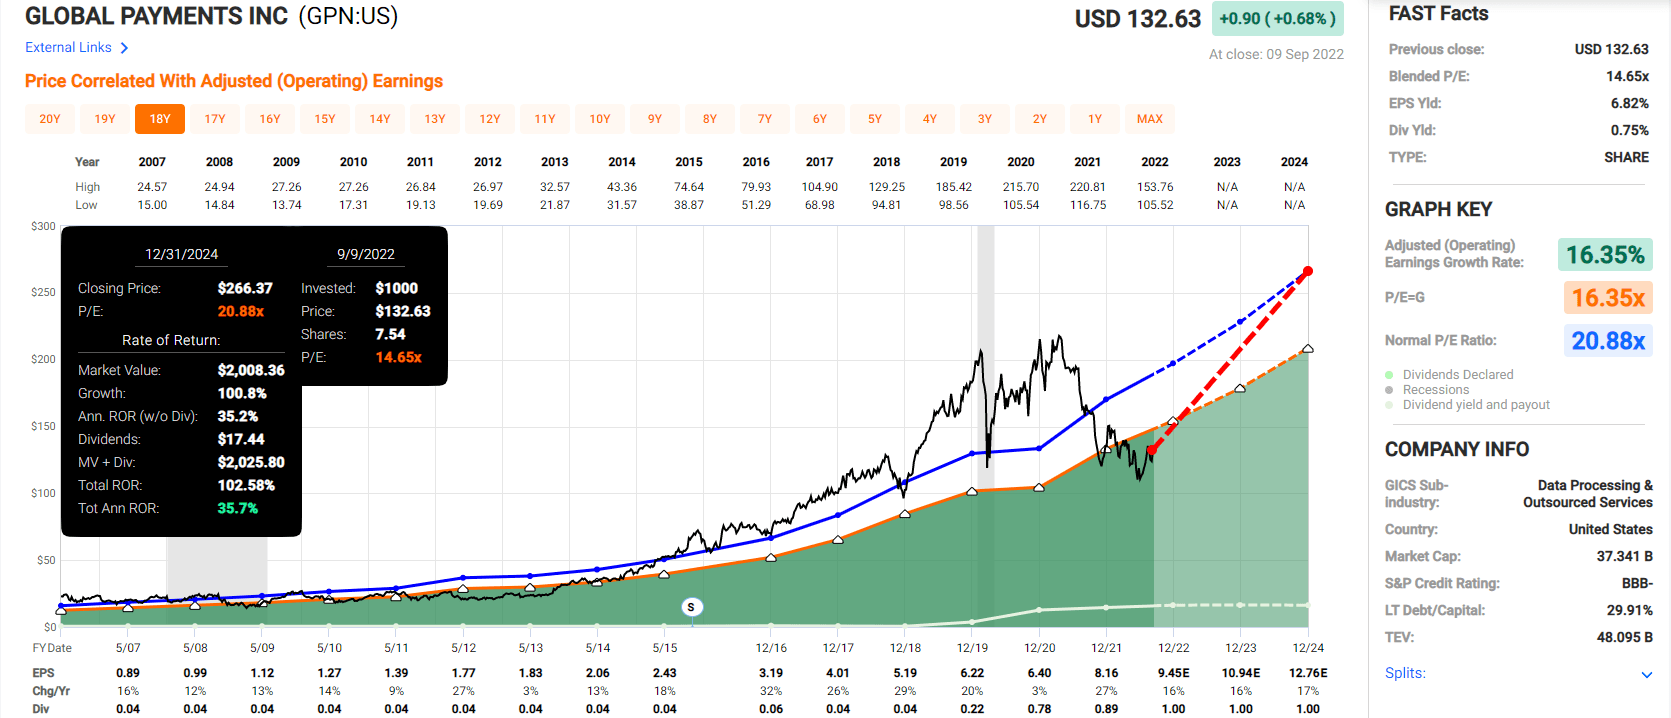
Mastercard 2024 Consensus Total Return Potential
(Source: FAST Graphs, FactSet Research)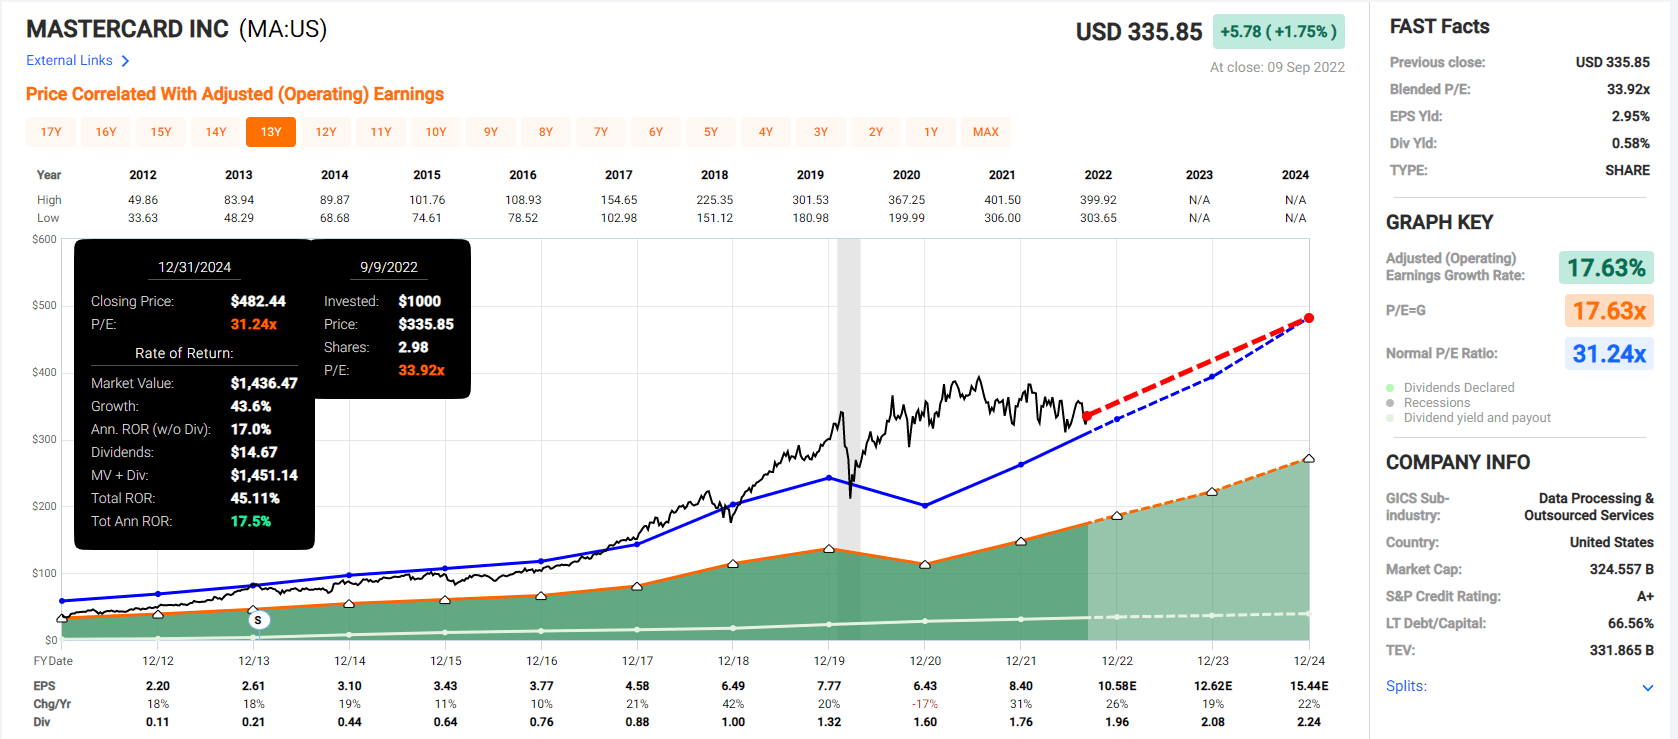
Alphabet 2024 Consensus Total Return Potential
(Source: FAST Graphs, FactSet Research)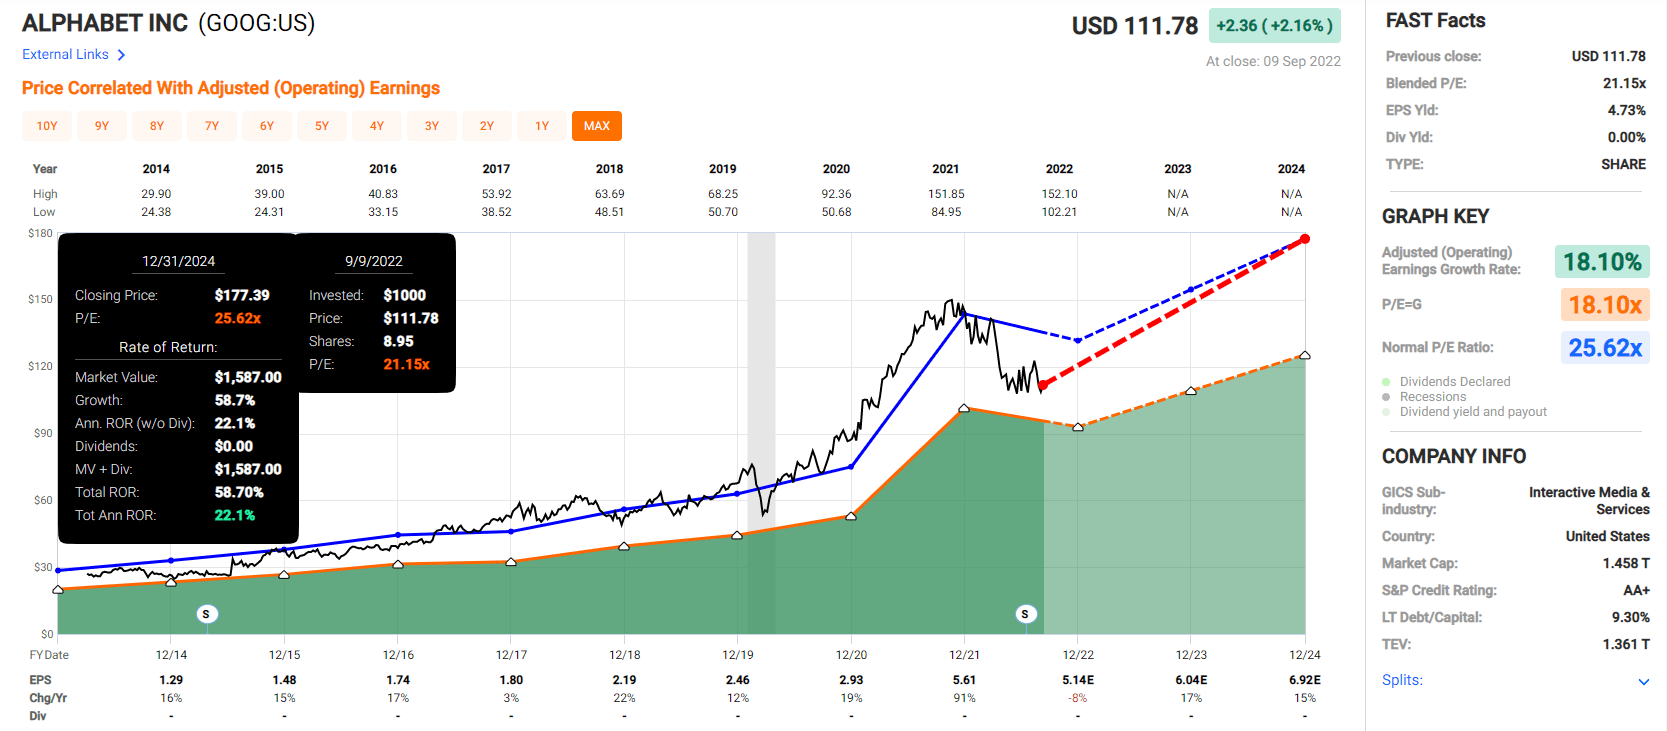
Amazon 2024 Consensus Total Return Potential
(Source: FAST Graphs, FactSet Research)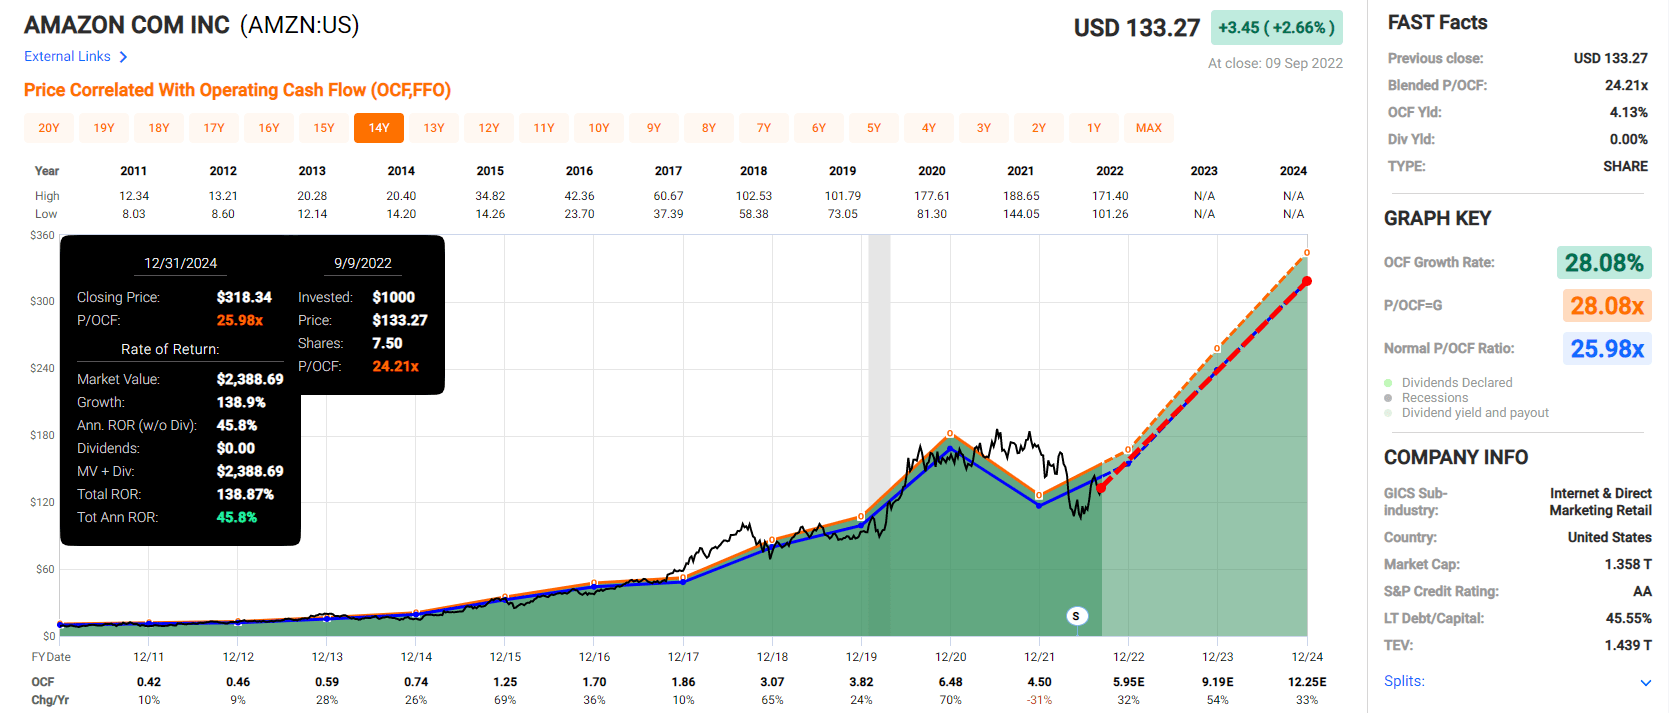
Now let’s compare them to the S&P 500.
S&P 500 2024 Consensus Total Return Potential
(Source: FAST Graphs, FactSet Research)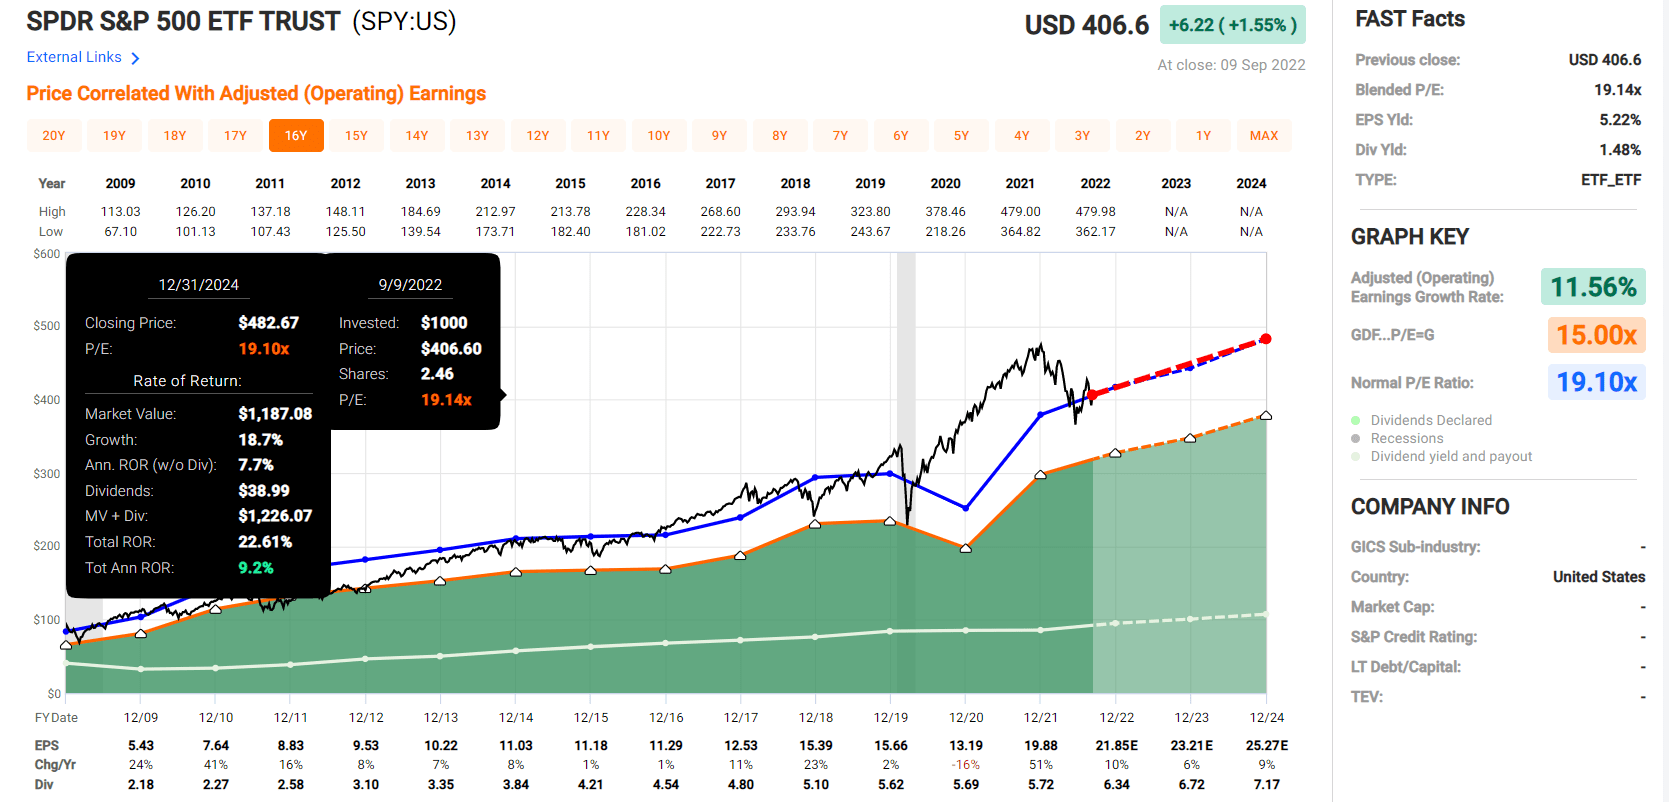
Analysts expect the S&P 500 to deliver 9% annual returns through 2024 potentially.
- 10% to 63% CAGR for these incredible Top Buy list blue-chips
- 28% CAGR on average
- an average of 87% consensus total return potential through 2024
- 4X more than the S&P 500
But I’m not here to help you score a quick double. Dividend Kings is about changing your life.
Fortunes are made by buying right and holding on.” – Tom Phelps
Why We Trust These Blue-Chips And So Can You
(Source: Dividend Kings Zen Research Terminal) (Source: Dividend Kings Zen Research Terminal)
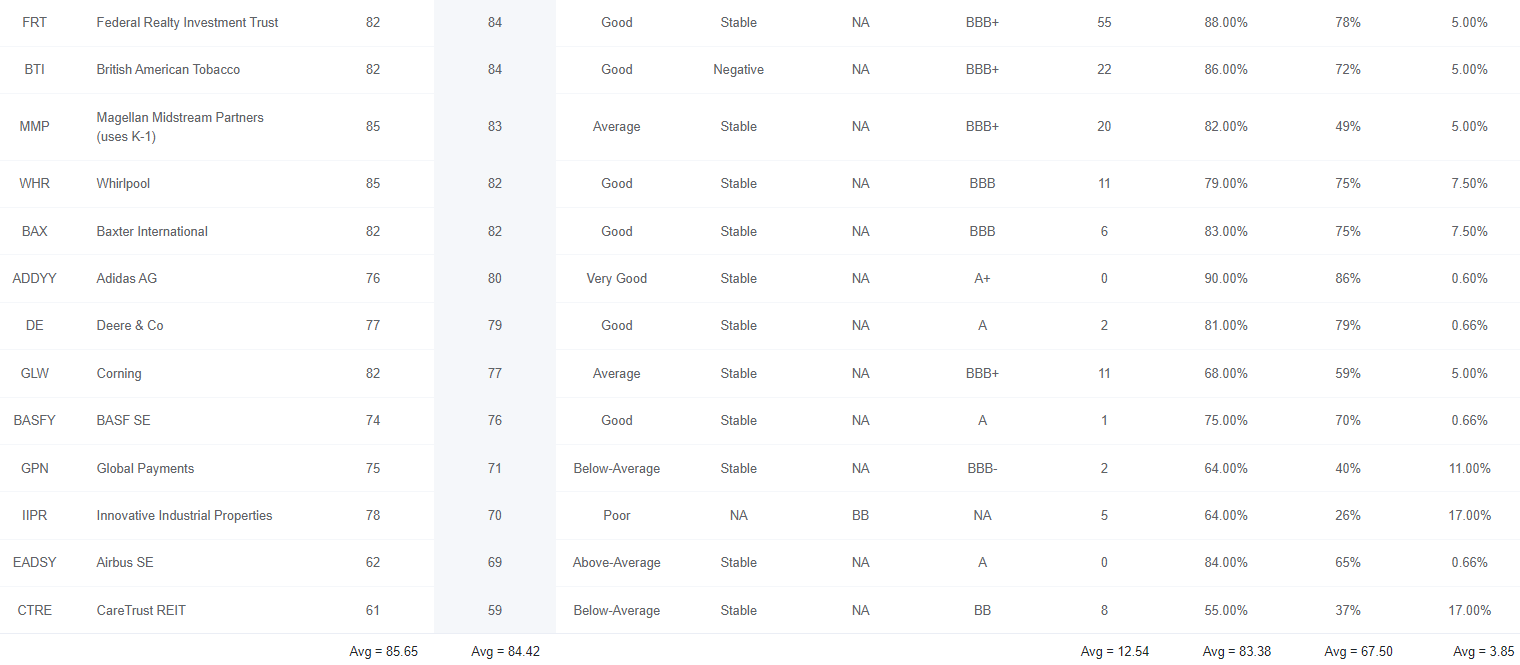
These aren’t just blue-chips; collectively, they are 12/13 Super SWAN quality companies, some of the most reliable companies on earth. How do we know? Let’s compare them to the bluest of blue-chips, the dividend aristocrats.
Compared To The Dividend Aristocrats
| Metric | Dividend Aristocrats | DK Top Buy List |
Compared To Aristocrats |
| Quality | 87% | 84% | 97% |
| Safety | 90% | 86% | 96% |
| Average Recession Dividend Cut Risk | 0.5% | 0.5% | 100% |
| Severe Recession Dividend Cut Risk | 1.5% | 1.7% | 113% |
| Dependability | 84% | 83% | 99% |
| Dividend Growth Streak (Years) | 44.8 | 12.5 | 28% |
| Long-Term Risk Management Industry Percentile | 67% Above-Average, Low Risk | 68% Above-Average, Low Risk | 101% |
| Average Credit Rating | A- Stable | BBB+ Stable | NA |
| Average Bankruptcy Risk | 3.04% | 3.85% | 127% |
| Average Return On Capital | 105% | 95% | 90% |
| Average ROC Industry Percentile | 83% | 78% | 94% |
| 13-Year Median ROC | 89% | 95% | 107% |
| Forward PE | 20.4 | 14.7 | 74% |
| Discount To Fair Value | 0% | 31% | 7250% |
| DK Rating | Reasonable Buy | Very Strong Buy | NA |
| Yield | 2.4% | 3.4% | 136% |
| LT Growth Consensus | 8.7% | 13.0% | 150% |
| Total Return Potential | 11.1% | 16.4% | 147% |
| Risk-Adjusted Expected Return | 7.5% | 11.0% | 144% |
| Inflation & Risk-Adjusted Expected Return | 5.3% | 8.7% | 162% |
| Conservative Years To Double | 13.4 | 8.2 | 62% |
| Average | 483% |
(Source: Dividend Kings Zen Research Terminal)
These Top 26 blue chips compare very favorably to the dividend aristocrats on safety and quality, and blow them out of the water on valuation.
The average dividend cut risk in a historically average recession since WWII is 0.5%, the same as the aristocrats.
In a severe recession, like the Great Financial Crisis or Pandemic, it’s 1.7%, basically matching the aristocrats.
The average dividend growth streak is 13 years, which while not as impressive as the aristocrat 45 years, is still very good.
Pandemic Dividend Cuts by Dividend Growth Streak
Justin Law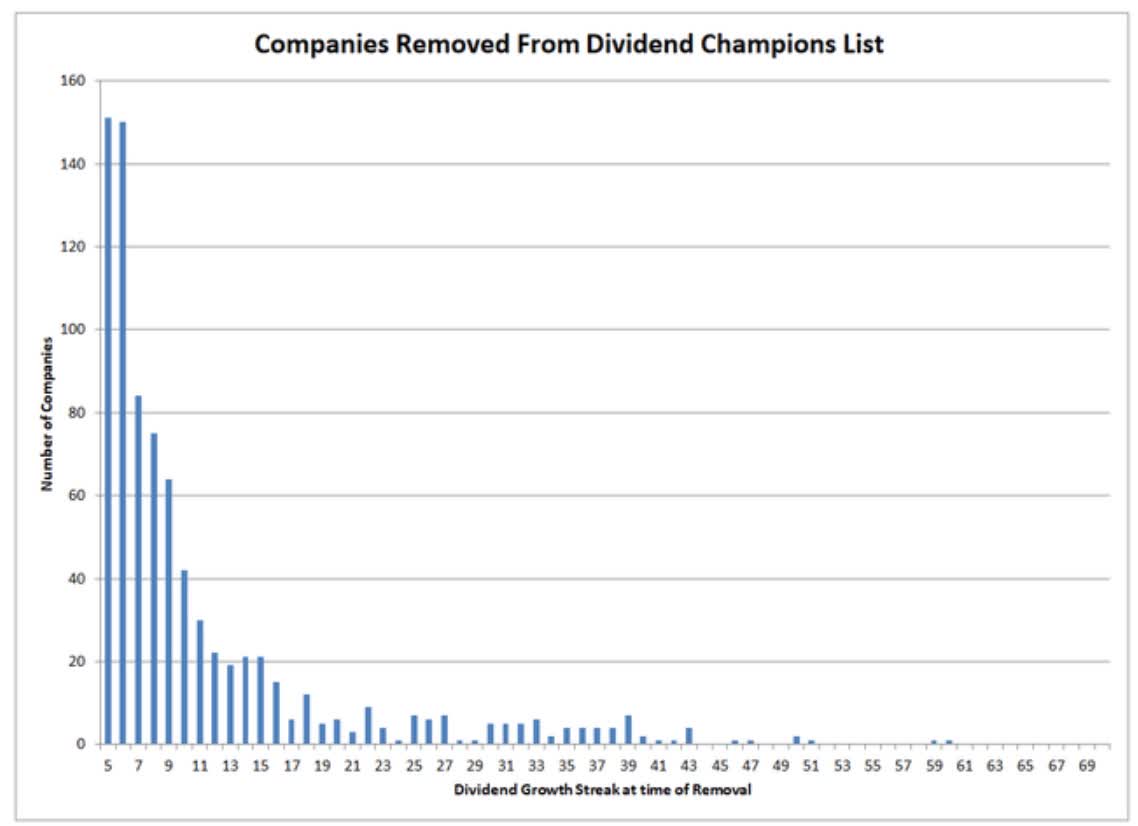
During the Pandemic, companies with a 12-plus year dividend growth streak were significantly less likely to cut their dividends.
S&P estimates their average 30-year bankruptcy risk at 3.85%, similar to the aristocrats 3.05%.
- average BBB+ stable credit rating
Now let’s consider return on capital or ROC. This is Joel Greenblatt’s gold standard proxy for quality and moatiness.
- annual pre-tax profit/the cost of running the business
- S&P 500’s ROC in 2021 was 14.6%
The aristocrats have 105% ROC, and these 26 life-changing Super SWANs 95%.
- 6.5X better than the S&P 500
Their ROC industry percentile is 78%, meaning their profitability and quality is in the top 22% of their peers.
Their 13-year median ROC is 95%, higher than the aristocrats’ 89%, and confirming these are wide and stable moat Super SWANs.
And finally, according to seven risk-rating agencies, their average long-term risk management ratings are in the 68th industry percentile, slightly better than the dividend aristocrats.
- these seven rating agencies consider over 1000 fundamental risks
- everything from the balance sheet to maintaining competitive advantages over time, to supply chain management, labor relations, and climate change
Long-Term Risk Management Is The 195th Best In The Master List (61st Percentile)
| Classification | Average Consensus LT Risk-Management Industry Percentile |
Risk-Management Rating |
| S&P Global (SPGI) #1 Risk Management In The Master List | 94 | Exceptional |
| Federal Realty Investment Trust | 78 |
Good – Bordering On Very Good |
| Strong ESG Stocks | 78 |
Good – Bordering On Very Good |
| Foreign Dividend Stocks | 75 | Good |
| Ultra SWANs | 71 | Good |
| 26 Life-Changing Super SWANs | 68 | Above-Average, bordering on good |
| Low Volatility Stocks | 68 | Above-Average |
| Dividend Aristocrats | 67 | Above-Average |
| Dividend Kings | 63 | Above-Average |
| Master List average | 62 | Above-Average |
| Hyper-Growth stocks | 61 | Above-Average |
| Monthly Dividend Stocks | 60 | Above-Average |
| Dividend Champions | 57 | Average bordering on above-average |
(Source: DK Research Terminal)
These blue chips’ risk-management consensus is in the top 39% of the world’s highest quality companies and similar to that of such other blue-chips as
- Hormel Foods (HRL): Ultra SWAN dividend king
- Abbott Labs (ABT): Ultra SWAN dividend king
- Philip Morris International (PM): Super SWAN dividend king
- Stanley Black & Decker (SWK): Super SWAN dividend king
- Kimberly-Clark (KMB): Ultra SWAN dividend king
The bottom line is that all companies have risks, and these 26 Super SWANs are above-average, bordering on good, at managing theirs.
How We Monitor These Blue-Chip’s Risk Profile
- 647 analysts (18% of all analysts on Wall Street)
- 4 credit rating agencies
- 7 total risk rating agencies
- 24 experts who collectively know this business better than anyone other than management
- and the bond market for real-time fundamental risk-assessment
When the facts change, I change my mind. What do you do, sir?” – John Maynard Keynes
There are no sacred cows at iREIT or Dividend Kings. Wherever the fundamentals lead, we always follow. That’s the essence of disciplined financial science, the math behind retiring rich and staying rich in retirement.
OK, so now that you know why we are so fond of these 26 Super SWANs, here is why you should consider buying some today.
World-Beater Blue-Chips At Wonderful Prices
(Source: Dividend Kings Zen Research Terminal) (Source: Dividend Kings Zen Research Terminal)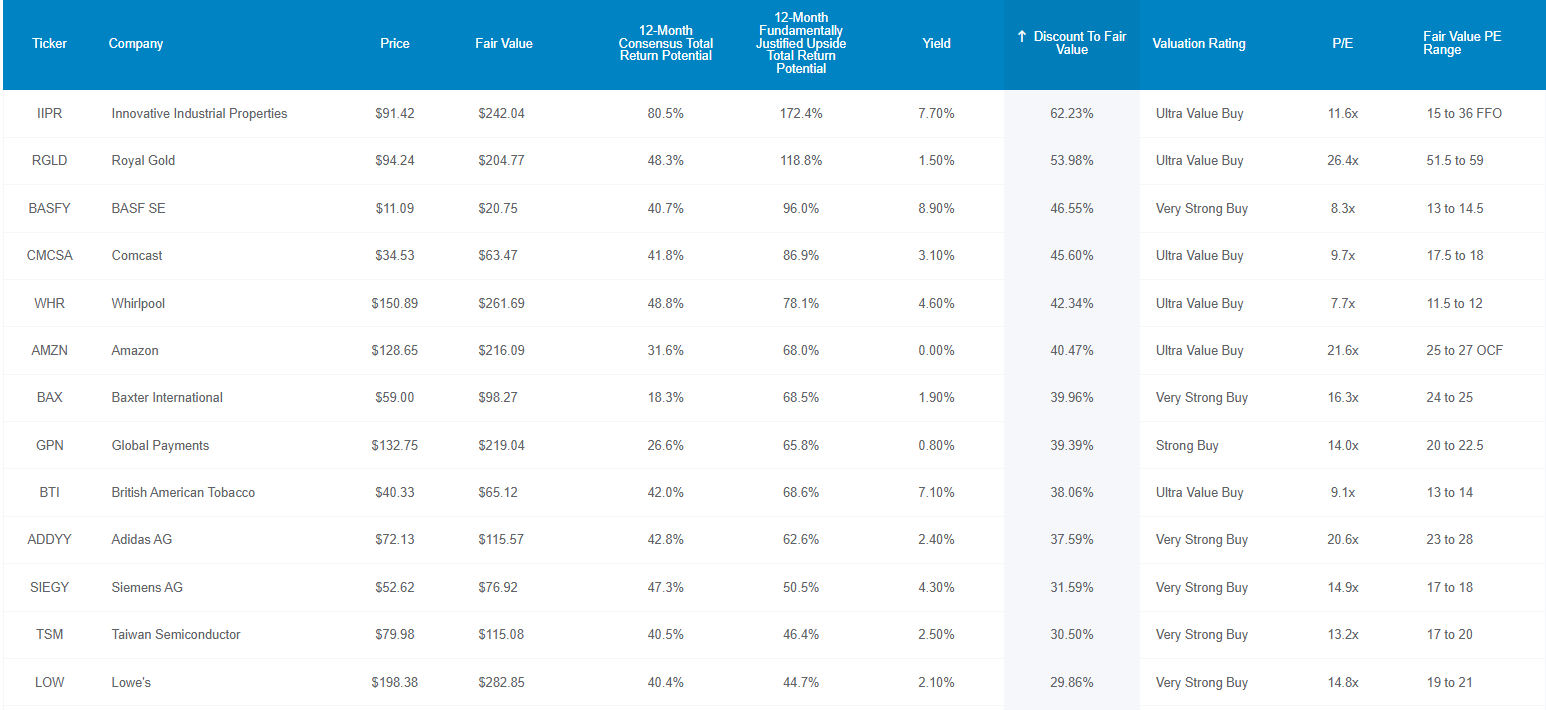
For context, the S&P is trading at 17X forward earnings, basically historical fair value. So are the dividend aristocrats.
These 26 world-beater blue-chips are trading at 14.7X earnings or cash flow, and trading at a 31% discount to fair value.
That’s why analysts expect 35% total returns from these Super SWANs in the next 12 months.
Their 12-month fundamentally justified total return? 54%.
- if all the companies grow as expected and return to historical market-determined fair value you’ll earn 54% in a year
But my goal isn’t to help you earn 35% in a year, or even 54%, though that’s certainly possible with these incredible blue-chips.
My goal is to help you life-changing wealth and income so you can retire in safety and splendor.
Total Return Fundamentals That Can Help You Retire In Safety And Splendor
(Source: Dividend Kings Zen Research Terminal) (Source: Dividend Kings Zen Research Terminal)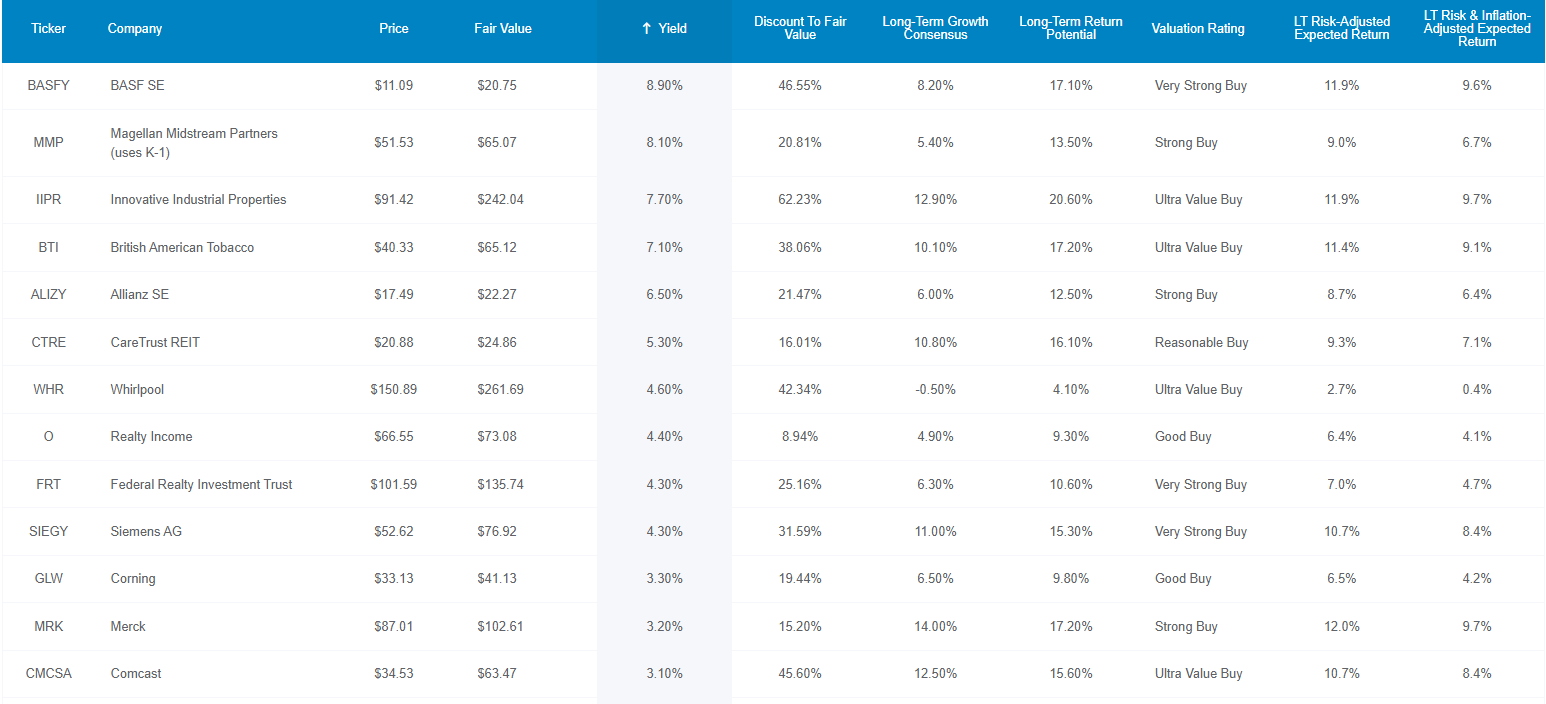
These 26 life-changing Super SWANs yield not just a very safe 3.5%, but analysts expect them to grow at 13% over time, delivering potentially 16.5% CAGR total returns. That’s on par with the greatest investors in history.
| Investment Strategy | Yield | LT Consensus Growth | LT Consensus Total Return Potential | Long-Term Risk-Adjusted Expected Return | Long-Term Inflation And Risk-Adjusted Expected Returns | Years To Double Your Inflation & Risk-Adjusted Wealth |
10-Year Inflation And Risk-Adjusted Expected Return |
| DK Top Buy List | 3.5% | 13.0% | 16.5% | 11.6% | 9.3% | 7.8 | 2.42 |
| Dividend Aristocrats | 2.4% | 8.6% | 11.0% | 7.7% | 5.4% | 13.4 | 1.69 |
| S&P 500 | 1.7% | 8.5% | 10.2% | 7.1% | 4.9% | 14.8 | 1.61 |
| Nasdaq | 0.9% | 11.8% | 12.7% | 8.9% | 6.6% | 10.9 | 1.89 |
(Source: DK Research Terminal, Morningstar, FactSet, Ycharts)
That’s not just more than the dividend aristocrats and S&P 500; it’s far more than analysts expect from the Nasdaq in the future.
Inflation-Adjusted Consensus Return Potential: $1,000 Initial Investment
| Time Frame (Years) | 7.9% CAGR Inflation-Adjusted S&P 500 Consensus | 8.7% Inflation-Adjusted Dividend Aristocrats Consensus | 14.2% CAGR Inflation-Adjusted DK Top Buy List Consensus | Difference Between Inflation-Adjusted DK Top Buy List Consensus And S&P Consensus |
| 5 | $1,461.18 | $1,516.17 | $1,943.21 | $482.03 |
| 10 | $2,135.06 | $2,298.77 | $3,776.08 | $1,641.02 |
| 15 | $3,119.71 | $3,485.33 | $7,337.73 | $4,218.03 |
| 20 | $4,558.47 | $5,284.36 | $14,258.79 | $9,700.32 |
| 25 | $6,660.75 | $8,012.00 | $27,707.88 | $21,047.12 |
| 30 | $9,732.58 | $12,147.56 | $53,842.34 | $44,109.76 |
(Source: DK Research Terminal, FactSet)
Over a standard retirement time frame of 30 years, analysts think the DK Top Buy list could deliver up to 54X real returns.
| Time Frame (Years) | Ratio Dividend Aristocrats/S&P Consensus | Ratio Inflation And Inflation-Adjusted DK Top Buy List Consensus vs. S&P consensus |
| 5 | 1.04 | 1.33 |
| 10 | 1.08 | 1.77 |
| 15 | 1.12 | 2.35 |
| 20 | 1.16 | 3.13 |
| 25 | 1.20 | 4.16 |
| 30 | 1.25 | 5.53 |
(Source: DK Research Terminal, FactSet)
That’s potentially 5.5X the S&P 500 and 4.4X more than the dividend aristocrats.
Life-changing yield, quality, and return potential? All at a 31% discount and a sub 15 PE? Now we’re cooking with gas.
But what evidence is there that these 26 blue-chips can deliver anything close to 17% long-term returns over time?
Historical Returns Since February 2007 (Equal Weighting, Annual Rebalancing)
The future doesn’t repeat, but it often rhymes. – Mark Twain
In our case, “past performance is no guarantee of future results.”
Still, studies show that over time, blue chips with relatively stable fundamentals offer predictable returns based on yield, growth, and valuation mean reversion.
Bank of America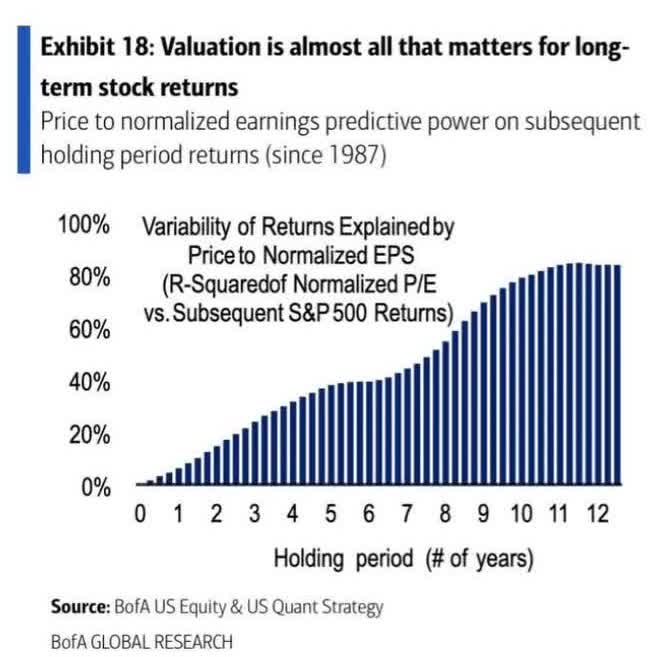
So let’s take at how the DK Top Buy List has performed over the last 15 years when 91% of total returns were the result of fundamentals and not luck.
(Source: Portfolio Visualizer Premium)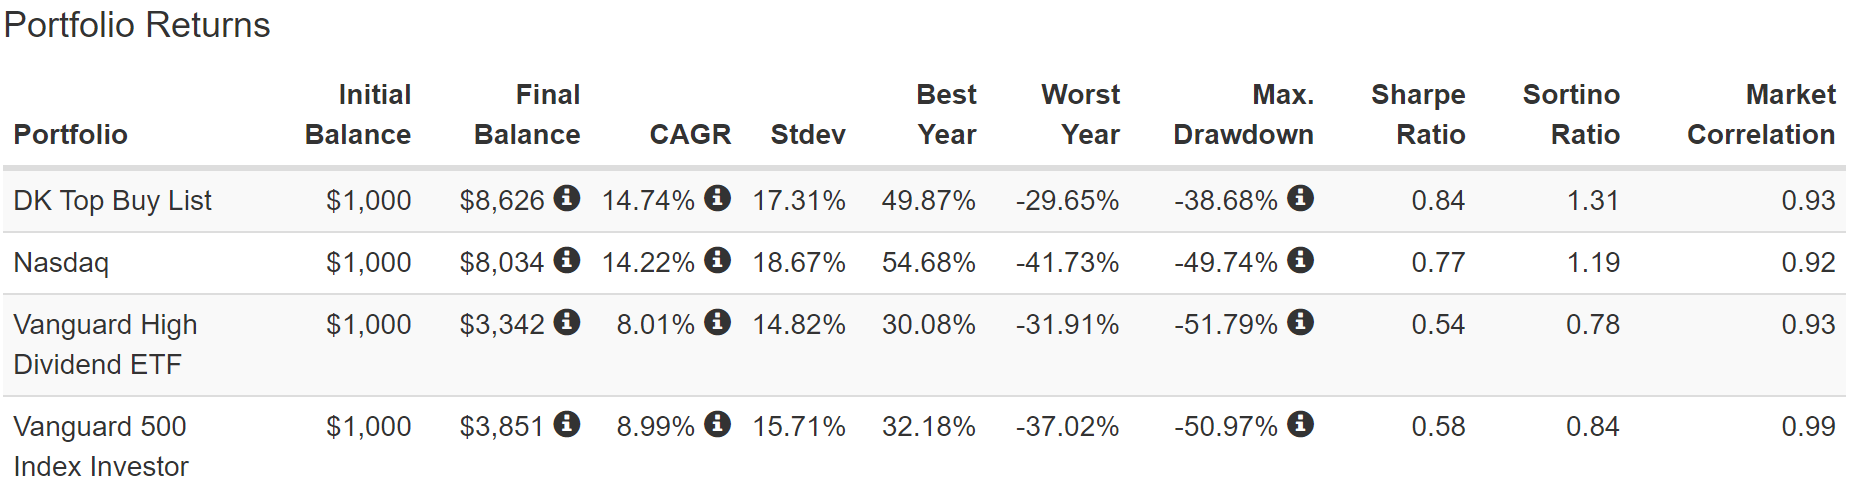
15% annual returns, including the current bear market. Beating the S&P? Check. Beating the Nasdaq? By a bit, but yes.
(Source: Portfolio Visualizer Premium)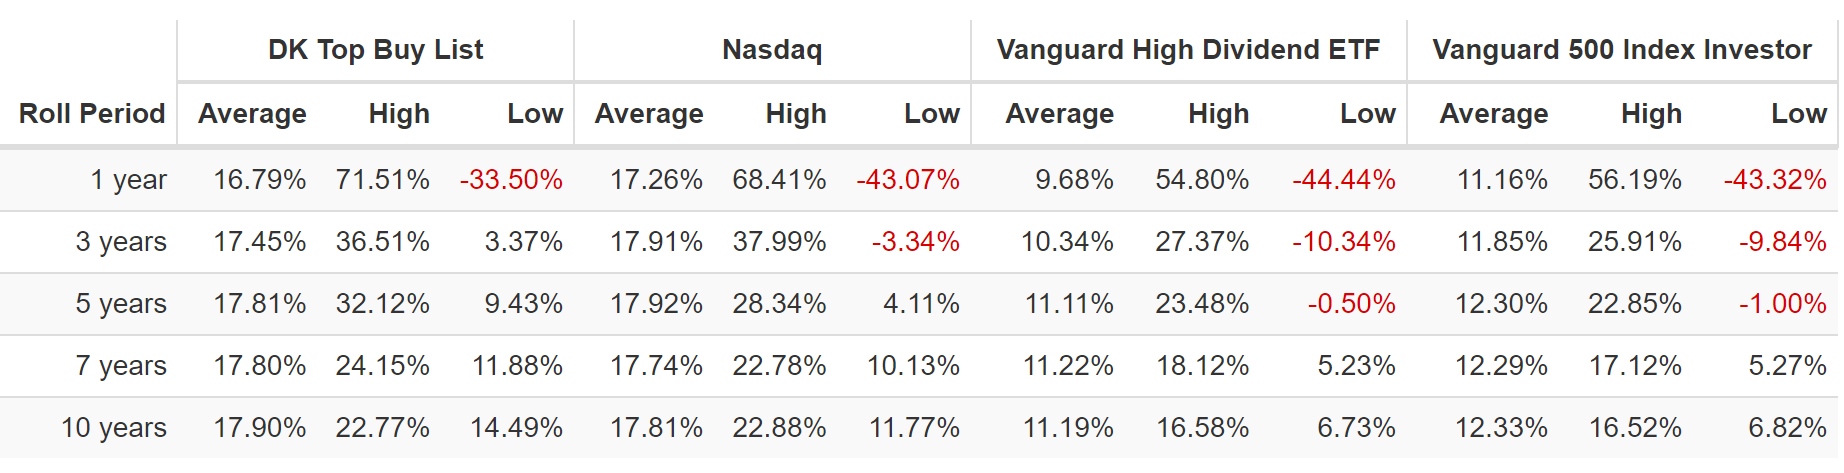
The average 12-month return over the last 15 years? 17% CAGR, and the average 10-year rolling return? 18% CAGR.
Why are we confident in these blue chips’ ability to deliver approximately 17% annual returns in the future? Because these world-beaters have been doing it for the last 15 years.
All while running circles around the S&P 500 and Vanguard’s High Dividend ETF (VYM), one of the world’s best high-yield ETFs.
- 3.5% yield Vs. 3.1% VYM is yielding
- higher yield, better returns, and smaller decline in the Great Recession
But wait, our it gets better.
Dividends History Since 2008: $1,000 Initial Investment
(Source: Portfolio Visualizer)
Want safe dividends that grow in all economic and market conditions? The DK Top Buy list delivers just that.
- not a single year of falling annual dividends
- not even in the Great Recession when the S&P cut its dividend 25%
Cumulative Dividends Since 2008: $1,000 Initial Investment
| Metric | S&P 500 | Nasdaq | Vanguard High Dividend ETF |
DK Top Buy List |
| Total Dividends | $506 | $398 | $824 | $1,735 |
| Total Inflation-Adjusted Dividends | $361.43 | $284.29 | $588.57 | $1,239.29 |
| Annualized Income Growth Rate | 7.7% | 22.3% | 8.6% | 20.2% |
| Total Income/Initial Investment | 0.51 | 0.40 | 0.82 | 1.74 |
| Inflation-Adjusted Income/Initial Investment | 0.36 | 0.28 | 0.59 | 1.24 |
| More Inflation-Adjusted Income Than S&P 500 | NA | 0.79 | 1.63 | 3.43 |
| Starting Yield | 1.9% | 0.3% | 2.9% | 2.8% |
| Today’s Annual Dividend Return On Your Starting Investment (Yield On Cost) | 5.4% | 5.0% | 9.2% | 36.6% |
| Today’s Inflation-Adjusted Annual Dividend Return On Your Starting Investment (Inflation-Adjusted Yield On Cost) | 3.9% | 3.6% | 6.6% | 26.1% |
(Source: Portfolio Visualizer)
What started out as a 2.8% yield in 2008 has grown into an inflation-adjusted yield on cost of 26%.
For every $1,000 invested into the DK Top Buy list, investors have gotten back $1239 in dividends growing at 20% per year, almost as fast as the Nasdaq’s 22% CAGR.
- But with 3.5X the yield of the Nasdaq
Investors in the Top Buy List have received 3.4X more inflation-adjusted income than the S&P 500.
This is the power of owning world-beating blue-chip bargains for the long-term.
Bottom Line: These 26 Incredible Bear Market Blue-Chip Bargains Could Change Your Life
The market is selling off again, creating fear, uncertainty, and doubt in the minds of many investors. That’s understandable, but do you know what else it creates?
Volatility isn’t risk, the source of future returns.” – Joshua Brown, CEO Ritholtz Wealth Management
From bear markets come the kind of returns rich retirement dreams are made of. The average 10 year return after an 18+% decline over six months is 281%, or nearly 4X.
Individual blue-chips can deliver 8X to 16X returns, especially 31% undervalued world-beater Super SWANs like these:
I can’t tell you when these potentially life-changing Super SWANs will bottom because in the short-term stock market returns are 97% luck. But in the long term, they are 97% fundamentally driven destiny.
- 3.5% very safe yield (more than VYM and most high-yield blue-chip ETFs)
- 31% discount to fair value: Very Strong Buy
- average credit rating: BBB+ stable (3.85% fundamental risk)
- 13% CAGR growth consensus
- 16.5% CAGR total return consensus return potential (just like the last 15 years of actual returns)
- 68th industry percentile long-term risk management (better than the dividend aristocrats)
- 20% CAGR 15-year income growth
If you’re looking for potentially life-changing safe high-yield and long-term returns, bear market blue-chip bargain hunting is what you need.
And these 26 Super SWANs in the DK Top Buy list are our best ideas for this month.
What about next month? And next year? Well, the companies will always change over time, but our methodical time-tested focus on safety and quality first, and prudent valuation and sound risk management always, never will.
Be the first to comment