

R&A Studio
Volatility is back with a vengeance, courtesy of the Fed recently crushing the market’s delusions of a fast pivot.
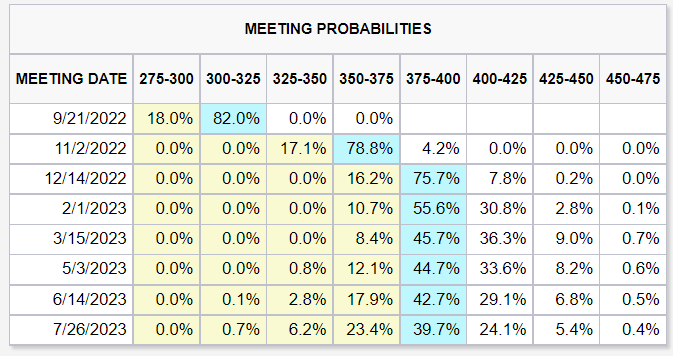
CME Group
The bond market is now pricing in an 82% chance of the Fed hiking by 0.75% on Sept. 21. It’s also pricing in a 46% chance the Fed hikes to 4%, and doesn’t cut rates through at least July 2023.
The good news is that volatility is back baby! How much volatility?
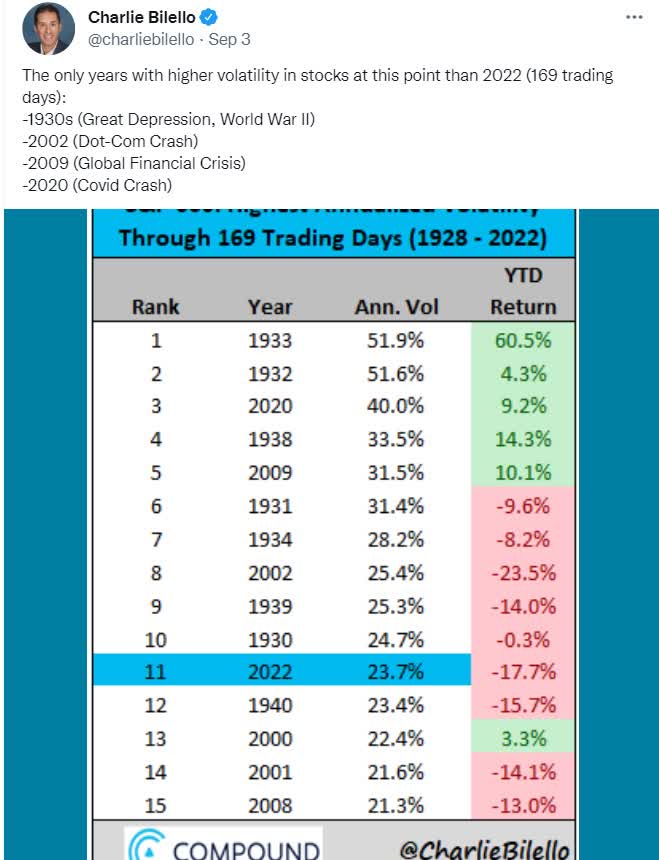
Charlie Bilello
We’re currently in the 11th most volatile market in US history, on par with such historically wonderful buying opportunities as the 1930s, the Great Recession, and the Pandemic crash.
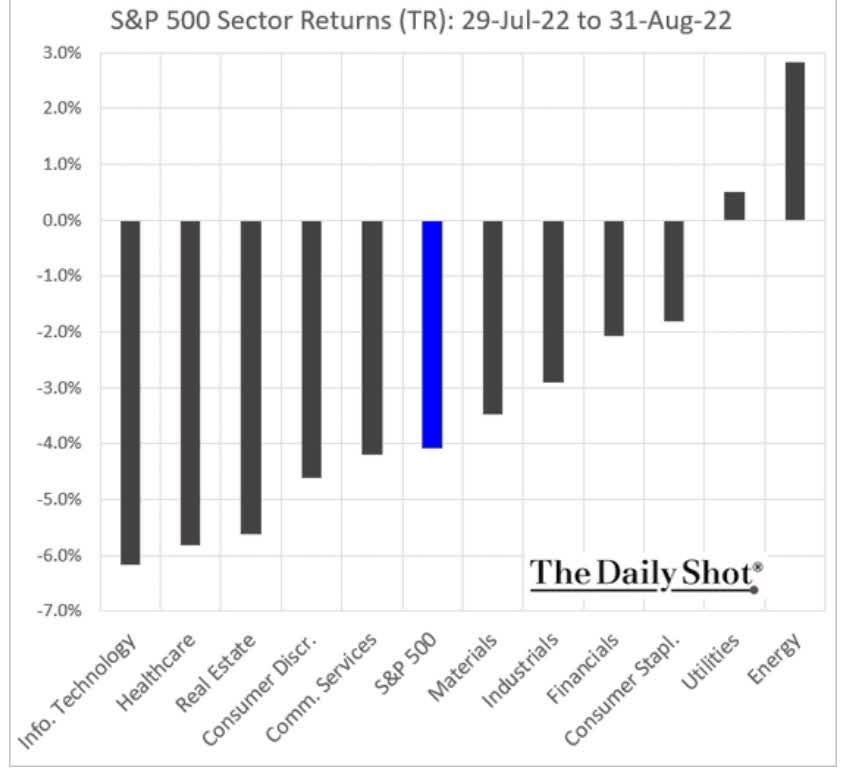
Daily Shot
The market fell by over 4% in August and is now down three consecutive weeks, potentially heading for a fourth straight weekly decline.
Why am I so excited about this? Simple. In the delusional Fed pivot rally many of the best blue chips soared above fair value.
Now? The return of volatility to the market has created a second chance of high-yield blue-chip investors to buy these wonderful companies.
Let me show you why ONEOK (OKE) and Alexandria Real Estate (ARE) are two of the bear market’s newest high-yield blue-chip buying opportunities. These are world-class dividend stocks that likely aren’t on your radar but definitely should be.
ONEOK: The Growth King Of Midstream... And No K-1 Tax Form
Further Reading
- 6.6% Yielding ONEOK Is A Retirement SWAN Midstream
- a deep dive look into OKE’s investment thesis, growth potential, risk profile, valuation, and total return profile
ONEOK Investment Thesis Summary
Oneok brings together high-quality assets, some of the strongest near- to medium-term growth prospects in our coverage as Rockies volumes continue their ongoing rebound, a C-Corporation structure, and a well-respected management team in a compelling package. About 90% of the firm’s earnings are fee-based, 80%-90% of its customers are investment-grade, and the firm hedges its limited commodity price exposure. With the reduced capital program, Oneok has material levels of excess cash flow in 2022, perhaps 18 months behind other U.S. midstream peers to buy back more stock. We estimate there could be up to $400 million in buybacks in 2022, though knowing Oneok’s penchant for finding accretive growth projects, this is also equally likely to be plowed back into attractive growth assets.” – Morningstar
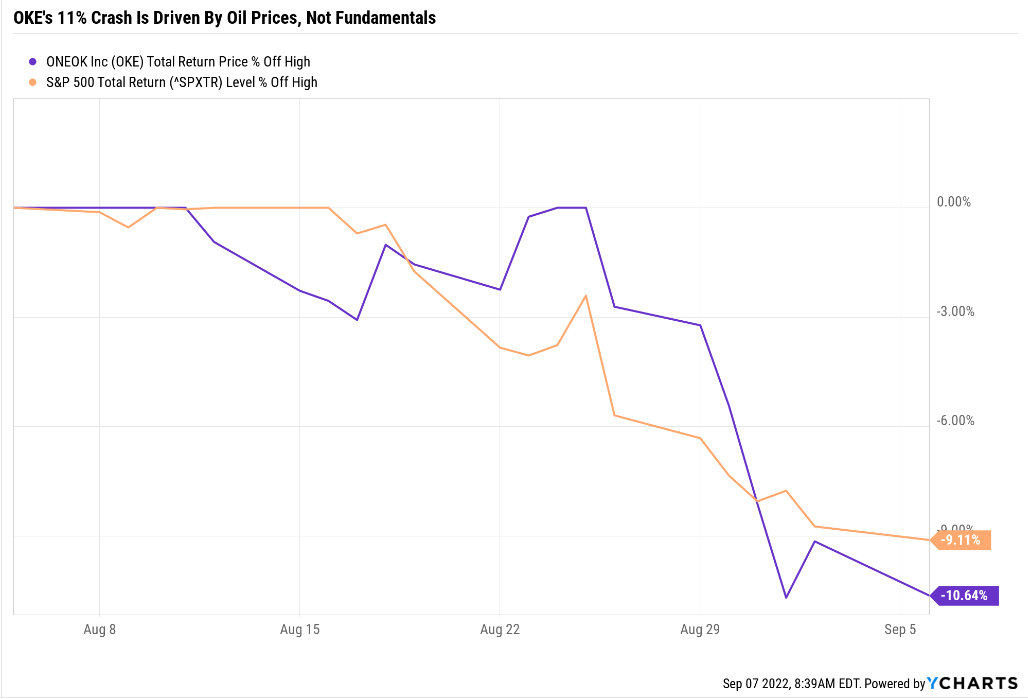
YCharts
Thanks to oil prices pulling back a bit, OKE’s price dropped 11% in a matter of weeks, but nothing about this fast-growing midstream has changed.
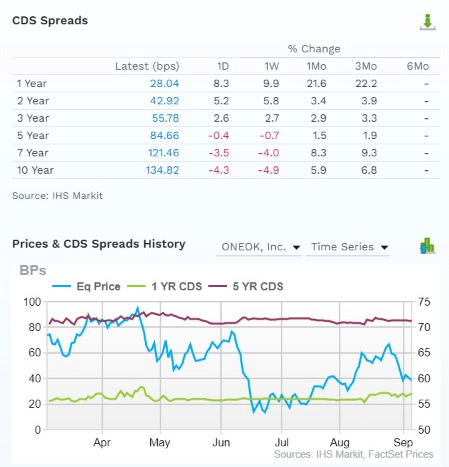
FactSet Research Terminal
The bond market is pricing in very stable default risk (fundamental risk) despite what the volatile share price might lead you to believe.
- 4.05% 30-year default risk
- consistent with BBB+ credit ratings
S&P, Fitch, and Moody’s are similarly not worried, nor are the 21 analysts covering OKE for Wall Street.
How We Monitor OKE’s Risk Profile
- 21 analysts
- 3 credit rating agencies
- 8 total risk rating agencies
- 29 experts who collectively know this business better than anyone other than management
- and the bond market for real-time fundamental risk updates
Thus, you can buy OKE with confidence to profit from an irrational 11% decline, making it a potentially reasonable buy today.
Reasons To Potentially Buy ONEOK Today
| Metric | ONEOK |
| Quality | 89% 12/13 Super SWAN (Sleep Well At Night) Midstream |
| Risk Rating | Low |
| DK Master List Quality Ranking (Out Of 500 Companies) | 92 |
| Quality Percentile | 82% |
| Dividend Growth Streak (Years) |
0 (Frozen In The Pandemic Oil Crash) |
| Dividend Yield | 6.3% |
| Dividend Safety Score | 91% Very Safe |
| Average Recession Dividend Cut Risk | 0.5% |
| Severe Recession Dividend Cut Risk | 1.7% |
| S&P Credit Rating |
BBB Stable (Investment Grade) |
| 30-Year Bankruptcy Risk | 7.50% |
| Consensus LT Risk-Management Industry Percentile | 73% Good |
| Fair Value | $64.97 |
| Current Price | $59.56 |
| Discount To Fair Value | 8% |
| DK Rating |
Potentially Reasonable Buy |
| P/Cash Flow | 9.7 |
| Growth Priced In | 0.60% |
| Historical PE Range | 8 to 10 |
| LT Growth Consensus/Management Guidance | 8.0% |
| 5-year consensus total return potential |
8% to 18% CAGR |
| Base Case 5-year consensus return potential |
12% CAGR (1.33X S&P 500) |
| Consensus 12-month total return forecast | 23% |
| Fundamentally Justified 12-Month Return Potential | 13% |
| LT Consensus Total Return Potential | 14.3% |
| Inflation-Adjusted Consensus LT Return Potential | 12.1% |
| Consensus 10-Year Inflation-Adjusted Total Return Potential (Ignoring Valuation) | 3.13 |
| LT Risk-Adjusted Expected Return | 9.26% |
| LT Risk-And Inflation-Adjusted Return Potential | 7.04% |
| Conservative Years To Double | 10.23 |
(Source: Dividend Kings Zen Research Terminal)
ONEOK 2024 Consensus Total Return Potential
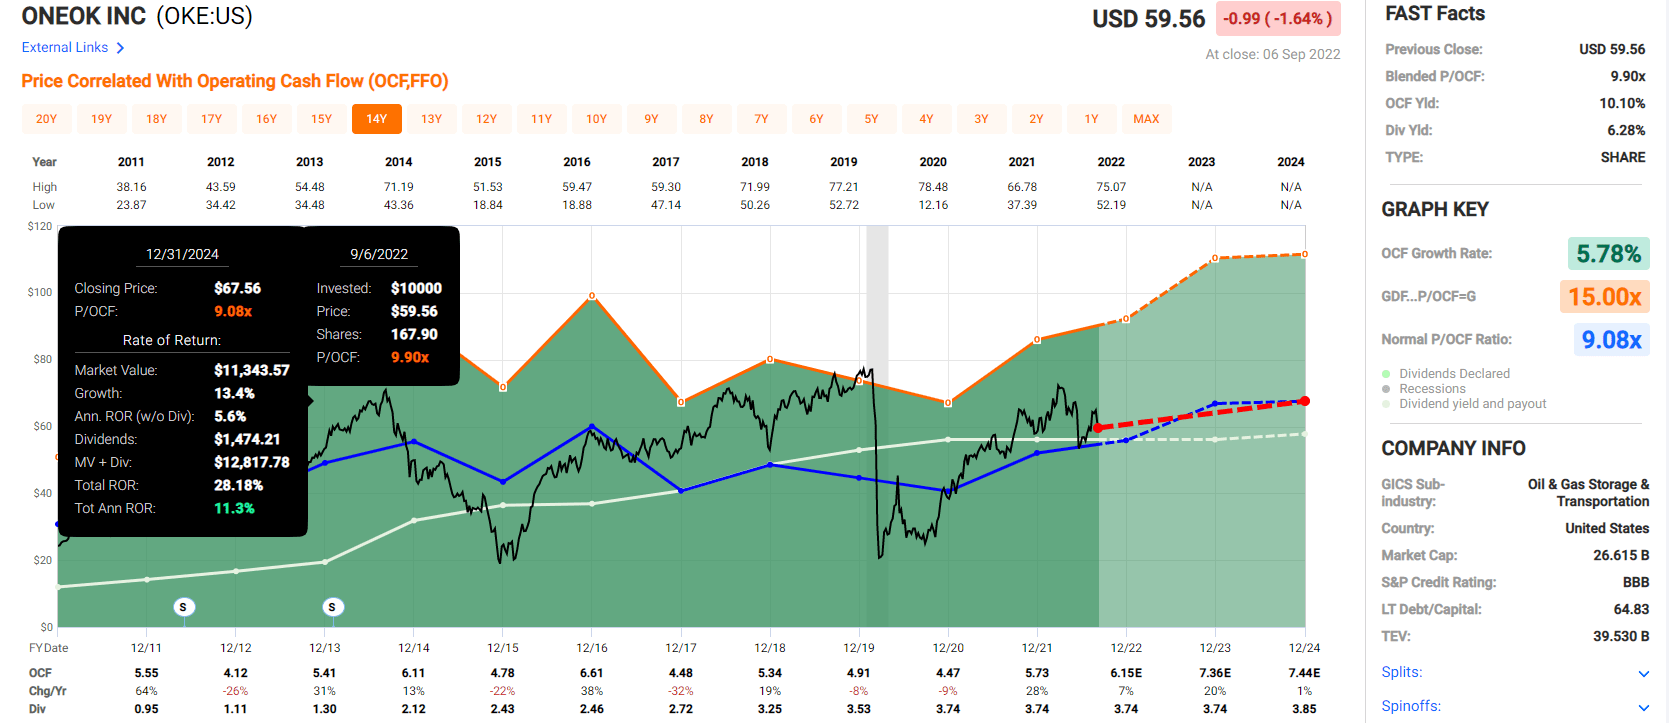
(Source: FAST Graphs, FactSet)
ONEOK 2027 Consensus Total Return Potential
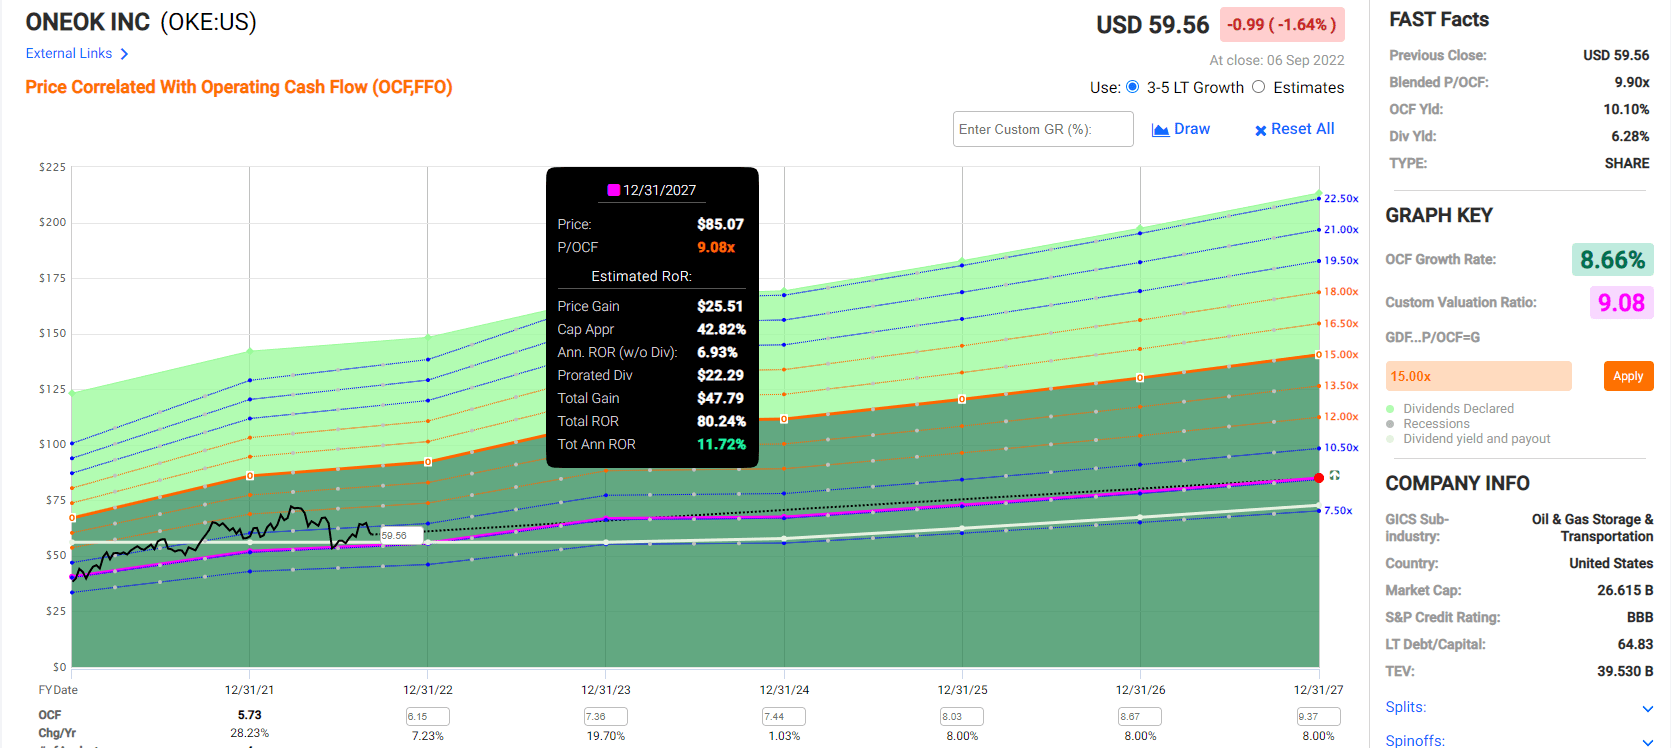
(Source: FAST Graphs, FactSet)
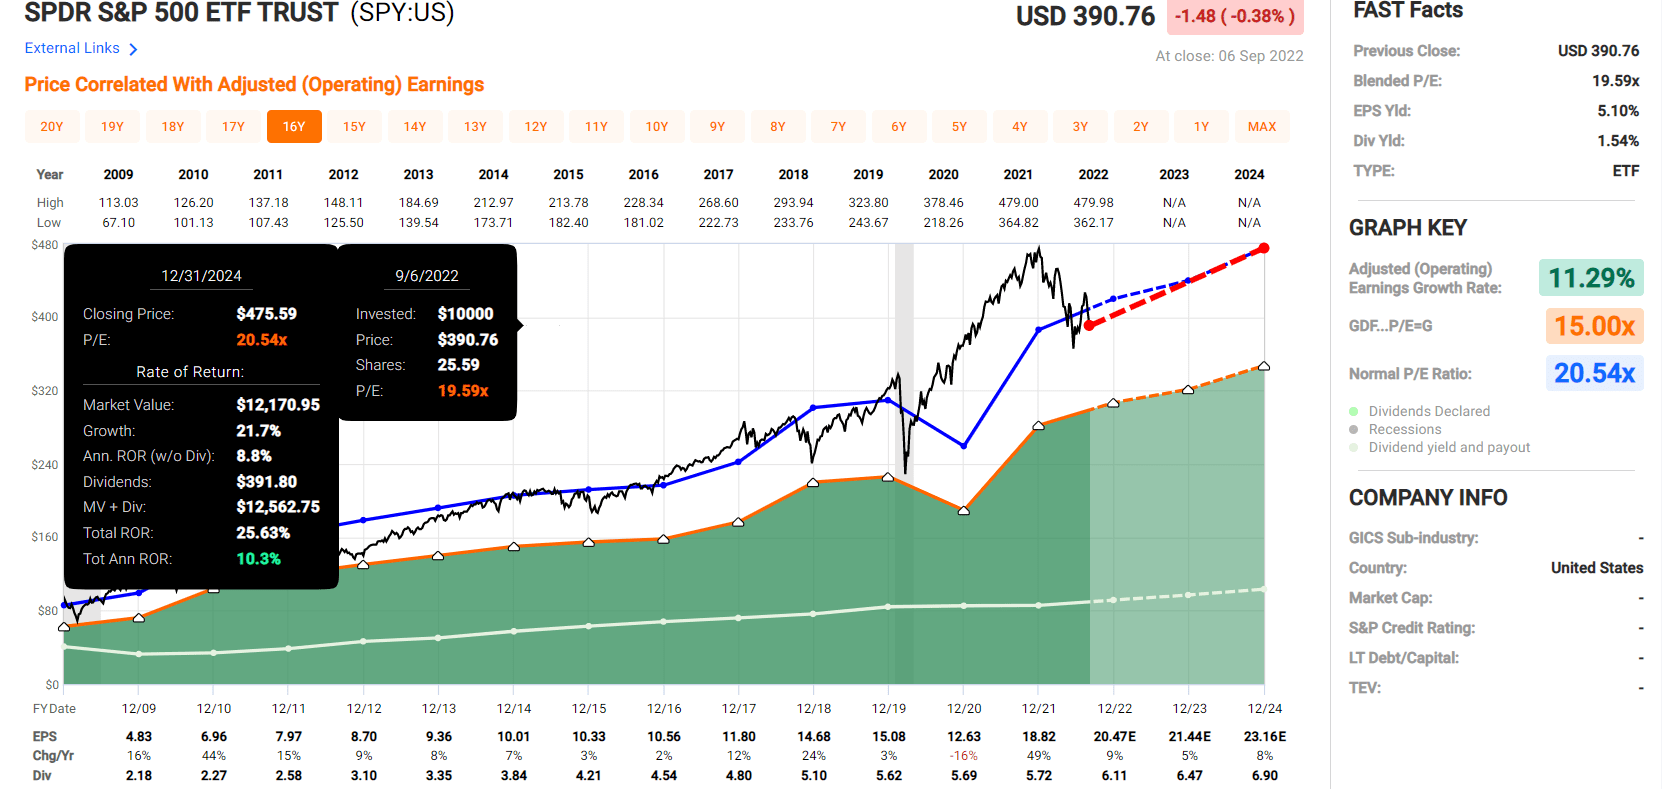
OKE is expected to deliver about 12% annual returns over the next three and five years. All while paying a very generous and safe 6.2% yield that’s 4X more than the S&P 500.
S&P 500 2024 Consensus Total Return Potential
(Source: FAST Graphs, FactSet)
S&P 500 2027 Consensus Total Return Potential
| Year | Upside Potential By End of That Year | Consensus CAGR Return Potential By End of That Year | Probability-Weighted Return (Annualized) |
Inflation And Risk-Adjusted Expected Returns |
| 2027 | 54.24% | 9.05% | 6.79% | 4.34% |
(Source: DK S&P 500 Valuation & Total Return Tool)
Over the next five years, analysts expect 9% annual returns from the S&P 500, less than what investors can potentially get from OKE while enjoying a very safe 6.2% yield on day one.
OKE Investment Decision Score
DK
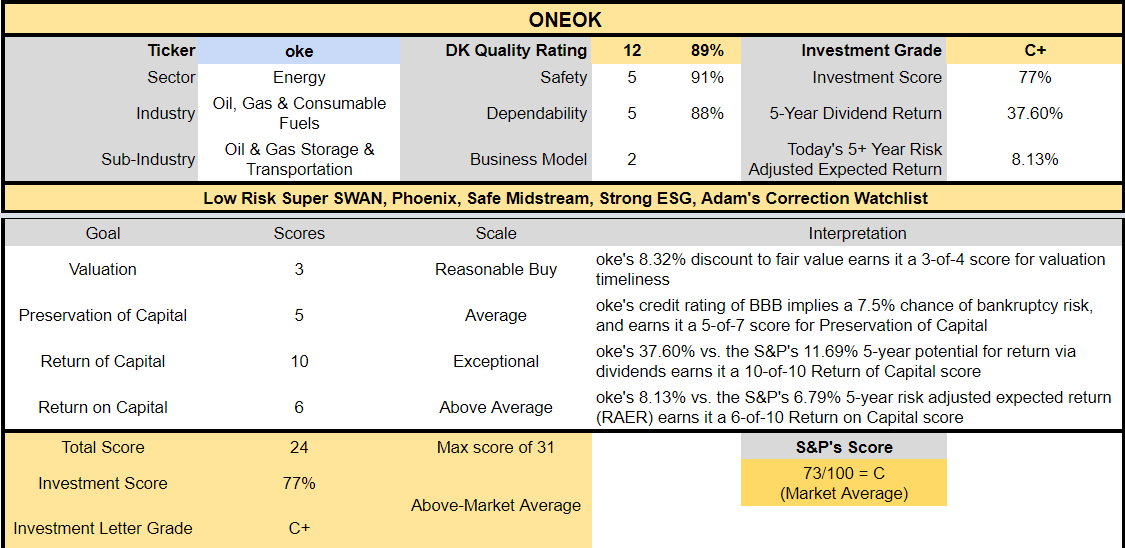
(Source: Dividend Kings Automated Investment Decision Tool)
OKE is a reasonable buy, making it a potentially superior option to the broader market.
- 8% discount vs. 2% market discount = 6% better valuation
- 6.2% yield vs. 1.7% yield (3.6X the yield and a much safer yield at that)
- 40% better consensus long-term return potential
- 33% better risk-adjusted expected return over the next five years
- over 3X more income over the next five years
If you’re looking to profit from the recent market correction, OKE is a great high-yield choice, one that could deliver Nasdaq beating 14.2% long-term returns.
Think I’m crazy? A pipeline stock beating the mighty Nasdaq? Well, that’s what happens when you combine 6.2% yield with 8% long-term growth.
Total Returns Since April 1999
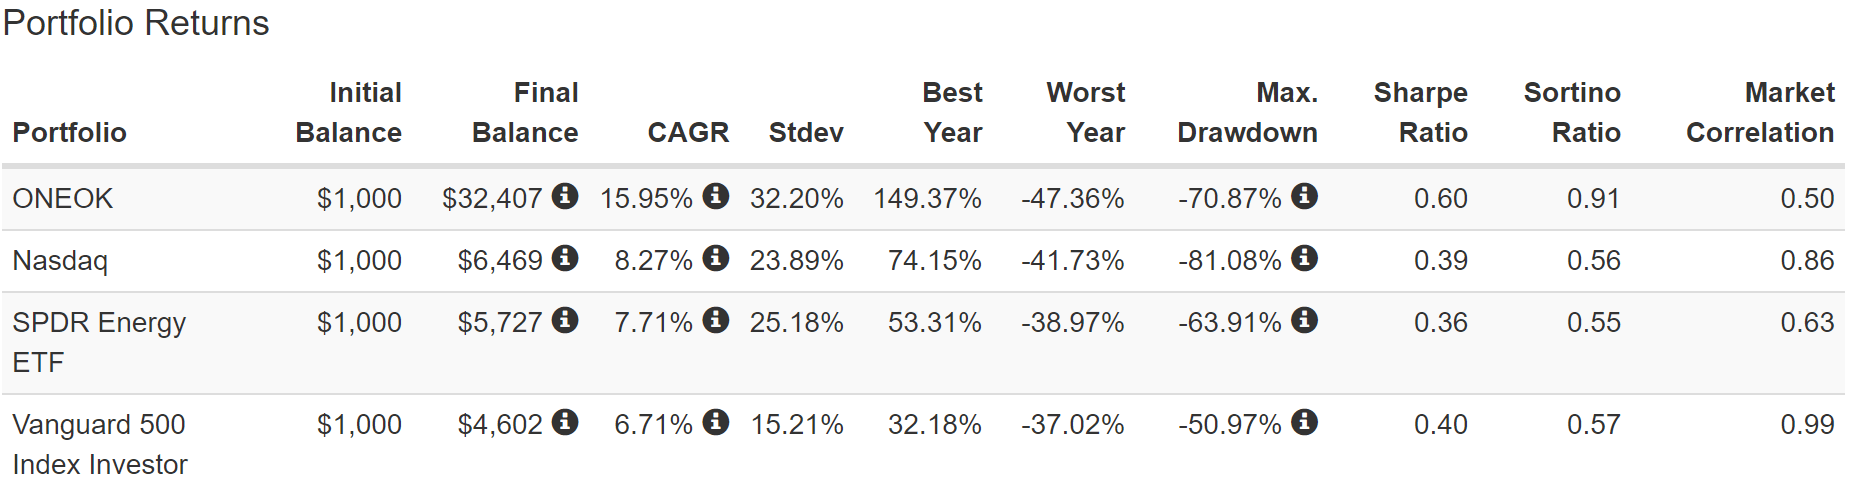
(Source: Portfolio Visualizer Premium)
During the last 23 years, OKE has run circles around the S&P, energy sector, and the Nasdaq. Think I’m cherry-picking time frames?
(Source: Portfolio Visualizer Premium)
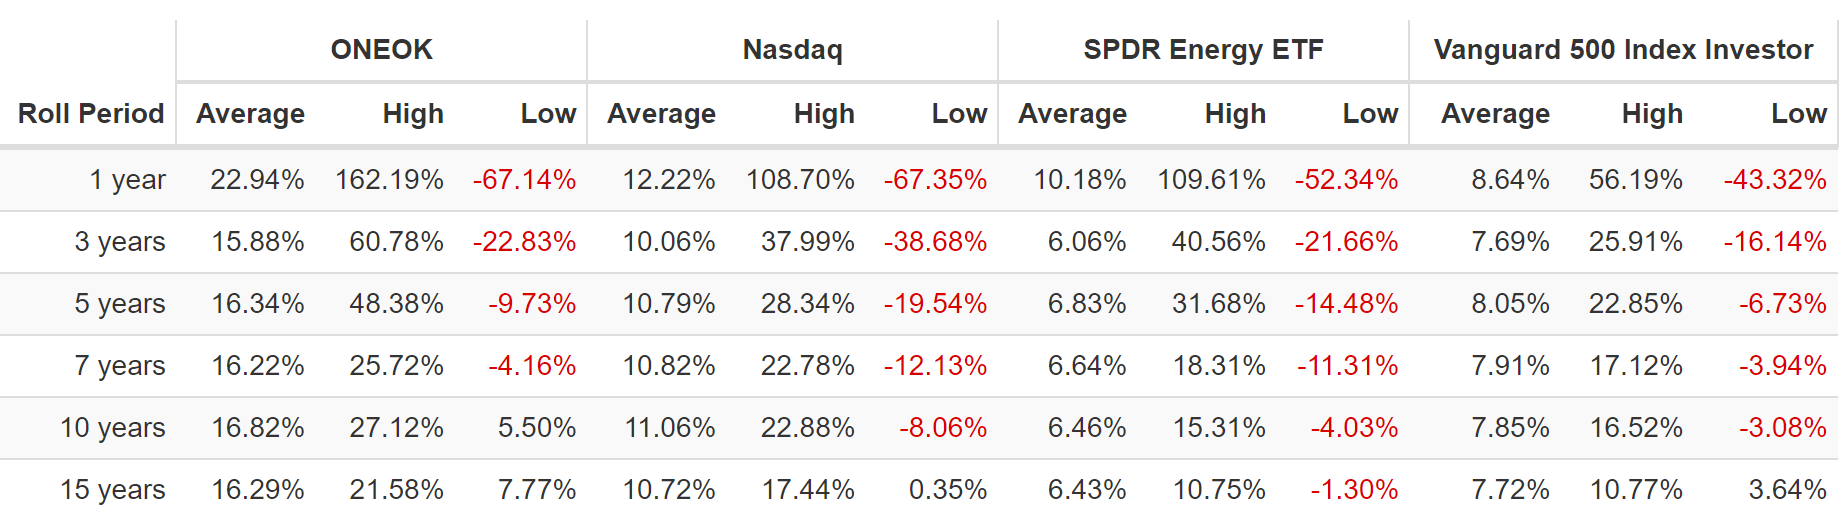
OKE’s average long-term rolling return was 16%, just slightly lower than what analysts expect in the future.
(Source: Portfolio Visualizer Premium)
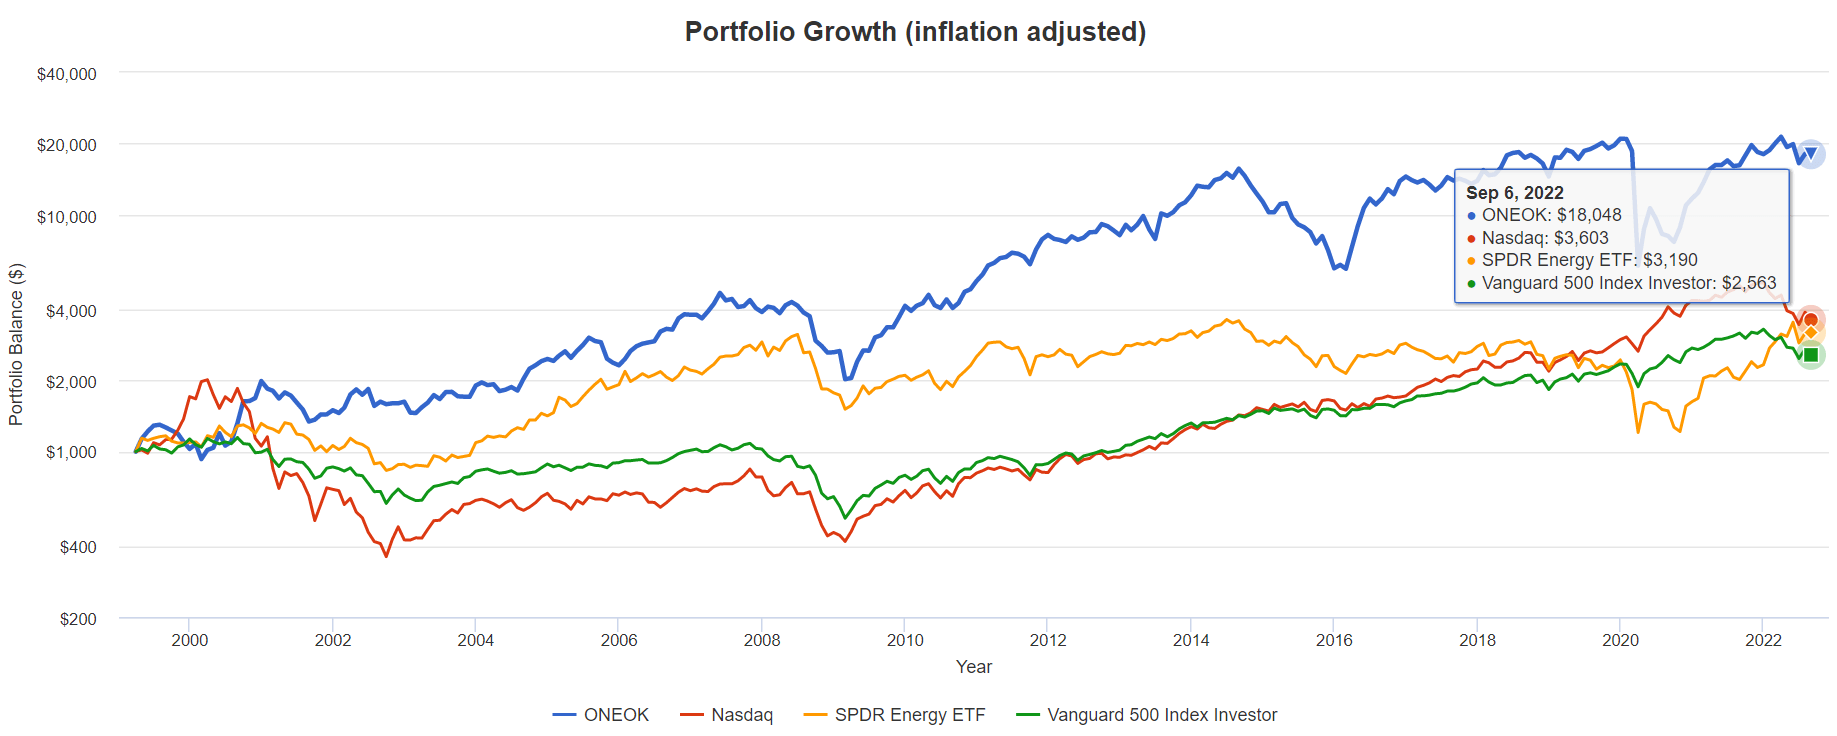
What does a quarter century of doubling the market’s returns get you?
Inflation-Adjusted Total Returns Since 1999
| Stock | Ticker | Inflation-Adjusted Return Since April 1999 |
Annual Real Return Since April 1999 |
| ONEOK | OKE | 1705% | 13.4% |
| SDPR Energy ETF | XLE | 219% | 5.2% |
| Nasdaq | QQQ | 260% | 5.7% |
| S&P 500 | VOO | 156% | 4.2% |
| X Better Returns Than S&P 500 | 10.9 | X Better Annual Returns Than S&P 500 | 3.19 |
(Source: Portfolio Visualizer Premium)
Adjusted for inflation, OKE has tripled the market’s real returns for 23 y ears and delivered 11X greater income and wealth.
What about the future?
Inflation-Adjusted Consensus Total Return Potential: $1,000 Initial Investment
| Time Frame (Years) | 8.0% CAGR Inflation-Adjusted S&P 500 Consensus | 8.8% Inflation-Adjusted Dividend Aristocrats Consensus | 12.4% CAGR Inflation-Adjusted OKE Consensus | Difference Between Inflation And Risk-Adjusted OKE Consensus And S&P Consensus |
| 5 | $1,467.97 | $1,523.16 | $1,792.44 | $324.47 |
| 10 | $2,154.93 | $2,320.01 | $3,212.85 | $1,057.92 |
| 15 | $3,163.37 | $3,533.75 | $5,758.85 | $2,595.48 |
| 20 | $4,643.72 | $5,382.46 | $10,322.40 | $5,678.67 |
| 25 | $6,816.84 | $8,198.35 | $18,502.30 | $11,685.46 |
| 30 | $10,006.90 | $12,487.39 | $33,164.30 | $23,157.40 |
(Source: DK Research Terminal, FactSet)
50% higher annual return potential than the S&P 500 equals the potential for a 33X bagger over 30 years, more than 3X better returns than the market.
| Time Frame (Years) | Ratio Dividend Aristocrats/S&P Consensus | Ratio Inflation And OKE Consensus vs. S&P consensus |
| 5 | 1.04 | 1.22 |
| 10 | 1.08 | 1.49 |
| 15 | 1.12 | 1.82 |
| 20 | 1.16 | 2.22 |
| 25 | 1.20 | 2.71 |
| 30 | 1.25 | 3.31 |
(Source: DK Research Terminal, FactSet)
Why am I excited to recommend a dividend stock that’s “just” 8% undervalued today? Not for the good, but far from the explosive return potential of the next few years. But the potentially life-changing income and wealth compounding it could provide in the coming decades.
Alexandria Real Estate: A High Tech REIT For A Star Trek Future
Further Reading
A deeper look into OKE’s investment thesis, growth potential, risk profile, valuation, and total return profile.
Alexandria Investment Thesis Summary
ARE specialties in high tech life science labs. It owns 426 such properties, which it leases to world-beater bioscience companies like Bristol-Myers (BMY) and Eli Lilly (LLY).
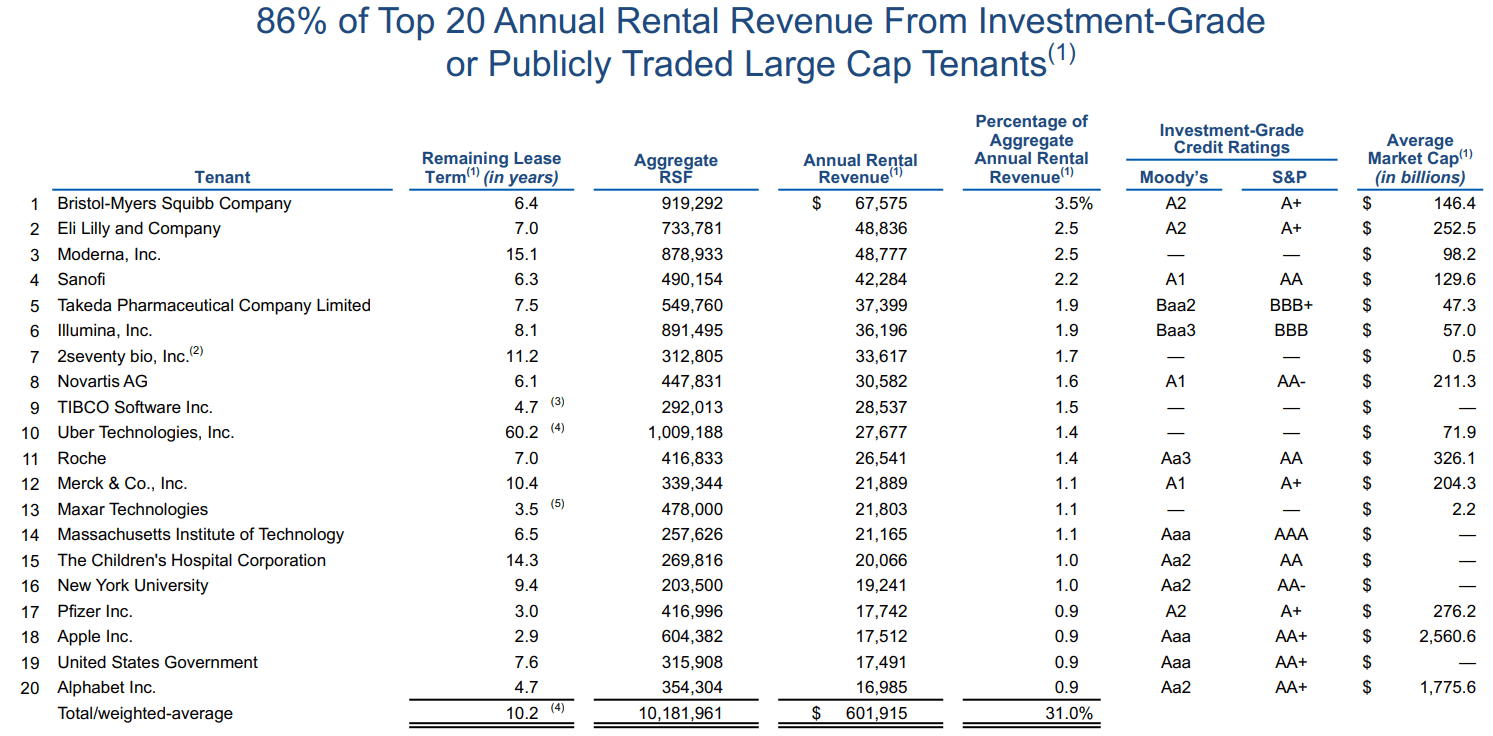
ARE Supplement
But wait, it gets better. ARE has as its top tenants some of the world’s leading tech firms, such as Apple (AAPL), Alphabet (GOOG) (GOOGL), and research institutions like MIT and New York University.
It also leases tech research facilities to the US government, which always pays its bills on time. Its average lease is 10.2 years long, and 86% of its top tenants are investment-grade public companies.
If you want to invest in the Star Trek future, this is the REIT to do it with.
Reasons To Potentially Buy Alexandria Today
| Metric | Alexandria Real Estate |
| Quality | 80% 11/13 SWAN (Sleep Well At Night) Life Science REIT |
| Risk Rating | Low |
| DK Master List Quality Ranking (Out Of 500 Companies) | 262 |
| Quality Percentile | 48% |
| Dividend Growth Streak (Years) | 11 |
| Dividend Yield | 3.10% |
| Dividend Safety Score | 84% Very Safe |
| Average Recession Dividend Cut Risk | 0.5% |
| Severe Recession Dividend Cut Risk | 1.9% |
| S&P Credit Rating |
BBB+ Positive Outlook (Investment Grade) |
| 30-Year Bankruptcy Risk | 5.00% |
| Consensus LT Risk-Management Industry Percentile | 70% Good |
| Fair Value | $173.54 |
| Current Price | $153.30 |
| Discount To Fair Value | 12% |
| DK Rating |
Potentially Reasonable Buy |
| PE | 18.3 |
| Cash-Adjusted PE | 7.1 |
| Growth Priced In | 0.60% |
| Historical PE Range | 18 to 20 |
| LT Growth Consensus/Management Guidance | 7.9% |
| PEG Ratio | 89.87 |
| 5-year consensus total return potential |
10% to 14% CAGR |
| Base Case 5-year consensus return potential |
11% CAGR (1.33X S&P 500) |
| Consensus 12-month total return forecast | 32% |
| Fundamentally Justified 12-Month Return Potential | 16% |
| LT Consensus Total Return Potential | 11.0% Vs. 9.2% for the REIT sector |
| Inflation-Adjusted Consensus LT Return Potential | 8.8% |
| Consensus 10-Year Inflation-Adjusted Total Return Potential (Ignoring Valuation) | 2.32 |
| LT Risk-Adjusted Expected Return | 7.32% |
| LT Risk-And Inflation-Adjusted Return Potential | 5.10% |
| Conservative Years To Double | 14.13 |
(Source: Dividend Kings Zen Research Terminal)
ARE 2024 Consensus Total Return Potential
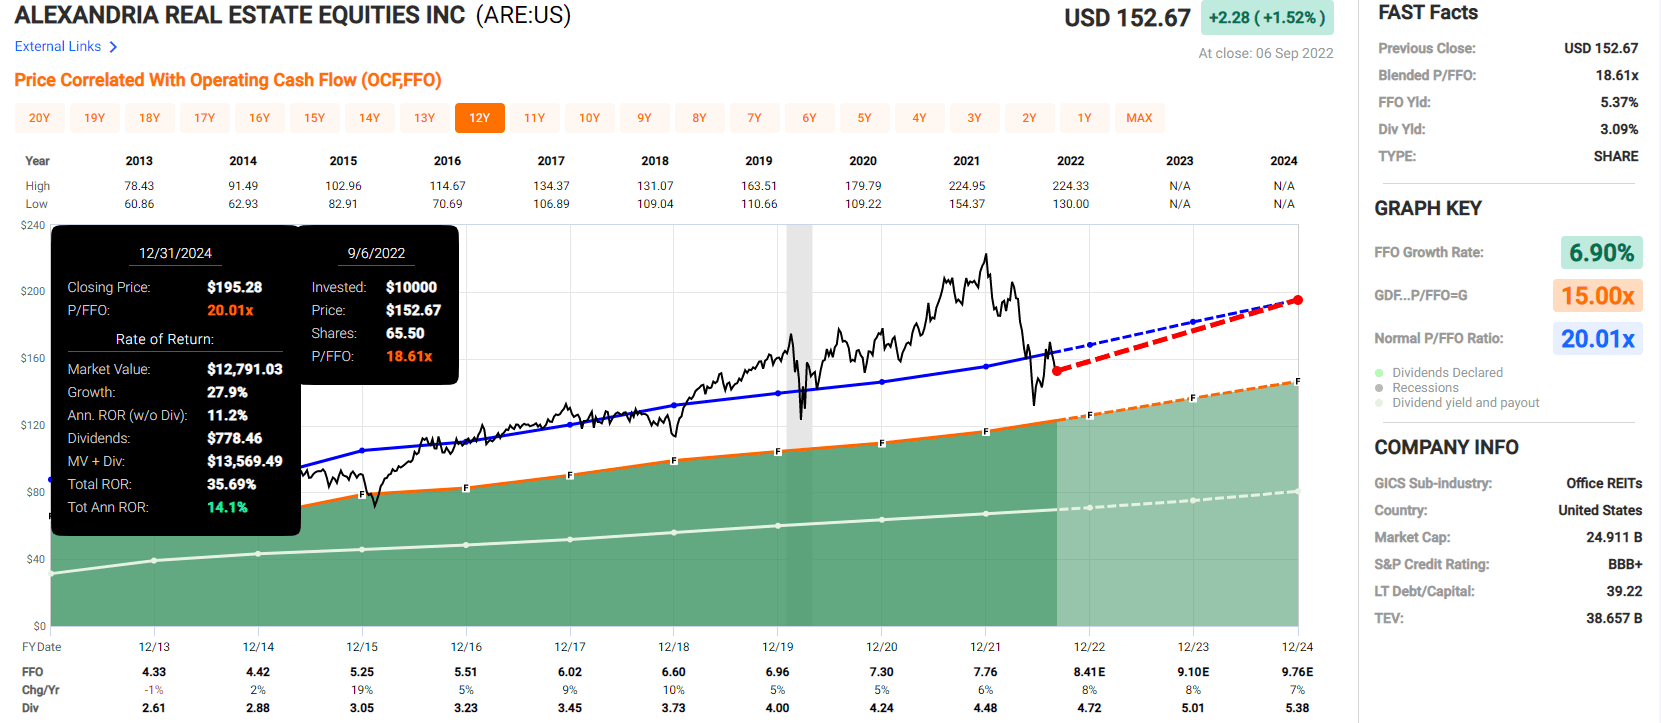
(Source: FAST Graphs, FactSet)
ARE 2027 Consensus Total Return Potential
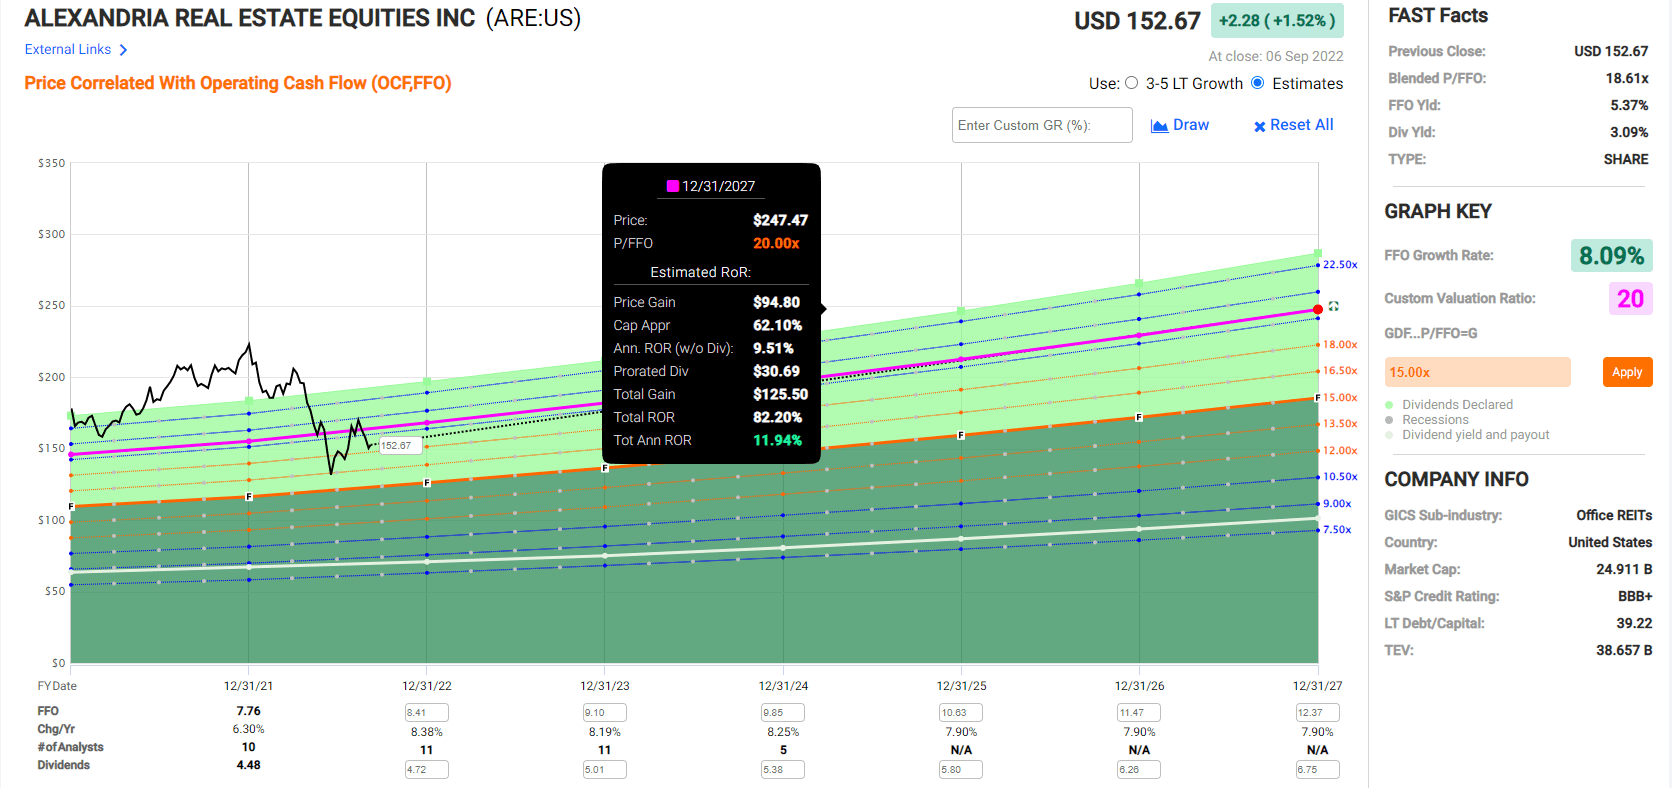
(Source: FAST Graphs, FactSet)
REITs are a sector known for generous yield and modest growth. ARE combines a very safe 3.2% yield with almost 8% growth to deliver 11% long-term and medium-term return potential.
ARE Investment Decision Score

DK
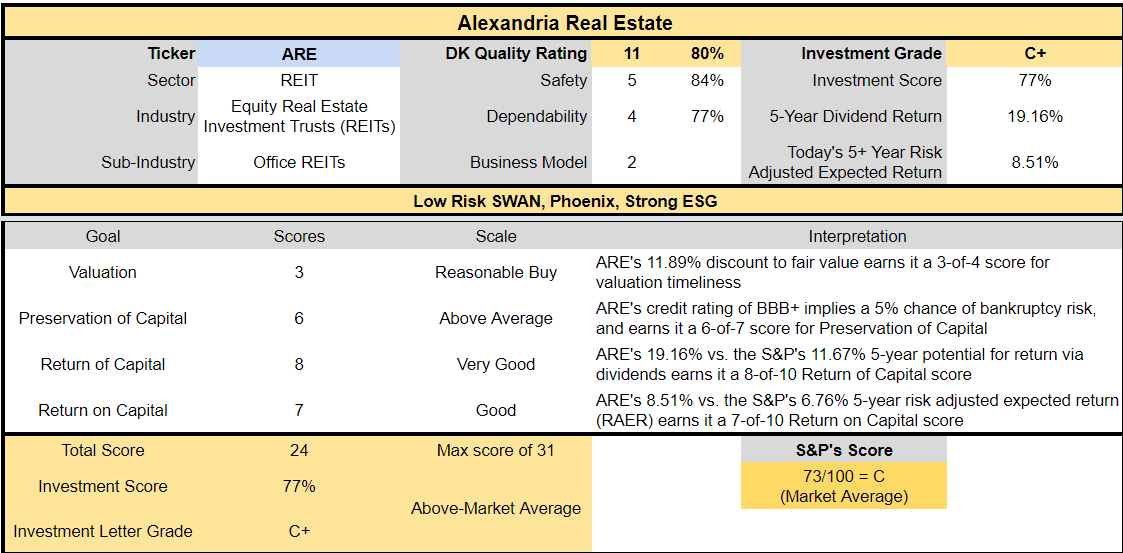
(Source: Dividend Kings Automated Investment Decision Tool)
ARE is a reasonable buy, making it a potentially superior option to the broader market.
- 12% discount vs. 2% market discount = 10% better valuation
- 3.1% yield vs. 1.7% yield (almost 2X the yield and a much safer yield at that)
- 10% better consensus long-term return potential
- 33% better risk-adjusted expected return over the next five years
- almost 2X more income over the next five years
| Investment Strategy | Yield | LT Consensus Growth | LT Consensus Total Return Potential | Long-Term Risk-Adjusted Expected Return | Long-Term Inflation And Risk-Adjusted Expected Returns | Years To Double Your Inflation & Risk-Adjusted Wealth |
10-Year Inflation And Risk-Adjusted Expected Return |
| Alexandria Real Estate | 3.1% | 7.9% | 11.0% | 7.7% | 5.5% | 13.1 | 1.70 |
| REITs | 3.2% | 6.0% | 9.2% | 6.4% | 4.2% | 17.1 | 1.51 |
| Dividend Aristocrats | 2.4% | 8.6% | 11.0% | 7.7% | 5.5% | 13.2 | 1.70 |
| S&P 500 | 1.7% | 8.5% | 10.2% | 7.1% | 4.9% | 14.6 | 1.62 |
(Source: DK Research Terminal, Morningstar, FactSet, YCharts)
If you want to achieve aristocrat-like long-term returns but with a higher very safe yield while investing in the world’s most advanced research labs, ARE is a great way to do that.
Total Returns Since June 1997
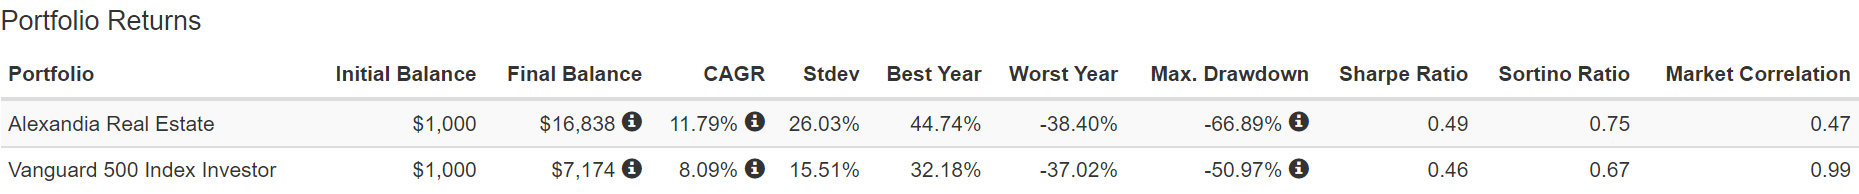
(Source: Portfolio Visualizer Premium)
Analysts expect ARE to deliver similar returns to the nearly 12% investors have enjoyed for the last 25 years, during which it doubled the market’s returns.
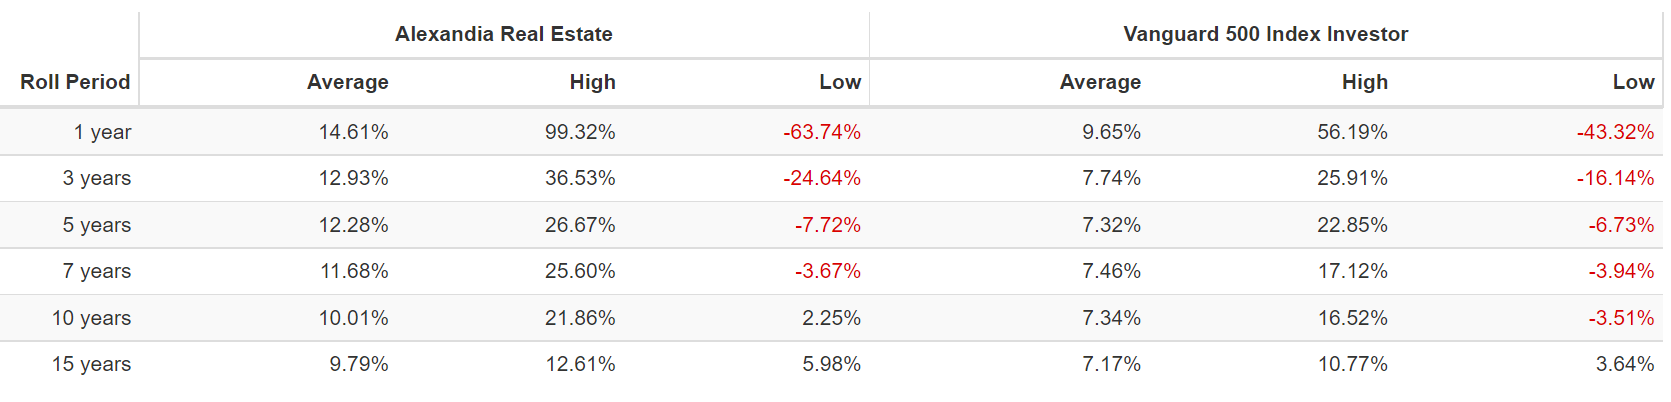
(Source: Portfolio Visualizer Premium)
ARE’s combination of great assets and excellent management, along with a fortress balance sheet S&P is considering upgrading to an A-rating, is what’s helped deliver consistent market-beating returns.
Inflation-Adjusted Consensus Return Potential: $1,000 Initial Investment
| Time Frame (Years) | 8.0% CAGR Inflation-Adjusted S&P 500 Consensus | 8.8% Inflation-Adjusted Dividend Aristocrats Consensus | 8.8% CAGR Inflation-Adjusted ARE Consensus | Difference Between Inflation And Risk-Adjusted ARE Consensus And S&P Consensus |
| 5 | $1,467.97 | $1,523.16 | $1,523.16 | $55.19 |
| 10 | $2,154.93 | $2,320.01 | $2,320.01 | $165.08 |
| 15 | $3,163.37 | $3,533.75 | $3,533.75 | $370.38 |
| 20 | $4,643.72 | $5,382.46 | $5,382.46 | $738.74 |
| 25 | $6,816.84 | $8,198.35 | $8,198.35 | $1,381.51 |
| 30 | $10,006.90 | $12,487.39 | $12,487.39 | $2,480.49 |
(Source: DK Research Terminal)
With REITs, the goal isn’t to achieve Buffett-like returns but merely good returns with great safe yields. And that’s what ARE offers.
| Time Frame (Years) | Ratio Dividend Aristocrats/S&P Consensus | Ratio Inflation And ARE Consensus vs. S&P consensus |
| 5 | 1.04 | 1.04 |
| 10 | 1.08 | 1.08 |
| 15 | 1.12 | 1.12 |
| 20 | 1.16 | 1.16 |
| 25 | 1.20 | 1.20 |
| 30 | 1.25 | 1.25 |
(Source: DK Research Terminal)
Match the aristocrats, beat the market, and enjoy a safe high yield better than both? That’s what I call an attractive bear market opportunity.
Bottom Line: OKE And ARE Are 2 Great Brand-New Bear Market High-Yield Blue-Chip Buys
Bear markets can be terrifying but always end and bring great blue-chip buying opportunities.
I can’t tell you when this bear market will end for sure, just that it will, and likely sooner than most investors expect and bargain hunters would like.
Today ONEOK and Alexandria Real Estate represent two world-class high-yield blue chips that have suffered during the recent market correction. They aren’t screaming buys by any means, and they might end up falling a bit more if the market rolls over as some blue-chip economist teams think it might.
But while I can’t tell you what either will do in the short term, here’s what I can say with high confidence.
Anyone buying bear market blue-chip opportunities like OKE and ARE today is very likely to feel smart in 3-5 years and like a stock market genius in a decade.
Volatility isn’t risk, it’s the source of future returns.” – Joshua Brown
Don’t try to buy at the bottom and sell at the top. This can’t be done – except by liars.” – Bernard Baruch
I never buy at the bottom and I always sell too soon.” – Baron Nathan Rothschild
When you buy great companies at reasonable to attractive prices and hold for the long term you are harnessing the power of the greatest corporate minds in the world.
Worried about interest rates? Inflation? Recession? War? If you own the right blue chips within a diversified and prudent risk-managed portfolio, you can stop worrying and praying for luck on Wall Street.
Because when the world’s smartest business people are working hard for you, one day you won’t have to.
Be the first to comment