

US Dollar, EUR/USD, GBP/USD, USD/JPY Talking Points:
Tomorrow brings what’s expected to be a highly-watched CPI report out of the United States. After watching this data point climb from a January 2021 low of 1.4 up to 6.8% in December, worry has mounted that inflation has taken on a life of its own and the Fed may have a difficult time paring back the recent rise in prices.
For the Fed’s part, the bank continued to say that they thought inflation was transitory into late last year, with Chair Powell finally ‘retiring’ the word on December the 1st.
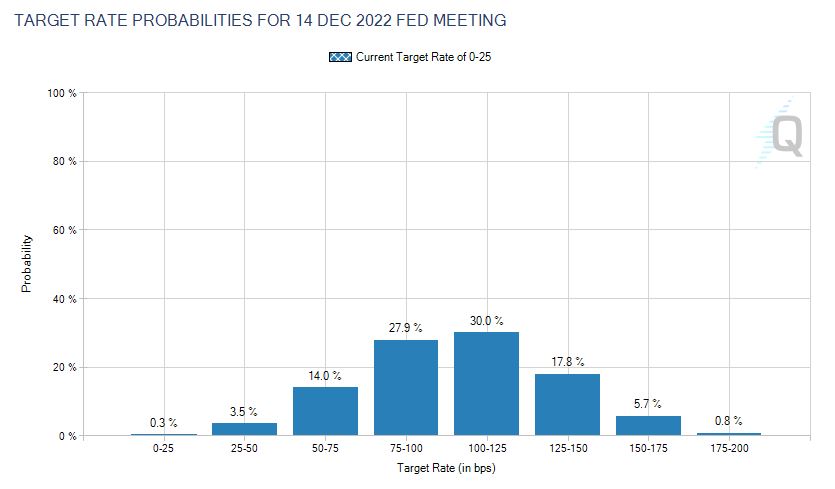
Since then, the December FOMC rate decision showed a more-hawkish Fed that forecasted between 2-3 rate hikes. Since then, rates markets have continued to run and markets are now expecting a median of four hikes this year, as taken from CME Fedwatch (image below).
Tomorrow brings the next big piece of the puzzle with the release of CPI numbers for the month of December. And the expectation is high, with markets looking for a 7% read on headline inflation to go along with a 5.4% hit on core CPI. That expectation is what’s helping to drive the rates picture, and this can keep the US Dollar in focus for Forex markets near-term.
FOMC Rate Probabilities To December, 2022
Chart prepared by James Stanley; Data from CME Fedwatch
US Dollar
The US Dollar remains in the same range that’s been in-play for almost two months now. This morning saw prices dip towards range support as Powell sounded fairly dovish, all factors considered, at his nomination hearing in front of Congress.
Splitting inside of the recent range and there’s been the apparent development of some bearish items, with a series of lower-highs coupled with a second test of support around 95.60. This is a short-term descending triangle formation, and this actually meshes up quite well with a setup in EUR/USD which I’ll look at a little later in this article.
Range support is 95.52 and resistance is 96.48 and 96.90.
US Dollar Four-Hour Price Chart
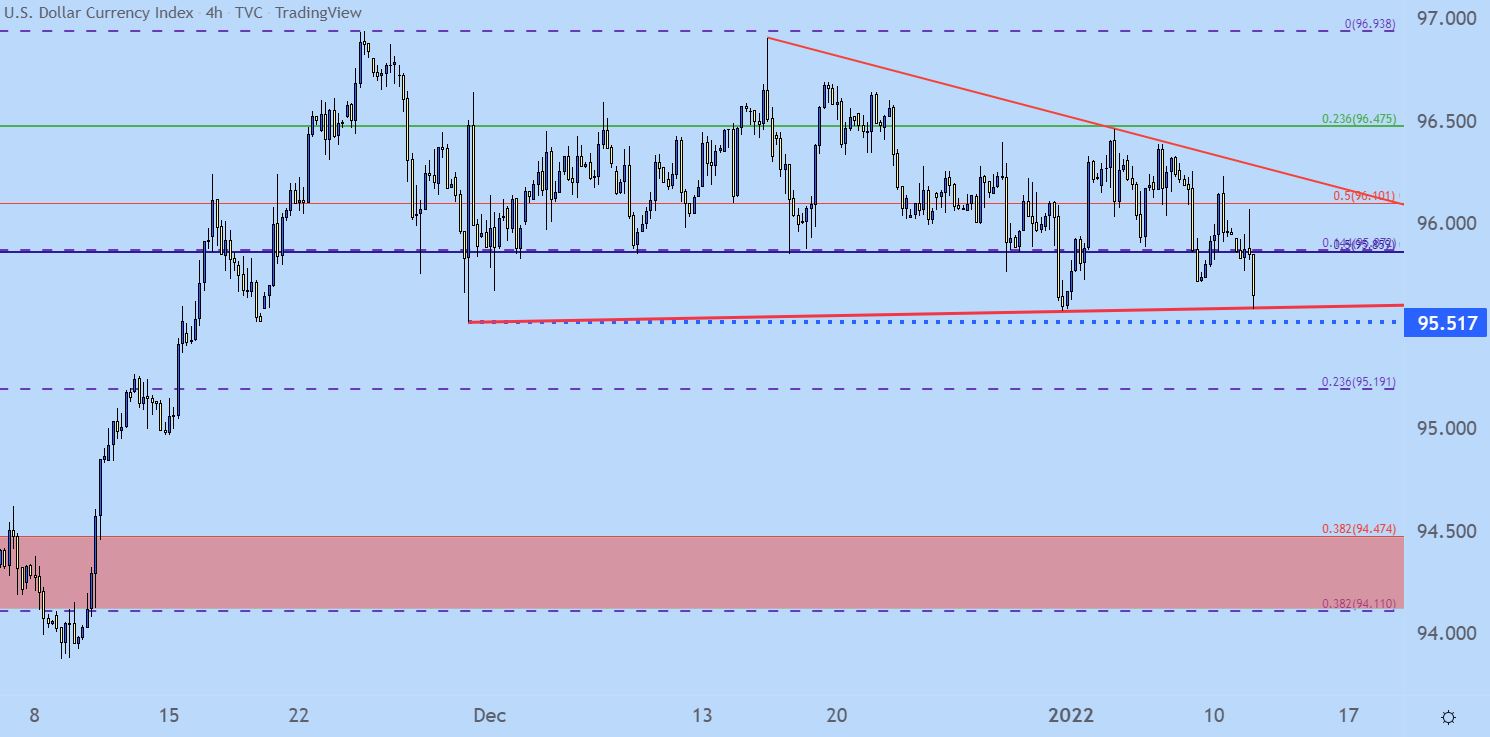
Chart prepared by James Stanley; USD, DXY on Tradingview
EUR/USD Ascending Triangle
I had written about this setup in EUR/USD yesterday, highlighting a massive spot of support sitting underneath price action. That zone came into play in late-November and since then sellers have been put on hold.
Shorter-term, and as a mirror image to the above scenario in the USD, EUR/USD has built in an ascending triangle formation. Such setups will often be approached with the aim of bullish breakouts; and in this case this could push EUR/USD up to the next resistance zone of 1.1448-1.1500. A touch and hold of resistance there can re-open the door to longer-term bearish strategies.
But, bears have had almost two months to take advantage of this setup and they haven’t yet, which means that price may need a pullback to take out some trailed stops before fresh lows can come into the equation.
EUR/USD Daily Price Chart
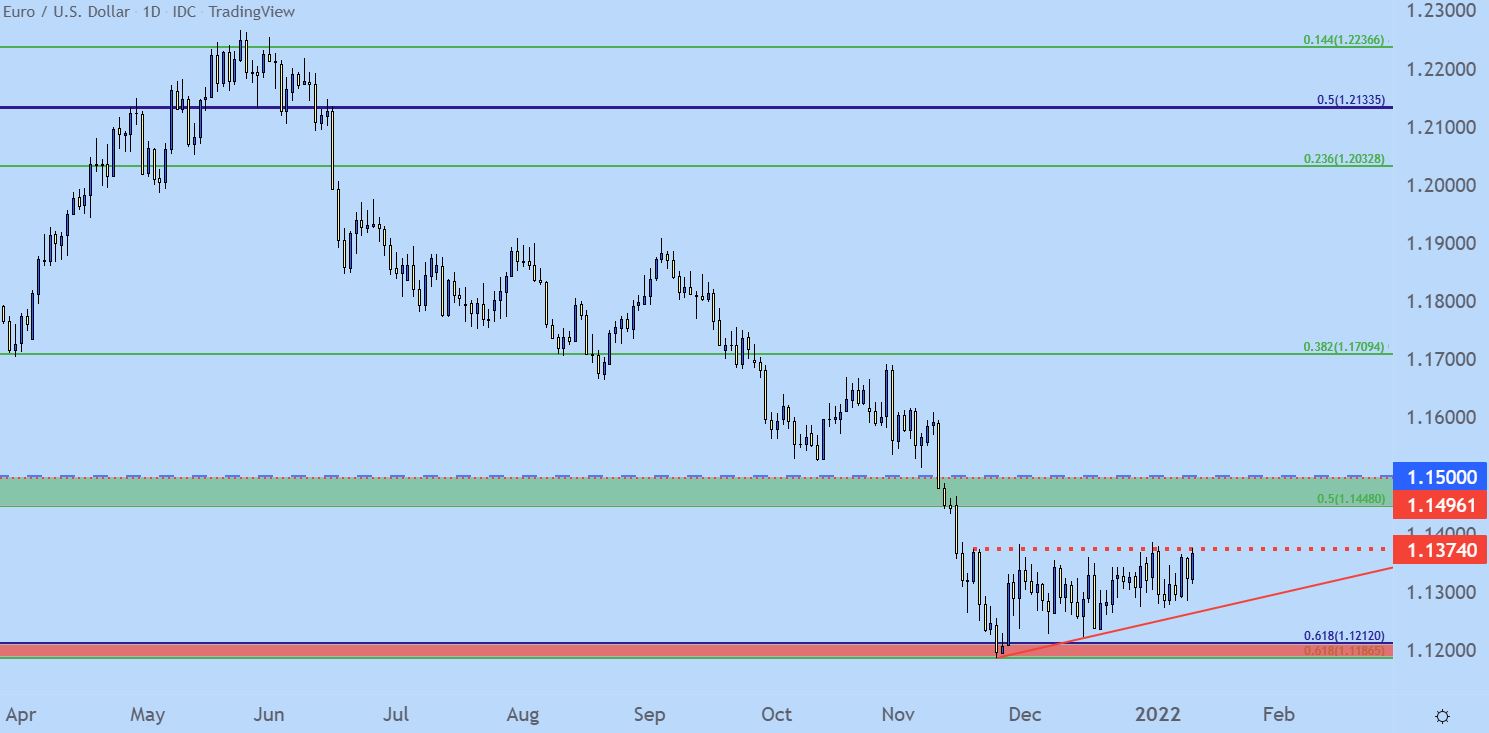
Chart prepared by James Stanley; EURUSD on Tradingview
GBP/USD for USD-Weakness
GBP/USD remains as one of the more attractive major pairs for themes of USD-weakness. A major spot of support came into play in December. At the time, price action was threatening invalidation of the bull flag formation, which was confluent with a 38.2% Fibonacci retracement of the 2020-2021 major move.
But, a rate hike out of the BoE in December helped to change matters, and today sees GBP/USD now testing through the top side of that bull flag. This can keep the door open for bullish scenarios, and in the webinar, I went over a few different ways to approach, based on how a trader might want to interact with risk.
GBP/USD Daily Price Chart
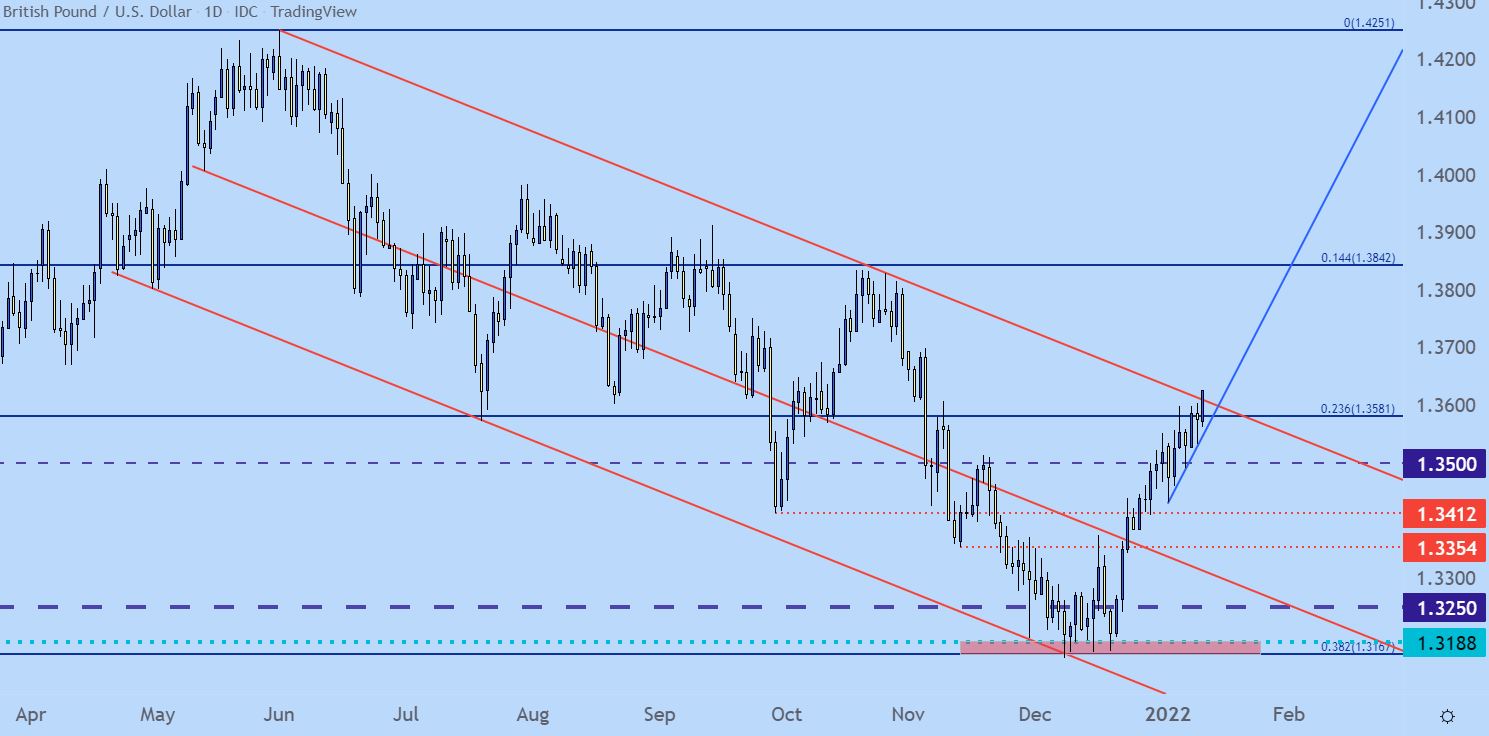
Chart prepared by James Stanley; GBPUSD on Tradingview
USD/JPY Continuation Potential v/s Reversal Scenarios
If we are truly seeing a higher rates scenario take-hold, the topside of USD/JPY can remain as attractive. So far this week that bullish theme has gotten an extra bit of confirmation with prices finding support around the psychological level at 115.00.
The larger concern, however, is the big picture technical backdrop as a rising wedge has developed. Shorter-term, strength continuation could be more justifiable given that recent hold of 115.00, but buyers need to get their act together over the next week to keep the door for this scenario open.
If we do see a retreat back to the 114.00 handle, then reversals are going to look much more attractive here. But, for how, we have higher highs and higher lows. The trend is bullish until it’s not, and I’m using that 114.00 spot for invalidation near-term.
USD/JPY Daily Price Chart
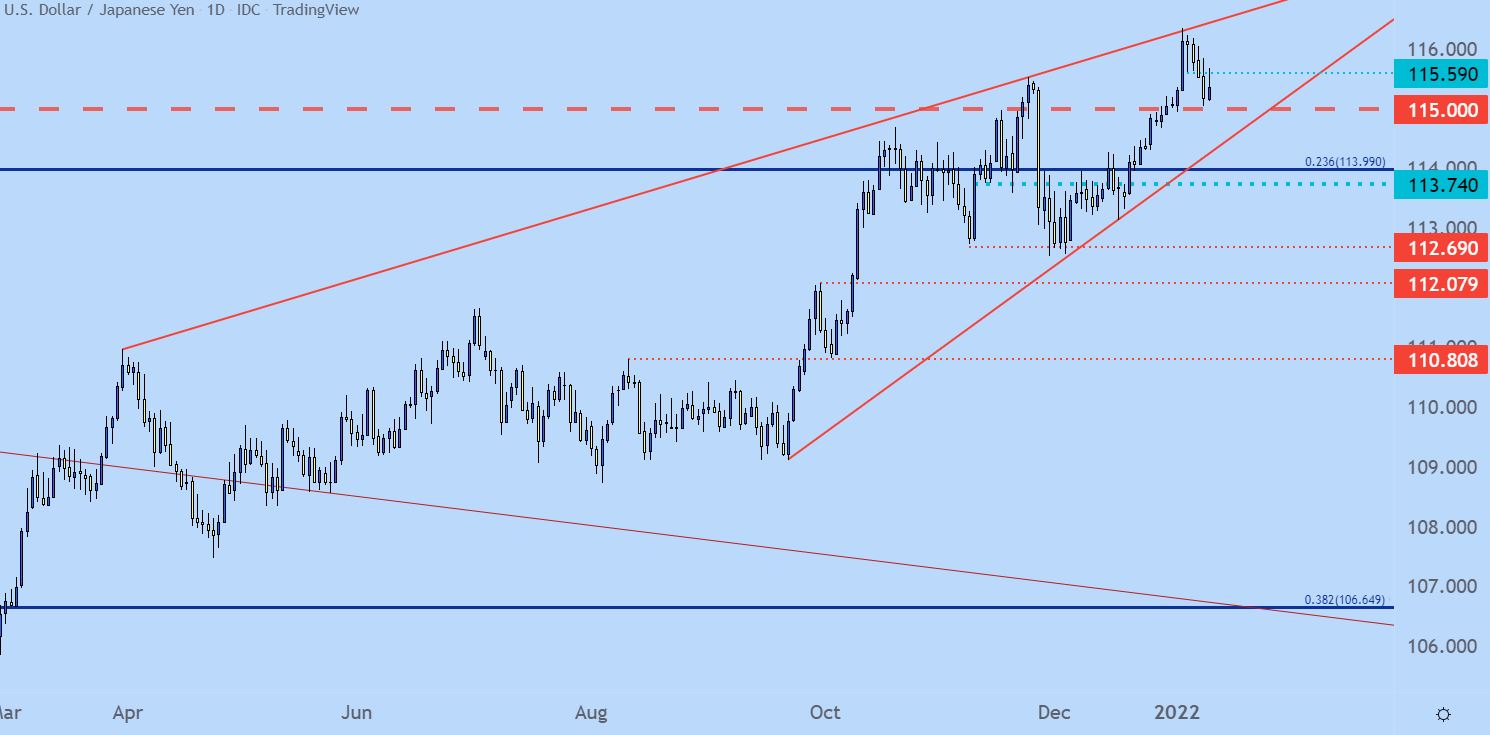
Chart prepared by James Stanley; USDJPY on Tradingview
— Written by James Stanley, Senior Strategist for DailyFX.com
Contact and follow James on Twitter: @JStanleyFX
Be the first to comment