Orientfootage
Written by Nick Ackerman, co-produced by Stanford Chemist. This article was originally published to members of the CEF/ETF Income Laboratory on November 27th, 2022.
Virtus Total Return Fund (NYSE:ZTR) is down quite significantly from the last time we covered this name, earlier in April of this year. At that time, the fund was holding up relatively well due to the utility sector holding up well.
ZTR Performance Since Previous Update (Seeking Alpha)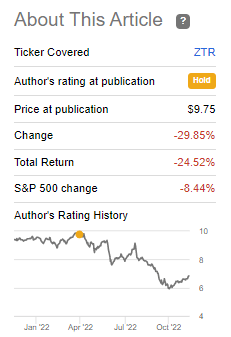
Since that time, there have been a couple of things that happened. First, the entire market has continued to remain under pressure this year. With no place safe to hide, equities or bonds, so the fixed-income exposure hasn’t helped ZTR. Utilities were holding up well but have shown weakness in the latter half of the year. Some of the problem is that utilities were and still are running a higher valuation than historically.
The second thing, and I believe the main reason for such a dismal performance at this time, was the fund going to a meaningful discount now. In that previous article, the fund was trading at a nearly 5% premium. As of writing, the fund is sitting at a discount of around 8.5%.
That’s a significant drop and is what makes ZTR more tempting today. At a premium, it was an avoid, but now it could be presenting a time to nibble in for investors wanting to look for the type of exposure it offers.
Helping to lead to such a drop would seem to be the rights offering between then and now. Stanford Chemist provided an update of the results in a previous post in more detail. It made the fund larger, but since it was at a discount to NAV, it was dilutive. That ended in September, but the discount still remains.
The Basics
- 1-Year Z-score: -1.67
- Discount: -8.56%
- Distribution Yield: 14.04%
- Expense Ratio: 1.32%
- Leverage: estimated 30.28%
- Managed Assets: $683.53 million
- Structure: Perpetual
ZTR’s investment objective is quite simple: “capital appreciation, with current income as a secondary objective.” As previously mentioned, they intend to do this via a 60/40 split. Though they will focus the equity portion on “owners/operators of infrastructure in the communications, utility, energy, and transportation industries.” The fixed-income sleeve is designed “to generate high current income and total return through the application of active sector rotation, extensive credit research, and disciplined risk management designed to capitalize on opportunities across undervalued areas of the fixed income markets.”
The fund’s expense ratio comes to 1.32%, according to their last semi-annual report. When including leverage, it comes to 1.76%. The borrowings are through a credit facility that is based on LIBOR plus a spread. Meaning that as interest rates rise, the leverage costs will also rise for ZTR. The last reported interest rate at the end of May 31st, 2022, was 1.645%, with $159.750 million outstanding. They’ve now taken that leverage up to $207 million.
ZTR Assets (Virtus)
Since interest rates have continued to rise and the total amount borrowed has also increased, the leverage expense will rise materially. That isn’t necessarily a bad thing, as the potential earnings power of the fund can also rise. Of course, with leverage, that also means the potential for further downside also increases too.
I think it’s also important to note once in a while when covering ZTR that it is a bit of a Frankenstein fund. It was reorganized several times and renamed. What we see today isn’t the same fund that it was over the last ten years. In fact, the last change was at the end of 2019.
At that time, the Virtus Total Return Fund (ZF) was reorganized into ZTR. ZTR was then renamed to adopt the merged fund’s name. Then an additional change happened in 2020 when they removed the options strategy overlay. So, any information prior to June 2020 isn’t necessarily meaningful as the fund has evolved.
Performance – Attractive Discount
All the mention of how this fund has evolved is important because this fund has hardly made any returns since it’s been around. At least when looking at the annualized performance table provided on the fund’s website. There are times when you can trade in and out of a fund and be successful.
ZTR Annualized Returns (Virtus)
Particularly when the fund is trading at a discount has been a good time to buy going back to around 2015. There has been somewhat of a pattern since that time, when the fund went to a wide discount and then narrowed. Eventually, the wide discount went to a high premium on a couple of occasions.
That’s why at this time, the fund’s discount is looking quite enticing if we can get the same pattern to play out. That’s not guaranteed to happen, of course. At present, it is trading below the average we have seen the fund trade at in the last decade. The fund trading at a premium through 2021 and a large portion of 2022 certainly impacts this average, though.
Ycharts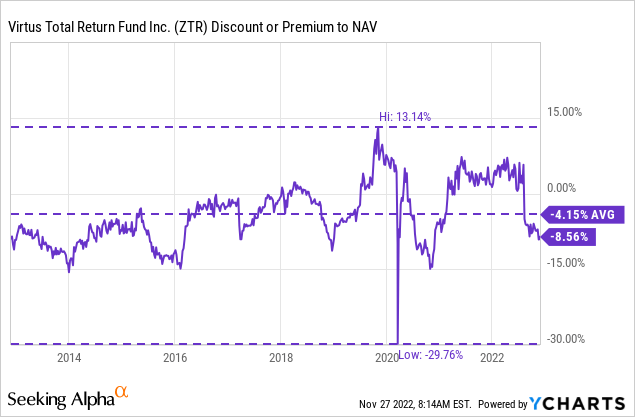
Again, since this fund has evolved with the latest change in 2020, it’s important to consider that its history is probably less reliable than usual.
Distribution – An Uphill Battle
Investors might be interested to know that Connie Luecke is the senior manager of this fund. Some investors may know her from the DNP Select Income Fund (DNP). DNP has one of the longest track records of consistent distributions from closed-end funds that I know of. So we know that they want to provide stable and predictable income.
Unfortunately, for ZTR, it has been really anything but stable over the longer term. Since 2020, it has been consistent, though.
ZTR Distribution History (CEFConnect)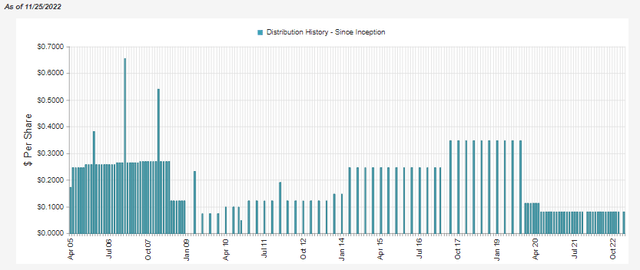
Further, it’s an uphill battle at this time with trying to support the current distribution. I wasn’t confident in the payout previously, and it has now just become worse. Previously it was a 9.92% distribution yield and a NAV rate of 10.40%. With the sharp drop in share price, the distribution rate has risen to 14.04%.
However, the NAV has also dropped, pushing the NAV yield to 12.83%. DNP is having its own troubles this year, but its NAV distribution rate is still a more reasonable 8.38%.
So I would once again reiterate that the current level is unsustainable, given the heavy reliance on capital gains to fund the distribution. I would only feel more comfortable if net investment income rose rapidly or the NAV yield dropped considerably as assets appreciated. That doesn’t mean that they will cut, but at this point, it would be eroding capital to fund the distribution.
For most investors, I think the general feeling is that 2023 isn’t going to be a great year, with a recession expected. Additionally, some investors believe that the next decade could be a struggle to find any direction, and we will have another lost decade—a good time for an options writing strategy that they removed if that were the case.
While I can’t predict the future, I can see that NII doesn’t cover the distribution, and this will be further pressured as interest rates rise to cause the leverage costs to grow. The fund has a fixed-income sleeve but is mostly allocated to fixed-rate bonds. Meaning that they won’t see any meaningful increase in income from that allocation until the portfolio starts to turnover.
The silver lining here is that their rights offering raised assets that they can put to work in higher-yielding bonds today. That should result in some positive impact, perhaps enough to offset the negative impacts of the higher leverage costs. The next annual report should be available in February of next year to give us a better idea.
ZTR Semi-Annual Report (Virtus)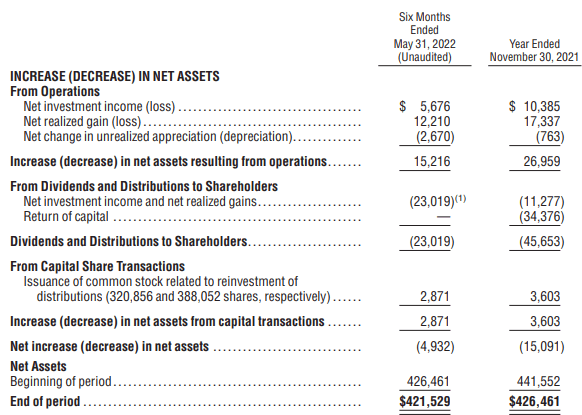
For tax purposes, the fund reports a sizeable amount classified as return of capital. As we discussed the shortfall in coverage, at least some of this is destructive ROC.
ZTR Annual Report (Virtus)
ZTR’s Portfolio
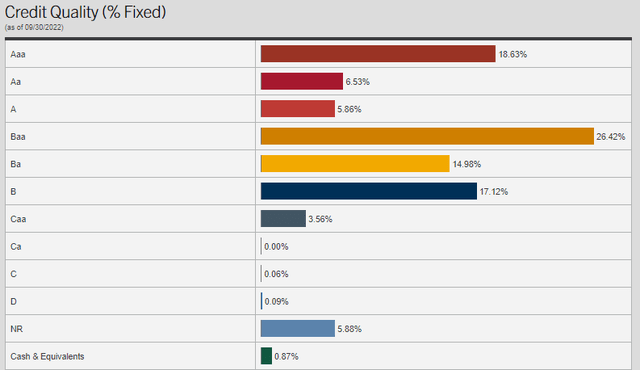
ZTR’s portfolio is roughly 60/40, with 60% allocated to utility equity positions and 40% spread across various fixed-income. The various fixed-income exposure is spread even further amongst various credit quality allocations. A mixture of both investment-grade and high-yield or junk debt.
The largest part is allocated to high-yield corporate bonds, with investment-grade corporate bonds following.
ZTR Fixed-Income Sector Allocation (Virtus)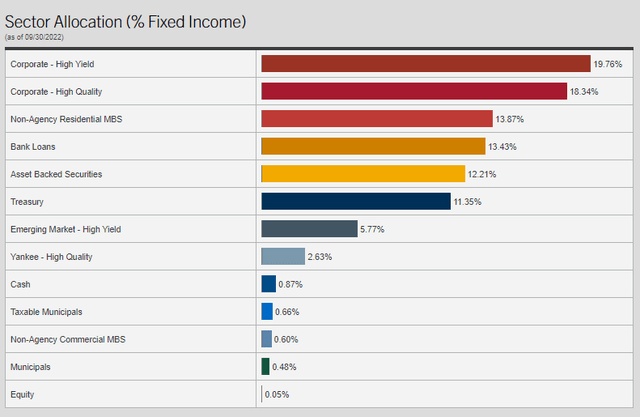
They also have MBS exposure, as we can see listed above. These are non-agency residential MBS positions, so they can be much more sensitive to credit risks.
Following that, we have bank loans. The bank loans are the portion of the portfolio that should be least susceptible to rising interest rates. In fact, since they are based on floating rates, they should benefit. One of the problems here is that this is 13.43% of 40% of ZTR’s portfolio. So while 13%+ would be considerable, it is 13% of the smaller sleeve of the portfolio, meaning that the overall exposure here is minimal.
When looking at the equity allocations, we see that utilities make up the largest single-sector exposure. This is then followed by a meaningful allocation to industrials and then some energy exposure. As mentioned for the bank loans, keep in mind that these weightings are the breakdown for only roughly 60% of the portfolio.
ZTR Sector Allocation (Virtus)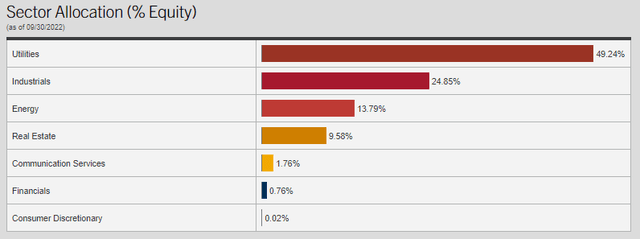
The largest positions are all dominated by equity positions. This isn’t that uncommon, as fixed-income CEFs tend to distribute the allocation across many different holdings.
CEFConnect puts the total number of holdings at 618. I counted 45 equity positions listed at the end of May to help provide some context of the breakdown of the number of holdings between equity and fixed-income. Yet, the equity sleeve is larger by a meaningful amount relative to the fixed-income sleeve.
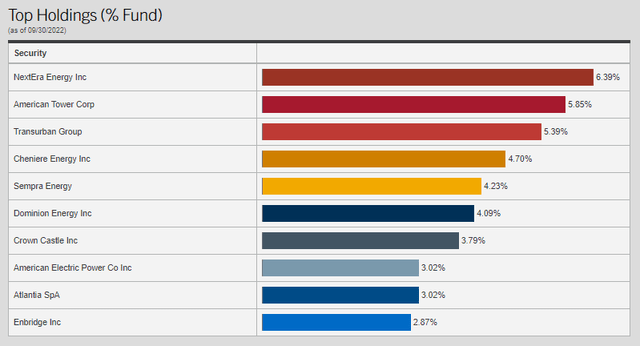
Like any good utility fund, the largest allocation is to NextEra Energy (NEE). That being said, the last time we looked at the fund, American Tower Corp. (AMT) was the largest. Both positions have increased their total weighting in the fund quite significantly. AMT was 4.48% weight, and NEE was 4.10%.
Dominion Energy (D) was the third largest position previously, but this has slid down the list. At the same time, its allocation has also increased from the 3.73% it was at previously. So the top ten of the fund has overall become more concentrated. Here is the performance of these three names from the end of March 2022 to the end of September 2022, which is the date of the listing above.
Ycharts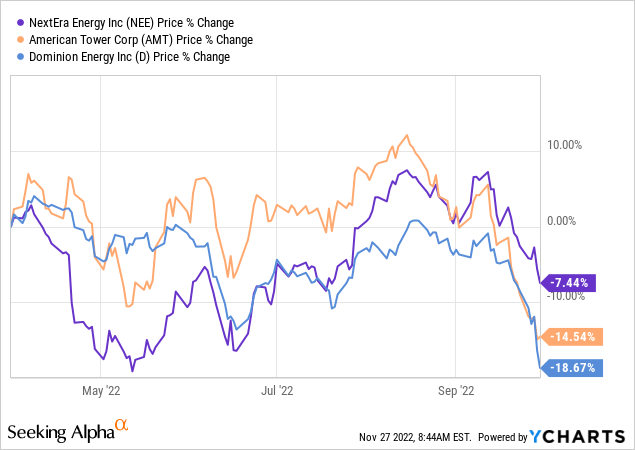
None in this trio had performed well. NEE just didn’t fall nearly as much as the other two. We can look at the performance of these three in the last decade. NEE and AMT have been spectacular.
Ycharts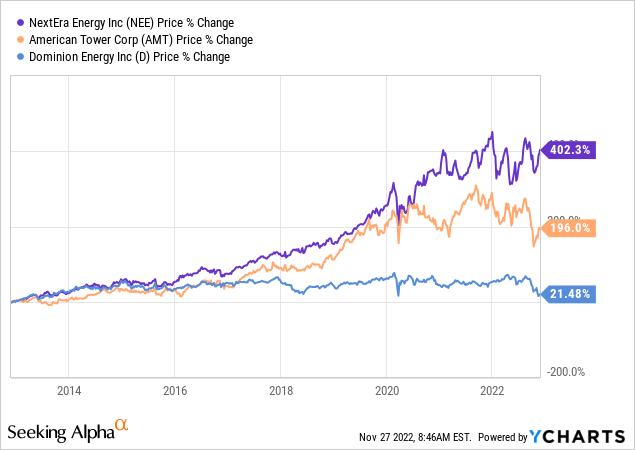
I bring up D because it has caught my attention as it hits new lows it hasn’t seen in years.
Ycharts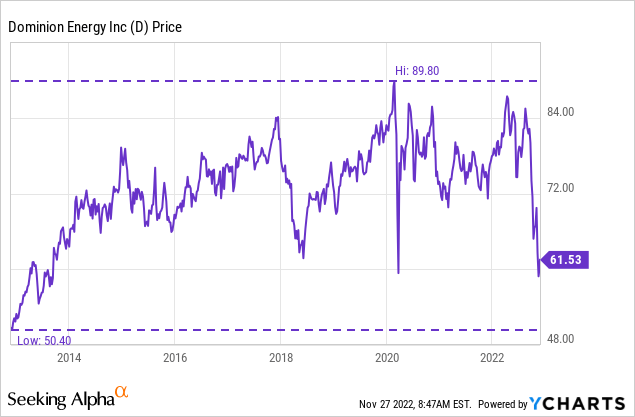
It is also quite a different company than it was a few years ago. In 2020, they sold their pipeline and storage business to Berkshire Hathaway Energy. This transitioned them into a pure-play utility operation. They’ve also taken up the sustainability-focused tilt. Of course, that’s every utility since they are essentially forced to due to regulations.
We can clearly see that NEE has been able to capitalize on the renewable focus. They are the world’s largest generator of wind and solar. The returns in the stock price and the growth speak for themselves. However, this transition isn’t going very smoothly for D.
More recently, analysts have been downgrading them ruthlessly. That includes JPMorgan (JPM), Wolfe Research, Credit Suisse, Bank of America (BAC) and Evercore ISI. With that many downgrades and price target cuts, it would seem they’ve certainly beaten down this stock. Which is what makes it interesting to me at this time. The overall message seems that they don’t have a clear direction they are heading at this time.
It is enticing for a longer-term investor that has years to hold onto a position and isn’t worried quarter to quarter. So it is unfortunate that it was in ZTR’s portfolio while all these downgrades came, but it could be in a position to outperform going forward.
Conclusion
ZTR is a much more attractive fund at a discount. However, I’d be buying for the discount if I bought – not for the expectation that the 14% distribution yield will likely remain. If it does, that could be a bonus. However, the coverage here is severely lacking, with an uphill battle to ever make the current payout work. As things remain depressed and they erode their capital, it will only become more and more difficult to maintain the payout.


Be the first to comment