

Woverwolf/iStock via Getty Images
Tech Burst
Yesterday was a day to remember.
The Nasdaq-100 index has lost over 5%, a rare day since the tech bubble burst of the early 2000s.
BearTrapsReport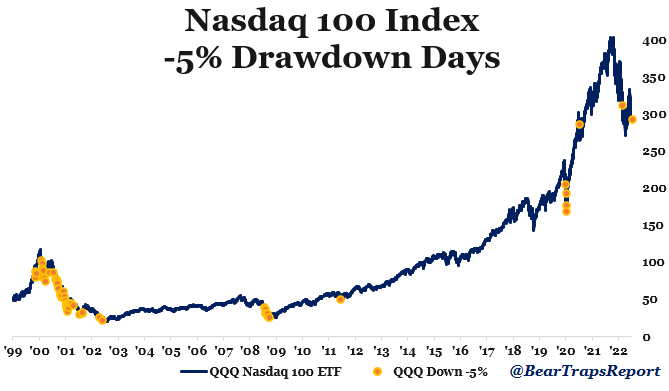
Furthermore, for the first time since March 2020, not a single component to the 102-member index finished the day in the green.
Bloomberg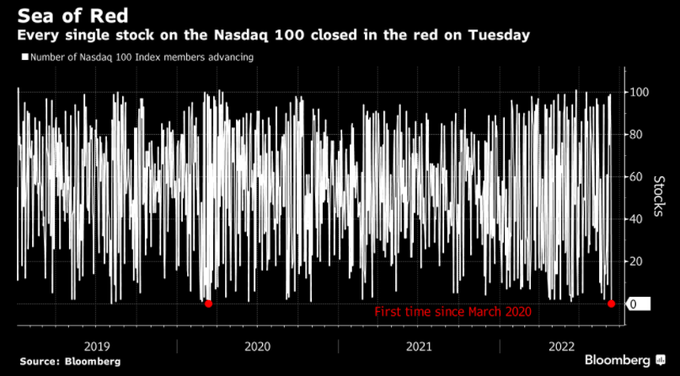
Bond Burst
2022 is a year for the history books, but not due to the tech burst rather thanks to what is happening in the bond market.
Not only is the Bloomberg Global Aggregate index down nearly 17% this year (on a total return basis), but it’s almost performing as badly as the S&P 500 (down ~17.5% YTD).
When was the last time bonds have lost just as much as stocks when the latter were down double-digits? Never before.
Bianco Research LLC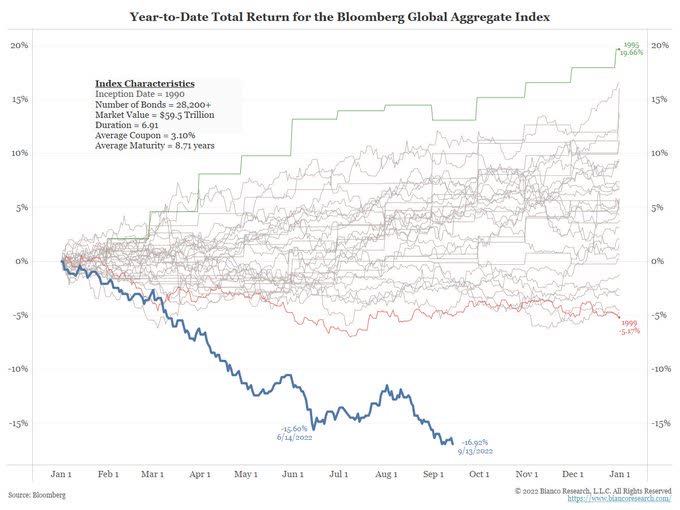
The 13.5% drawdown of the U.S. Aggregate bond index is the worst drawdown of (at least) the past 50 years.
Even during the 1980s, when inflation was higher than today (and Fed Funds were way-way higher than today), bonds haven’t suffered such a big drawdown as they do this year.
Bianco Research LLC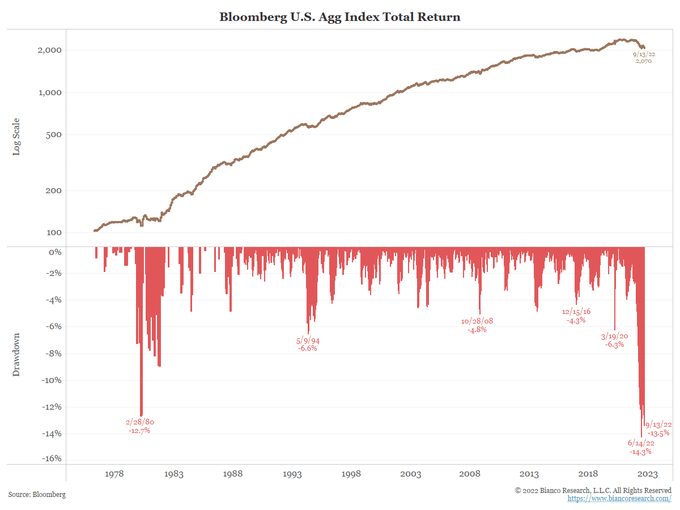
Duration is Key
Allow me to take you back to something that we wrote on Jan. 24, 2020, even before COVID has become a major global issue:
What should be absolutely clear to anyone holding medium-long duration bonds right now is that you’re sticking to assets that under the best-case scenario will deliver very little gains, and under a worst-case scenario would be looking as bad as a major stock (SPY, DIA, QQQ, IWM) correction looks like!
Here are the total returns of various U.S. Treasury Bond ETFs since their peak in early December 2021:
Y-Charts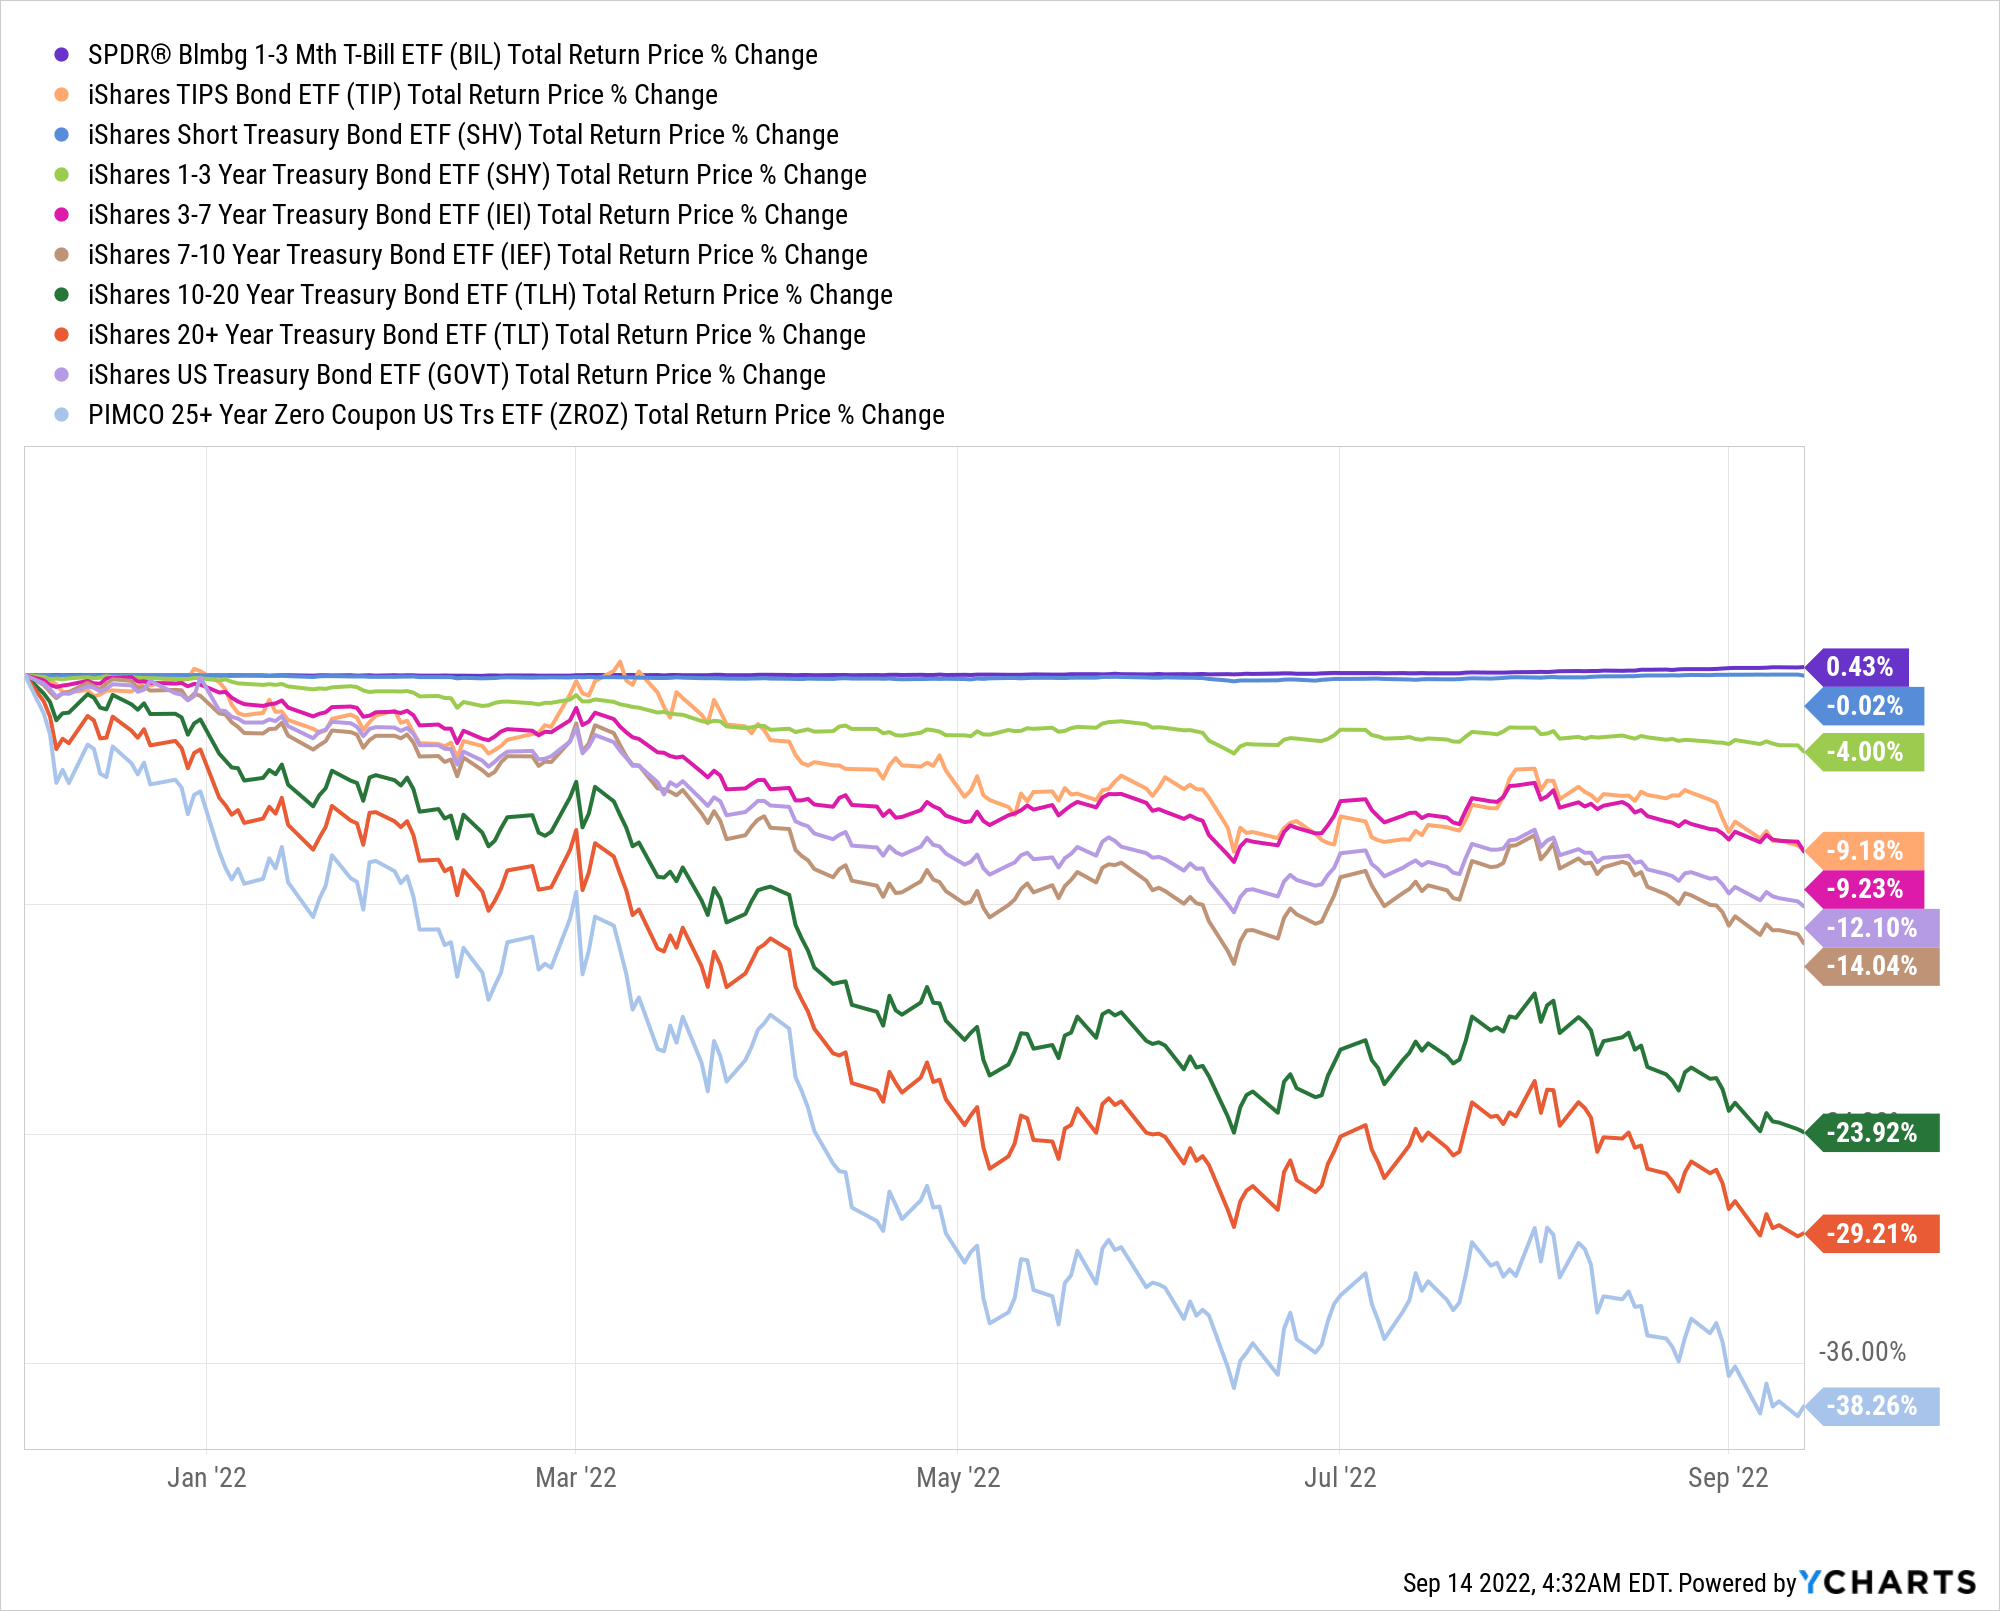
As you can see, the longer the duration – the bigger the decline.
- Short-duration ETFs* have managed to stay fairly close to (=up to 5% below) the flatline.
- Medium-duration ETFs** have lost around 10%-15%, in line with the ~13% loss of the iShares US Treasury Bond ETF (GOVT) benchmark.
- Long-duration ETFs*** have lost at least a quarter of their value, but sometimes twice as much!
*SPDR® Blmbg 1-3 Mth T-Bill ETF (BIL), iShares Short Treasury Bond ETF (SHV), iShares 1-3 Year Treasury Bond ETF (SHY)
**iShares TIPS Bond ETF (TIP), iShares 3-7 Year Treasury Bond ETF (IEI), iShares 7-10 Year Treasury Bond ETF (IEF)
***iShares 10-20 Year Treasury Bond ETF (TLH), iShares 20+ Year Treasury Bond ETF (NASDAQ:NASDAQ:TLT), PIMCO 25+ Year Zero Coupon US Trs ETF (NYSEARCA:NYSEARCA:ZROZ)
Y-Charts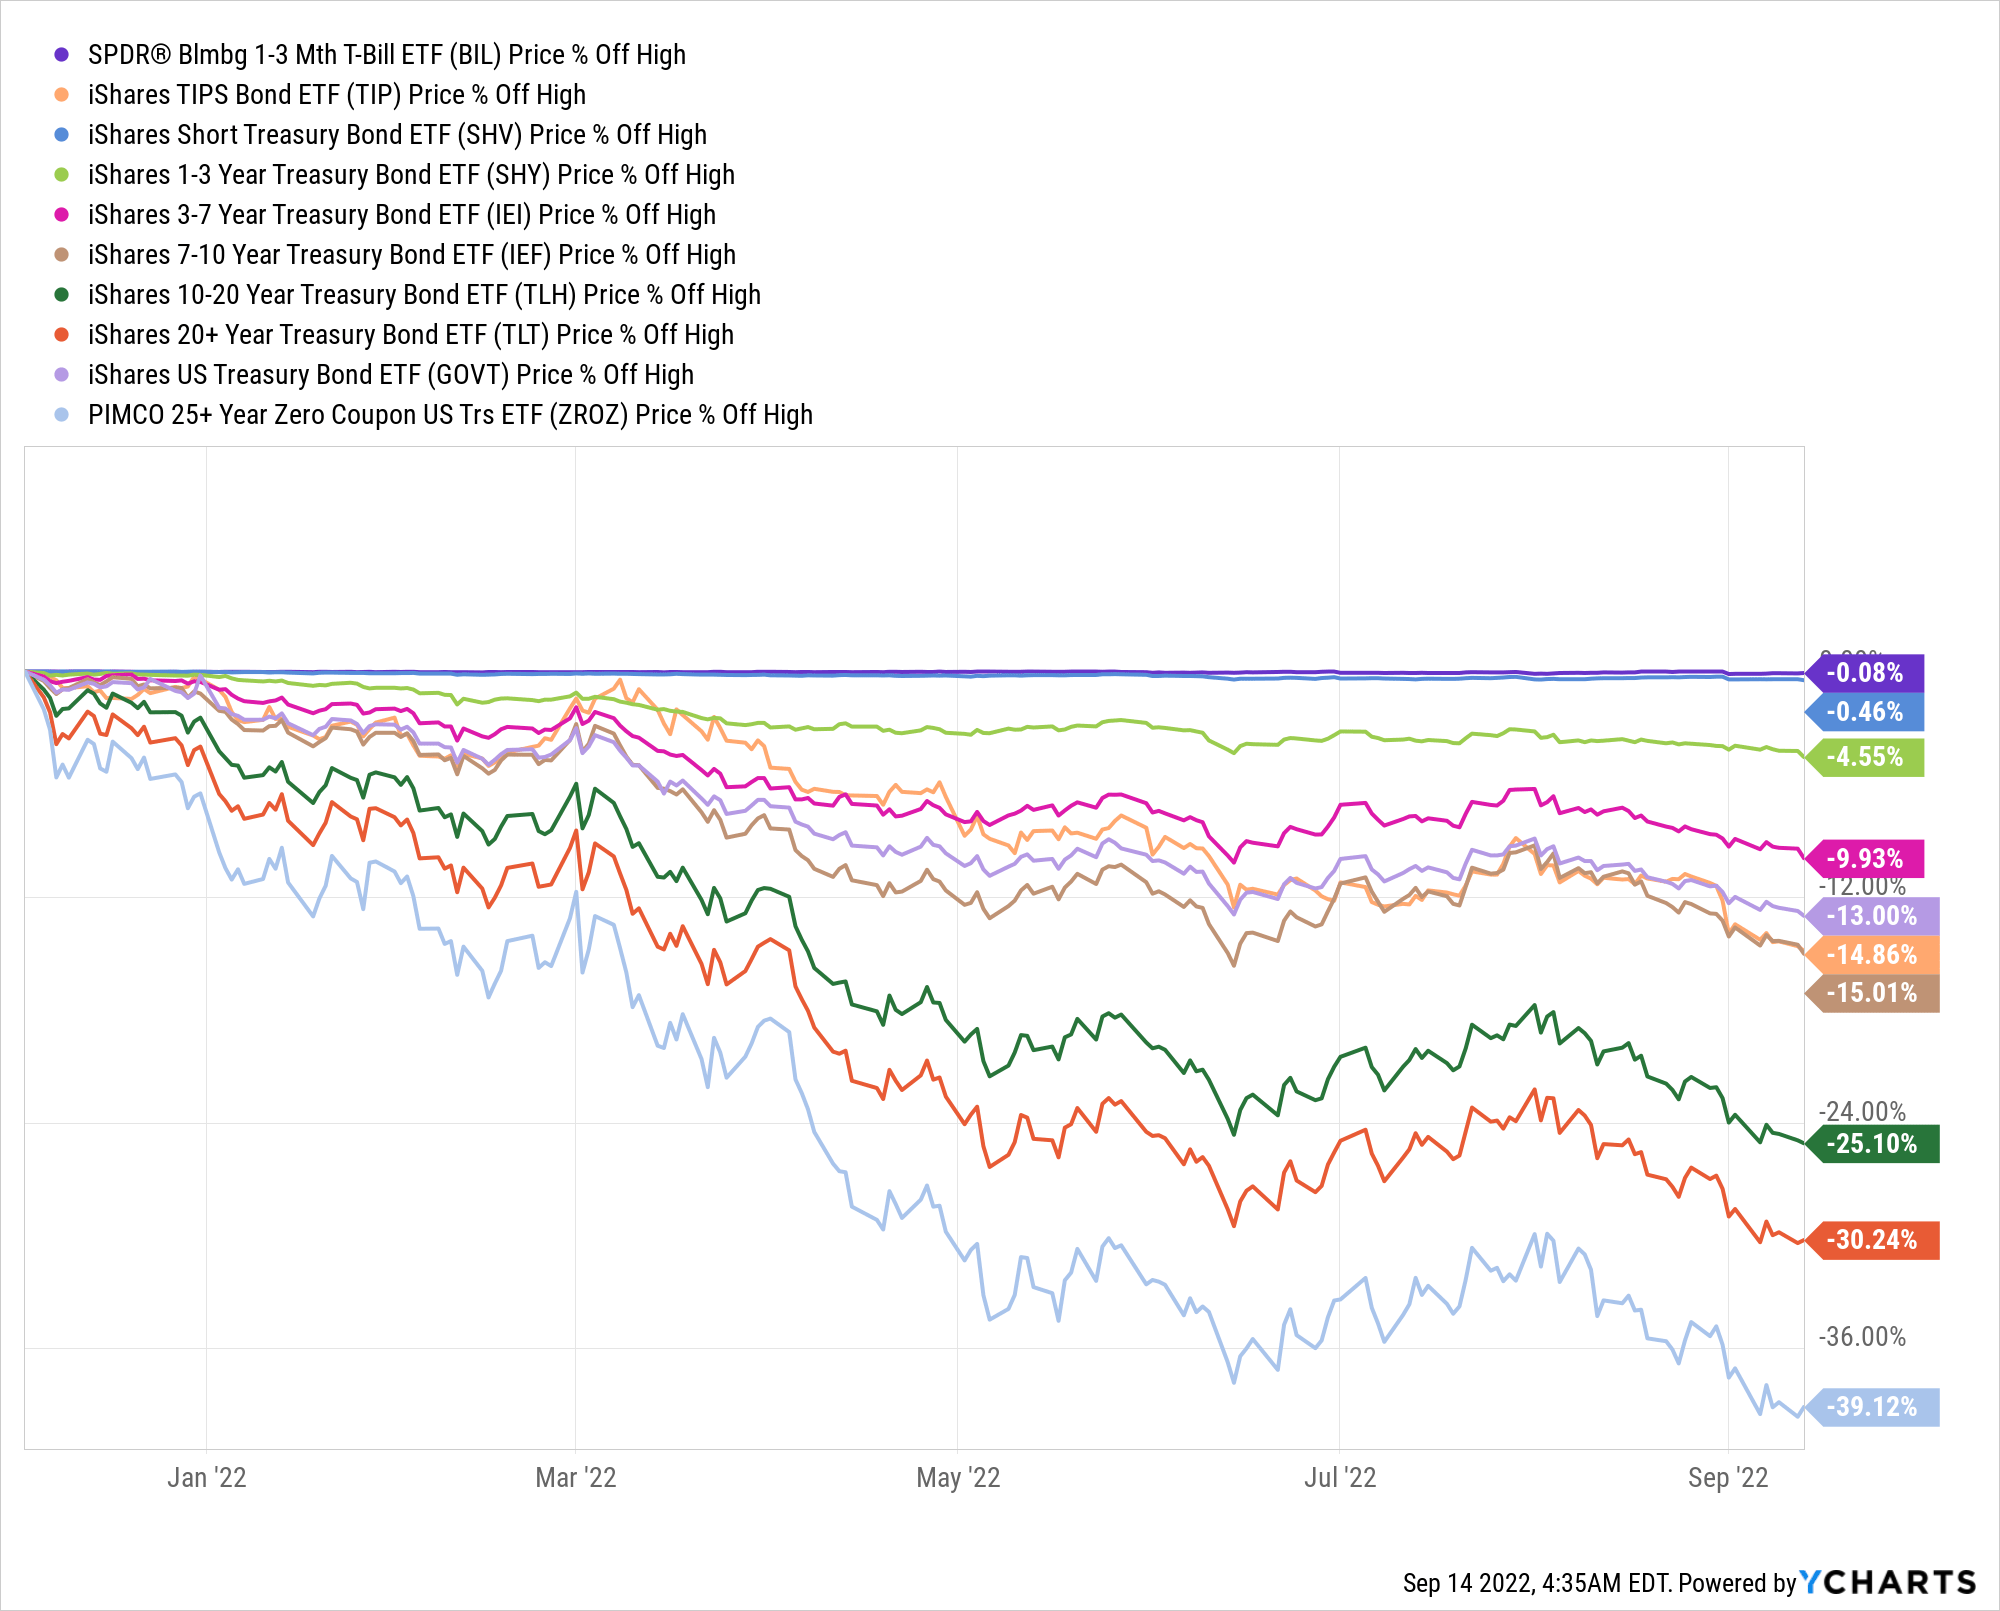
Long/est Duration = Loud/est Reaction
In order to better understand the duration effect, let’s compare the longest-duration (TLT, ZROZ) with the shortest-duration (BIL, SHV) US Treasury bond ETFs.
Looking at the below chart (stretched to ZROZ’s inception date), we can draw various conclusions:
- Time = Money. Longer duration delivers better total returns over time.
- Tenor = Volatility. The longer the duration – the larger the volatility.
- Higher yields are harmful, just as lower yields are helpful.
- The longer the duration – the bigger the drawdown.
- Next time we warn about duration – listen to us!
Y-Charts, Author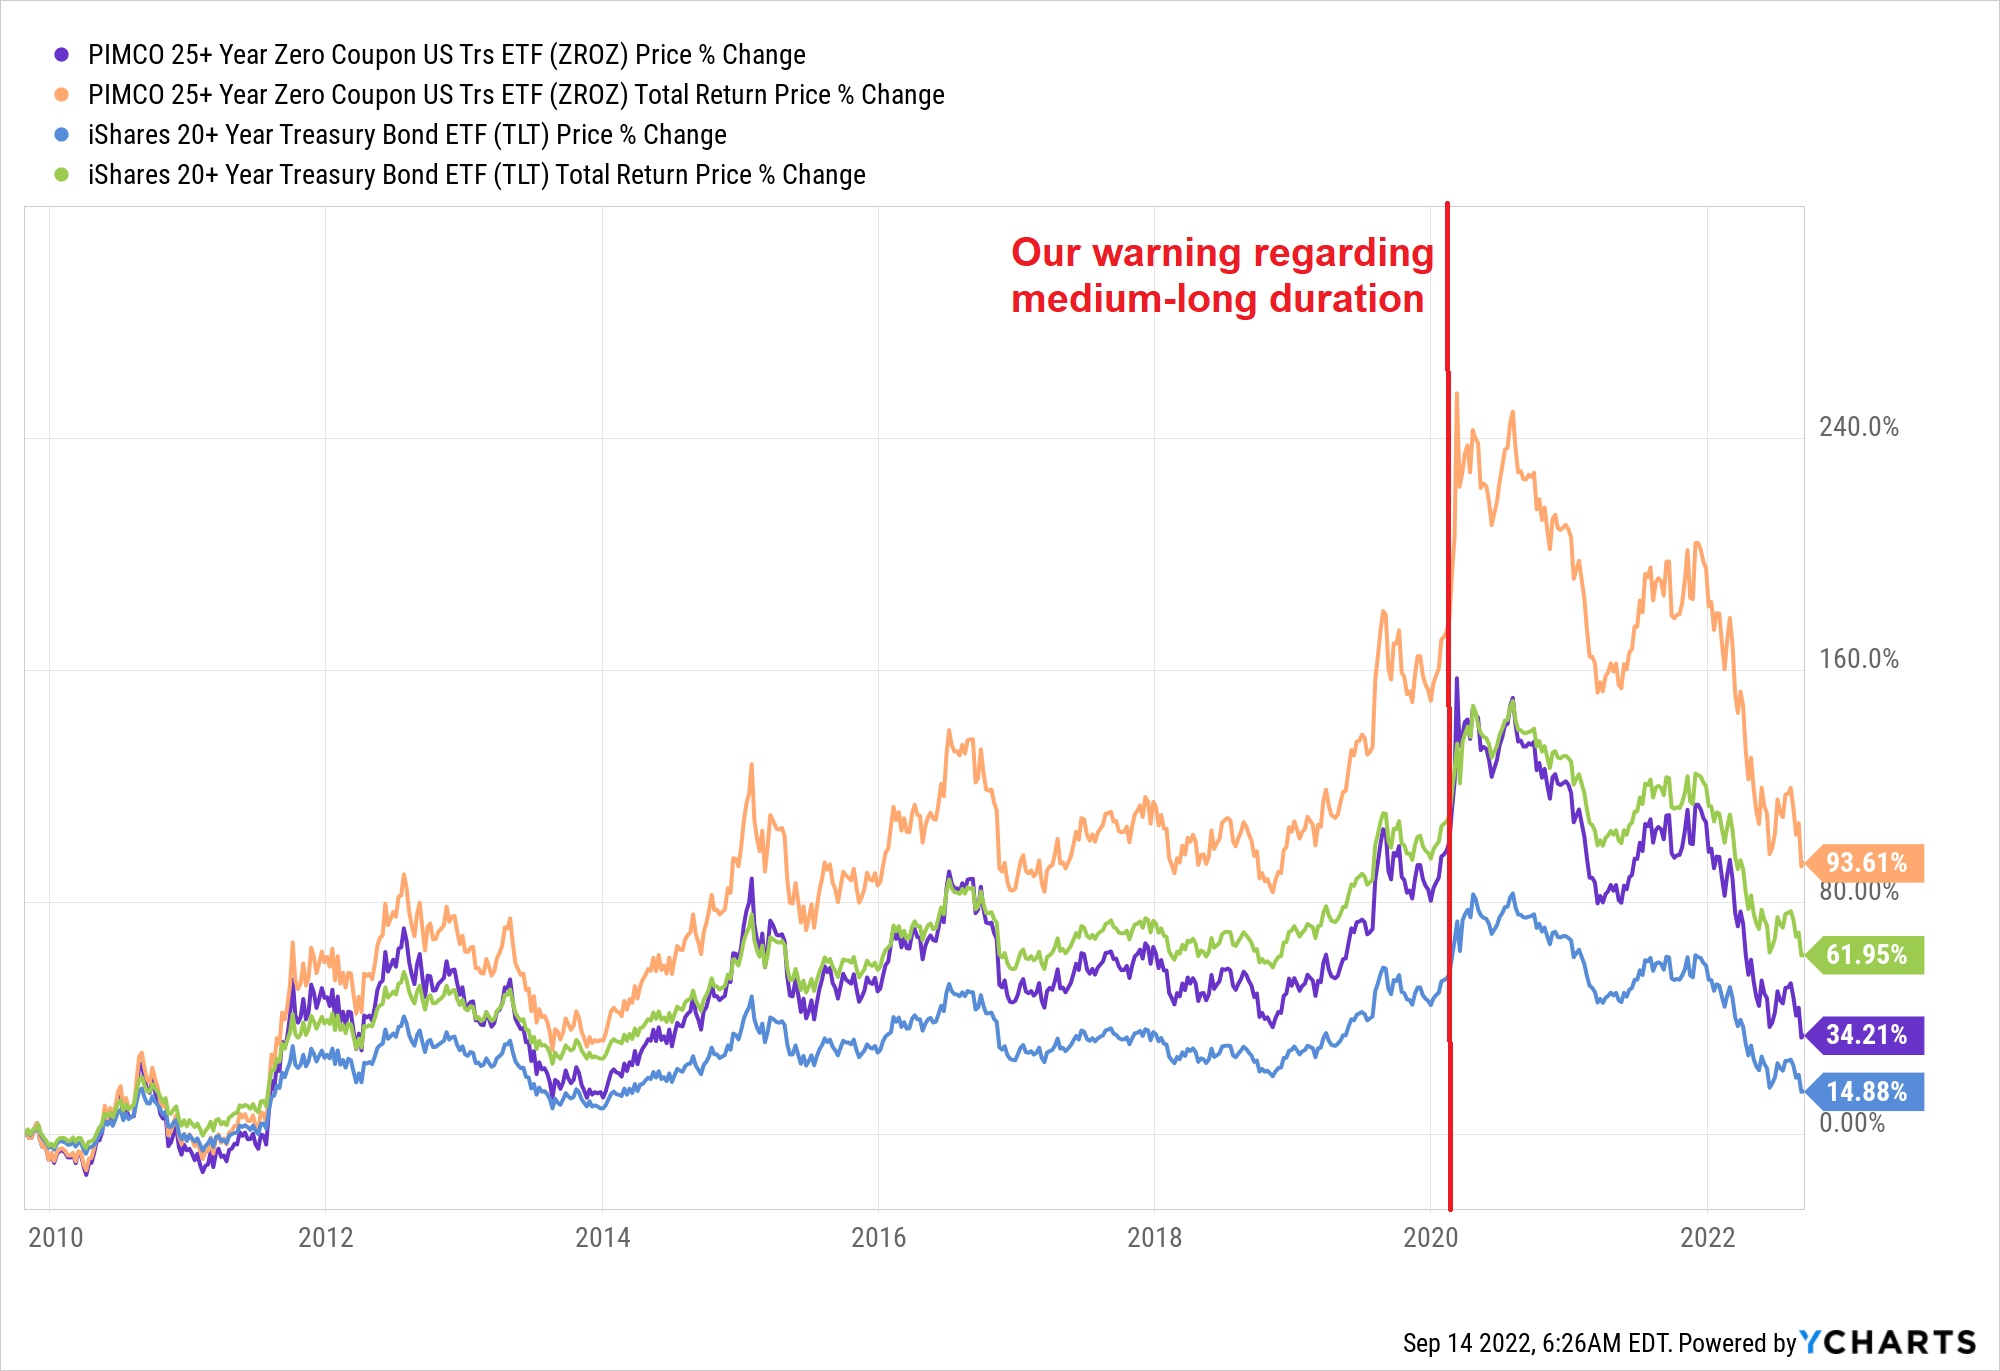
Nonetheless, one thing should also be clear: Long-duration ETFs will always be either the best or the worst holding, depending on the monetary policy (thus, direction of nominal yields) we live in.
- Dovish Fed >>> Easing monetary policy >>> Lower yields >>> Long-duration ETFs flourish.
- Hawkish Fed >>> Tightening monetary policy >>> Higher yields >>> Long-duration ETFs wither.
Y-Charts, Author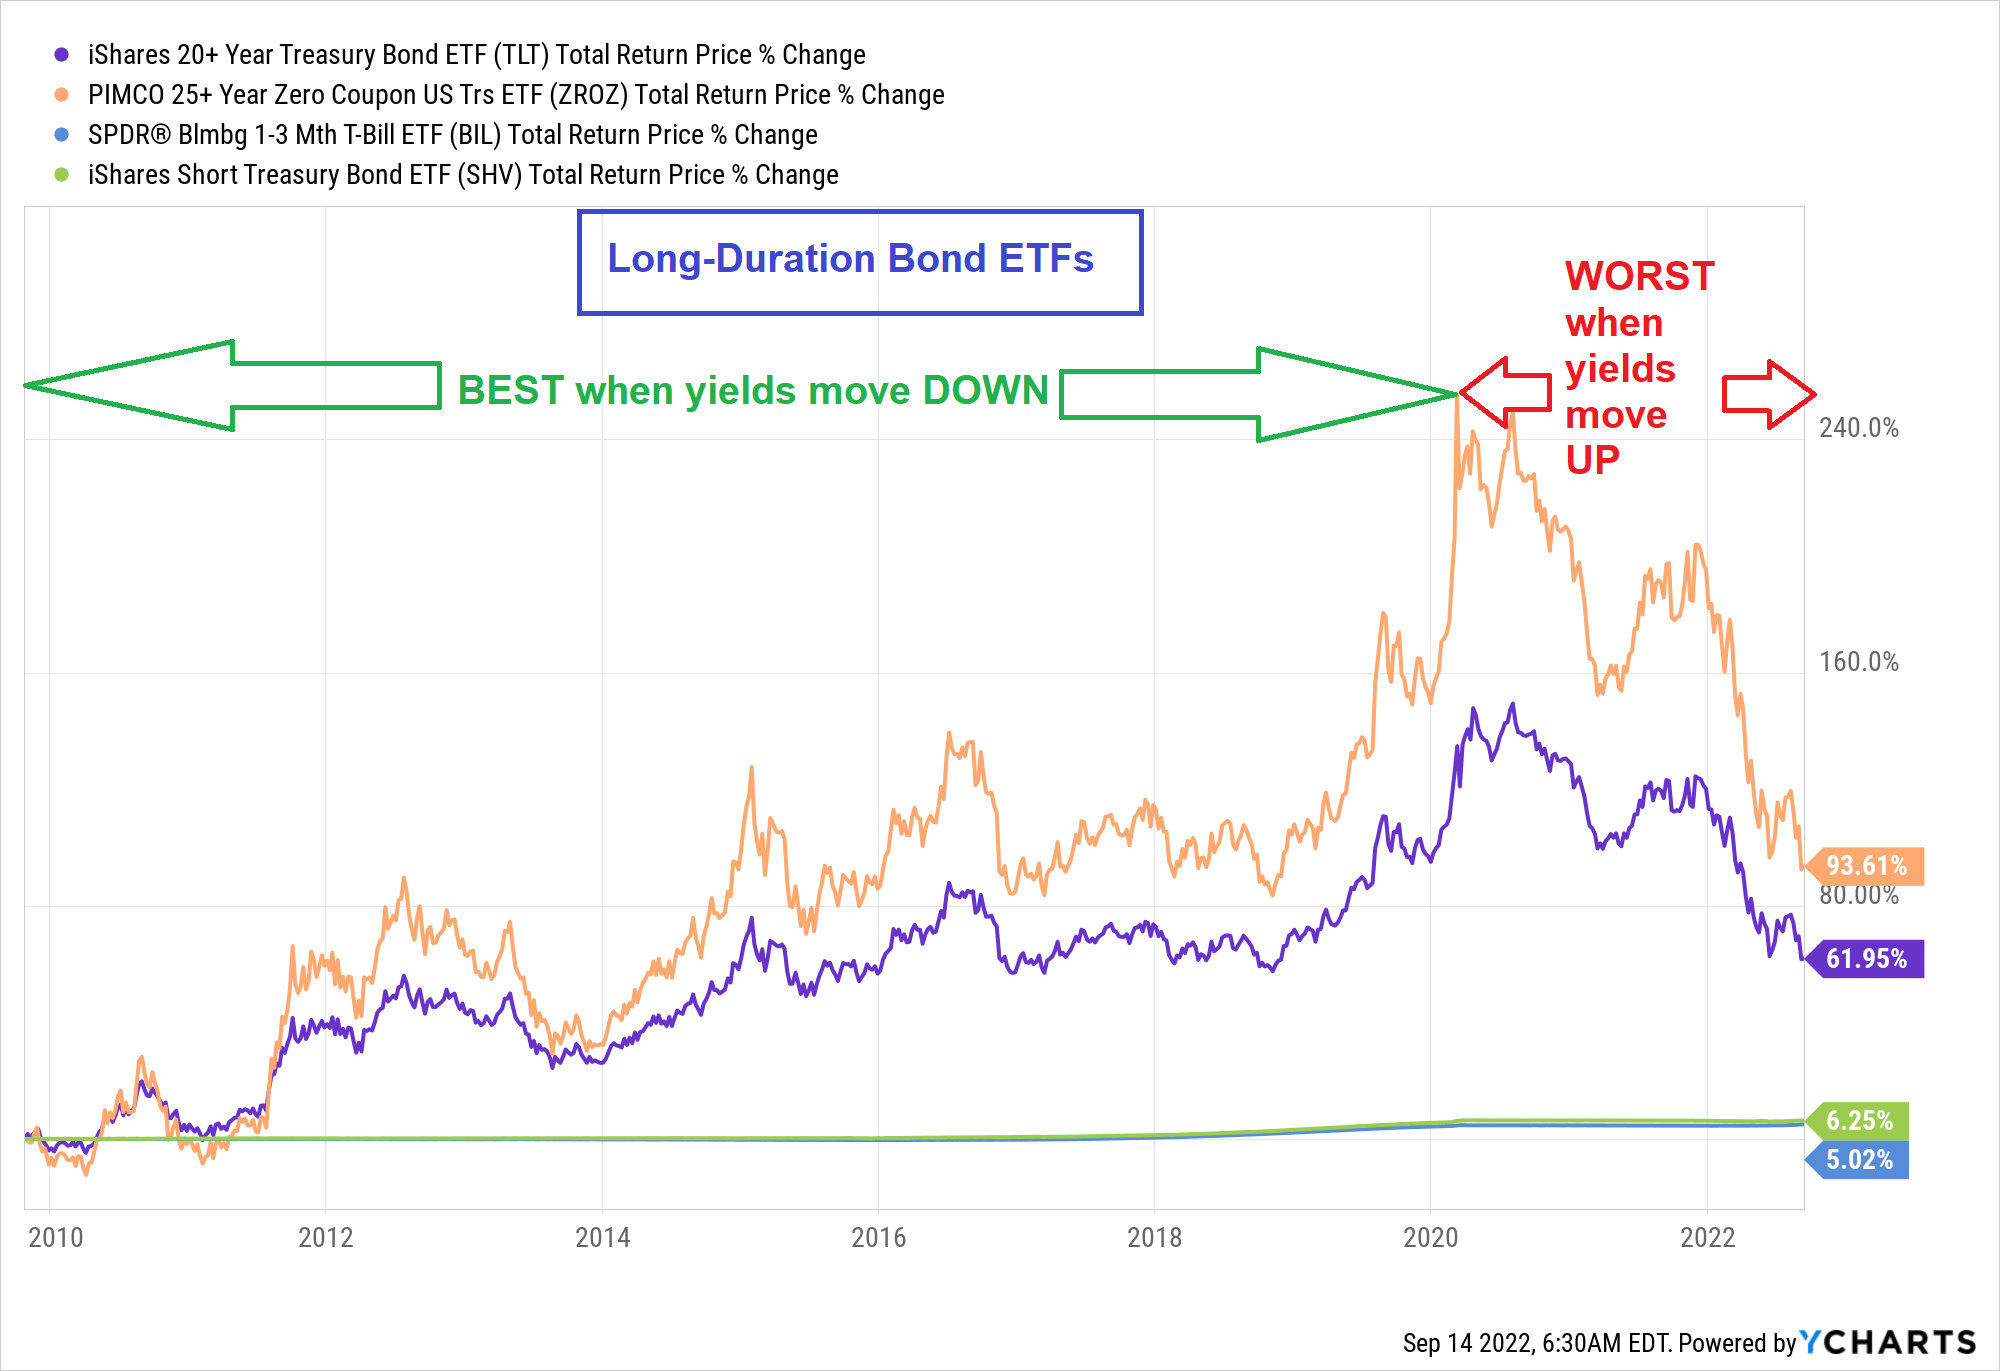
The Power (Powell) of Love (Duration)
First of all, let’s compare the two long-duration ETFs we focus on in this article: TLT and ZROZ.
The 3 most important things we’d like to draw your attention to are:
- The smaller the coupon – the lower the difference between the duration to the average maturity.
- The shorter the duration – the lower the volatility (Standard Deviation)
- It’s not the average time to maturity you should focus on but the duration.
| TLT | ZROZ | |
| Manager | Blackrock | PIMCO |
| Effective Duration | 17.86 yrs | 26.36 yrs |
| Number of Holdings | 33 | 23 |
| 30 Day SEC Yield | 3.47% | 2.92% |
| Standard Deviation (3y) | 13.37% | 18.86% |
| Weighted Average Coupon | 2.41% | 0.01% |
| Average Yield to Maturity | 3.68% | 3.54% |
| Weighted Average Maturity | 25.71 yrs | 27.30 yrs |
| Gross Expense Ratio | 0.15% | 0.15% |
Note that the two ETFs are offering a similar profile except for duration (TLT is significantly shorter than ZROZ) and coupon (TLT is significantly higher than ZROZ). Thing is, one (coupon) is affecting the other (duration) so essentially duration (+coupon) is the key difference between the two ETFs.
How important this is?
As you can see, there’s no (or hardly any) point in time where the drawdown of ZROZ was smaller than that of TLT.
By definition, the longer duration ETF will always suffer from greater drawdowns.
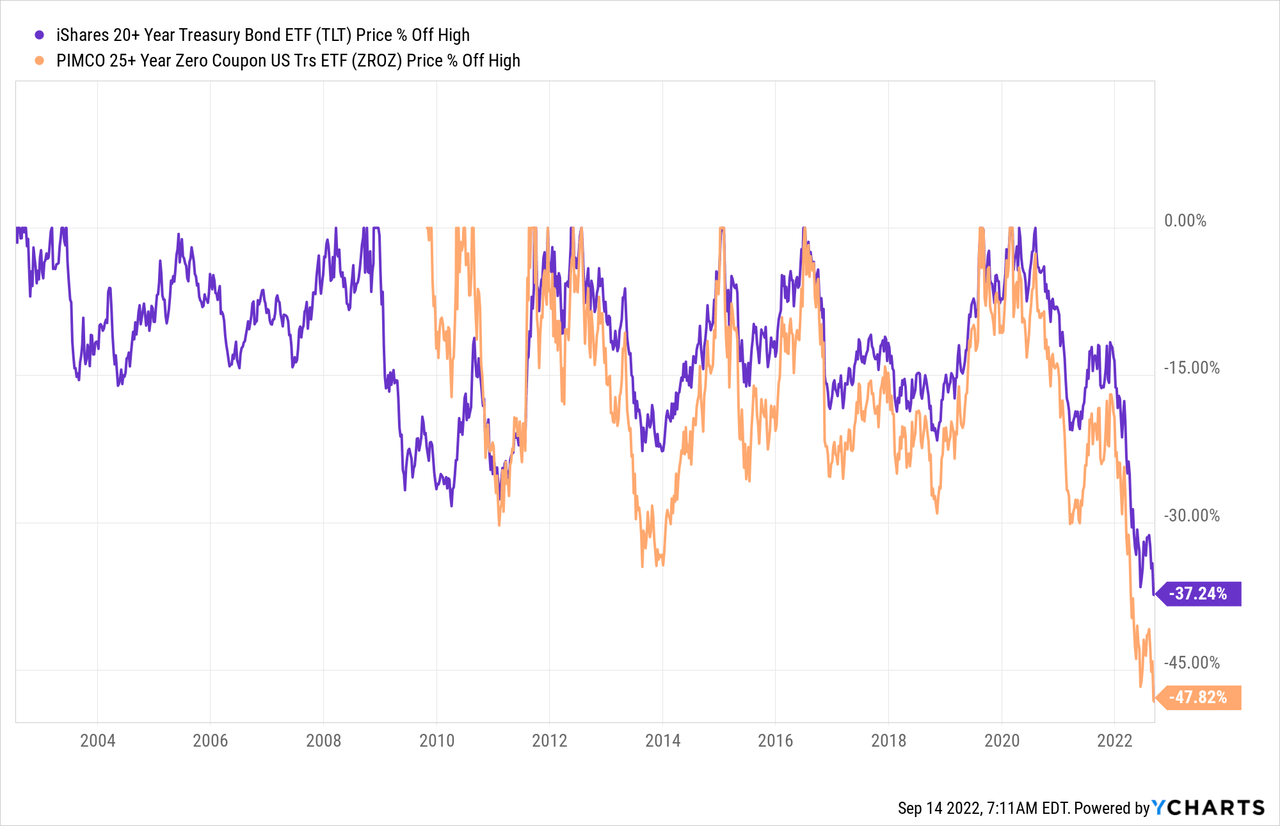
On the other hand, the longer duration ETF will always deliver higher returns during times of easing (monetary policy) and lower yields.
Point is, one should be very careful choosing the right instrument at the right time.
Easier said than done, of course, but when it comes to bonds – it’s almost a scientific task compared to a sentiment-based decision when it comes to stocks.
Yields vs Yield-Curve
Yesterday, before the inflation figures came out, we wrote an article where we explained that investors must differentiate between (nominal) yields to yield-curve (inversion).
Yields move up or down mostly due to inflation (expectations) and monetary policy (tightening/easing). The economy can be bad, but if there’s a high inflation and/or if the Fed is hawkish – yields will go up, catching up with the 2 P’s: Prices and Powell.
Yield-curve, on the other hand, is a reflection of the economy. The worse the economy – the less steep the curve is. And in the case of a possible upcoming recession – the yield-curve tends to invert.
We finished that article with the following words:
We strongly suggest investors trust bonds (credit markets) more than they rely on stocks (equity markets). The latter are making more noise, but the former are paving the way.
Don’t ask where yields “should be” based on the economy rather where the economy is (likely) heading based on yields, or even better: Yield-curve.
Guess what happened following the higher-than-expected inflation figures?
1) Yields went up
That goes to both nominal yields as well as real yields.
2-year US Treasury yield reached the highest level in 15 years.
Bloomberg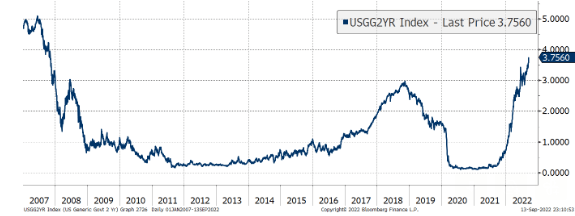
10-year U.S. Treasury real yield is closing fast on the highest level in 11 years.
Bloomberg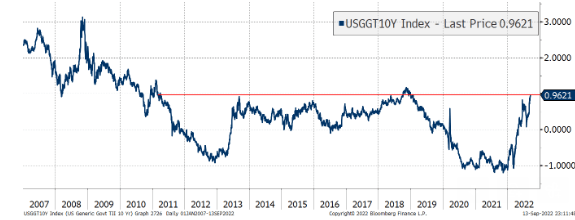
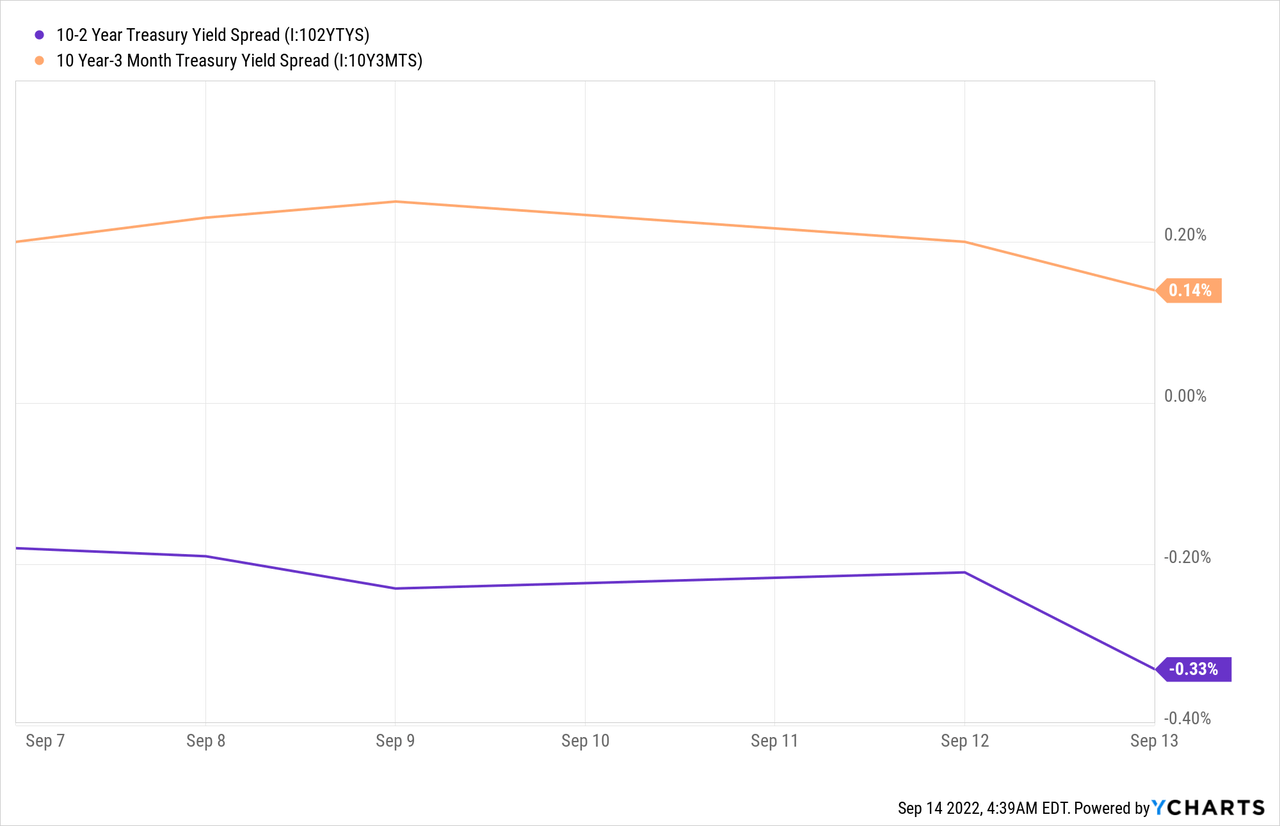
And while yields soared, the yield-curve got more inverted than it was prior to the data.
10-2 Year U.S. Treasury Yield Spread fell 12bps, reaching 33bps below the inversion line.
10 Year-3 Month U.S. Treasury Yield Spread fell 6 bps, now only 14bps away from inverting too.
Bottom Line
Slowly but surely investors are pricing a very hawkish (and determined) Fed as well as a worsening economy, and a possible recession.
At the moment, per the market, a 75bps rate hike in the next FOMC rate decision (one week from today) is guaranteed (100% certainly) with a 1/3 probability for a full percentage point hike.
Bloomberg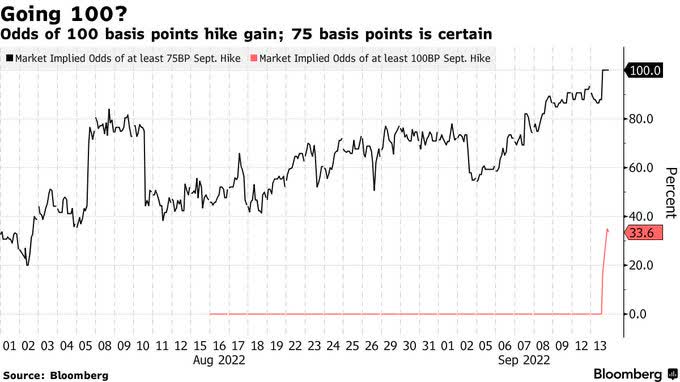
Personally, I doubt Powell & Co. will hike by 1%, in order to avoid panic. Nonetheless, when probability reaches 70% (or more), the Fed tends to deliver in-line with market expectations, so if in a week time probability for a 100bps hike is >=70% – we might be due for the biggest hike ever since the Fed started using Fed Funds as its main tool (in the early 1990s).
Remember: Duration is key, and when you choose a bond ETF – duration must be a top consideration in finding the most appropriate instrument to the existing (and expected) financial conditions.
Be the first to comment