

Petr Kahanek/iStock via Getty Images
I wrote in May an article on YYY. This one revisits this ETF with updated data and confirms my sell rating.
YYY strategy and portfolio
Amplify High Income ETF (NYSEARCA:YYY) is a fund of closed-end funds tracking the ISE High Income Index since 6/21/2013. Amplify ETFs website describes the underlying index as a selection of CEFs based on yield, discount to net asset value, and liquidity. With monthly distributions and a 30-day SEC yield of 10.25%, YYY is a clearly targeted at income-seeking investors. The total expense ratio is 2.26%: 0.50% in ETF management fees, plus 1.76% in held funds’ expenses.
YYY holds closed-end funds representing a variety of asset classes, strategies and asset management companies. Eligible funds must be listed in the U.S., have a market capitalization of at least $500 million and an average daily trading value of at least $1 million. They are ranked and selected using 3 factors: yield, discount to NAV and liquidity. Constituents are weighted based on their ranks, with some adjustments. The index is reconstituted twice a year, in January and July.
The fund has changed names in 2019, but it has kept the same ticker and methodology. In July 2021, it changed methodologies. The most notable modifications are an increase in the number of holdings to 45, a constituent weight capped at 3%, and a semi-annual reconstitution.
The top 10 holdings, listed below, represent 30.4% of asset value. As of writing, the heaviest position weighs 3.35%.
|
Ticker |
Name |
Weight% |
Yield% |
|
Liberty All-Star Equity Fund |
3.35 |
9.63 |
|
|
PIMCO Dynamic Income Fund |
3.28 |
13.53 |
|
|
BlackRock Credit Allocation Income Trust |
3.01 |
9.55 |
|
|
Brookfield Real Assets Income Fund, Inc. |
3.01 |
13.56 |
|
|
PIMCO Dynamic Income Opportunities Fund |
2.99 |
11.01 |
|
|
PIMCO Access Income Fund |
2.97 |
11.66 |
|
|
Cohen & Steers Tax-Advantaged Preferred Securities & Income Fund |
2.97 |
8.45 |
|
|
Western Asset Emerging Markets Debt Fund |
2.94 |
10.69 |
|
|
Oxford Lane Capital Corp. |
2.94 |
17.41 |
|
|
Invesco Senior Income Trust |
2.93 |
9.95 |
Closed-end funds are often chosen by investors for their distribution yield. They also have a few metrics that are not applicable to stocks and ETFs. Two of them are more important than the yield:
- Discount to NAV (higher is better).
- Relative discount = Discount to NAV minus its 12-month average (higher is better).
The next table compares YYY holdings with the full CEF universe regarding these metrics. Two methods are used: simple average and capital-weighted average. Out of 45 holdings, 36 with available data at my data provider have been taken into account in the calculation.
|
Average discount% |
Average relative discount% |
Capital weighted discount% |
Capital weighted relative discount% |
|
|
Holdings (36) |
6.30 |
1.62 |
6.26 |
1.21 |
|
CEF universe |
7.95 |
2.10 |
7.74 |
2.24 |
Calculation using Portfolio123
By all measures, YYY holdings are below-par relative to the CEF universe.
Past performance
Since inception (6/21/2013), YYY has lagged by a wide margin its main competitor the Invesco CEF Income Composite Portfolio ETF (PCEF), and a 60/40 model portfolio. Moreover, it shows a higher risk measured in drawdown and standard deviation of monthly returns (volatility).
|
Total Return |
Annual.Return |
Drawdown |
Sharpe ratio |
Volatility |
|
|
YYY |
28.29% |
2.69% |
-44.98% |
0.17 |
13.92% |
|
PCEF |
53.51% |
4.67% |
-41.41% |
0.35 |
12.35% |
|
60% SPY 40% BND |
106.92% |
8.04% |
-21.80% |
0.76 |
9.54% |
Data calculated with Portfolio123
A 60/40 portfolio may not be a good benchmark here. I suggest a better one. The next table compares YYY since inception with a subset of the closed-end fund universe of comparable size: the 50 CEFs with the higher yields among those with average liquidity above $100’000 per day and a positive discount to NAV (net asset value). The subset is reconstituted twice a year in equal weights.
|
Total Return |
Annual.Return |
Drawdown |
Sharpe ratio |
Volatility |
|
|
YYY |
28.29% |
2.69% |
-44.98% |
0.17 |
13.92% |
|
Reference subset |
68.59% |
5.71% |
-50.20% |
0.34 |
17.36% |
Past performance is not a guarantee of future returns. Data Source: Portfolio123
YYY underperforms this benchmark in annualized return and in risk-adjusted performance (Sharpe ratio).
In 2022 to date, YYY also lags PCEF and equity and bond benchmarks (SPY, BND).
YYY vs PCEF, SPY, BND (Portfolio123)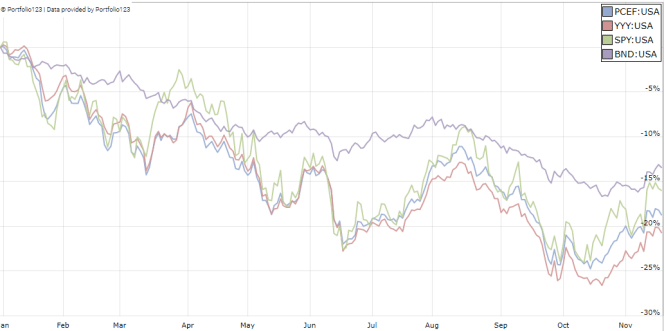
The annualized return reinvesting all distributions, without paying any tax on them, is far below the distribution rate and its historical average (which is over 8%). It means YYY has paid a high yield while the principal has suffered a decay. The share price has lost about 40% since inception:
YYY share price (TradingView on Seeking Alpha)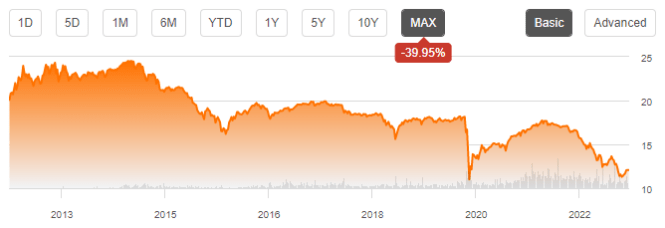
The monthly distribution averaged $0.19 per share in 2013, it is $0.12 in 2022.
|
year |
2013 |
2014 |
2015 |
2016 |
2017 |
2018 |
2019 |
2020 |
2021 |
2022 |
|
avg monthly distribution |
$0.19 |
$0.17 |
$0.16 |
$0.16 |
$0.13 |
$0.13 |
$0.14 |
$0.13 |
$0.13 |
$0.12 |
Calculation with data from Amplify ETFs
Besides losing about 40% in capital (share price), YYY has also lost about 37% in distribution, before accounting for taxes and inflation.
The period from 2013 to 2020 was a low-rate, low-inflation environment. Higher rates are likely to result in higher leveraging costs for closed-end funds, and share price might decrease faster. It might accelerate the decay in capital and income stream in nominal value, and even more in inflation-adjusted value.
YYY may be a useful instrument for tactical allocation, swing trading or capturing some market anomalies, but it doesn’t look like a good buy-and-hold investment for people seeking a sustainable income and capital preservation. This is true for a number of high-yield instruments, not only YYY.
Bonus: a solution to avoid capital decay in CEFs
Capital and income decay is an issue in many closed-end funds, and more generally in many high-yield investments. However, it can be avoided or mitigated by rotational strategies, instead of using CEFs as buy-and-hold instruments. I designed a 5-factor ranking system in 2016, and monitored its performance during 5 years. I started publishing the eight best ranked CEFs in Quantitative Risk & Value (QRV) after the March 2020 market meltdown. The list is updated every week. Its average dividend yield varies around 7-8%. It’s not a model portfolio: trading the list every week is too costly in spreads and slippage. Its purpose is helping income investors find funds with a good entry point. In the table and chart below, I give the hypothetical example of starting a portfolio on 3/25/2020 with my initial “Best 8 Ranked CEFs” list and updating it every three months since then, ignoring intermediate updates. Return is calculated using closing prices, with holdings in equal weights on rebalancing days. Dividends are reinvested at the beginning of every three-month period.
|
Since 3/25/2020 |
Total Return |
Annual Return |
Drawdown |
Sharpe ratio |
Volatility |
|
Best 8 CEFs quarterly |
130.30% |
37.08% |
-20.60% |
1.52 |
20.50% |
|
SPY |
67.62% |
21.57% |
-24.50% |
0.94 |
19.64% |
This simulation is not a real portfolio and not a guarantee of future return ( Chart: author: data: Portfolio123)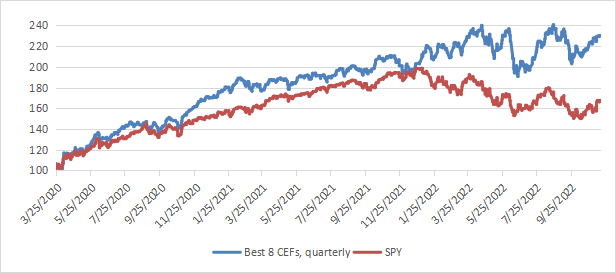
The usual disclaimer says that past performance (real or simulated) is not representative of future return. The “Best 8” list is unlikely to perform as well in the near future as since March 2020. The 2020 meltdown resulted in price dislocation and exceptional opportunities in the CEF universe. The 2022 downturn also was a source of opportunities in energy and infrastructure funds. It is unlikely to happen again soon. However, I think a time-tested rotational strategy in CEFs has a much better chance to protect both capital and income stream against erosion and inflation than any high-yield passive investment like YYY. Dates and lists can be checked in QRV post history.
Be the first to comment