

Larry Crain
Investing in this market can be, at times, frustrating. At the same time, if you’re right, it can also be incredibly rewarding. The reason why I say that this moment is frustrating is because of the overall pessimism surrounding the market because of high inflation, rising interest rates, and other similar issues. Although this is great for buying stocks on the cheap, the ideal thing would be to see those shares appreciate shortly thereafter. But to see pessimism continue to push shares down can be depressing, even if you believe that you are correct in your thesis. One company that has been hammered particularly hard lately is Lazydays Holdings (NASDAQ:LAZY). This firm, which operates a chain of RV dealerships, has not been looked at kindly by investors lately. In addition to the aforementioned concerns that investors have, it’s also true that the company shot down an opportunity to sell itself at a price that is quite a bit higher than where shares are today. Having said that, I do believe that the company still has attractive upside potential, even if financial performance shows signs of weakening. And as such, I have decided to retain my ‘buy’ rating on the company for now.
Cruising with Lazydays Holdings
The last time I wrote an article about Lazydays Holdings was in the middle of April of this year. I acknowledged the company’s recent financial performance as strong demand for RVs sent revenue and profitability for the company rising. I also said that shares were looking attractively priced. But on top of that, the company also had an interesting catalyst involving the potential sale of itself to B. Riley Financial (RILY) at a price of $25 per share. This particular rejection came in March of this year, but there was some optimism that another offer for the enterprise might arise. Since the publication of that article, when I had a ‘buy’ rating assigned to the company, shares have generated a loss for investors of 17.1%. That compares to the 7.4% decline experienced by the S&P 500 over the same timeframe.
Author – SEC EDGAR Data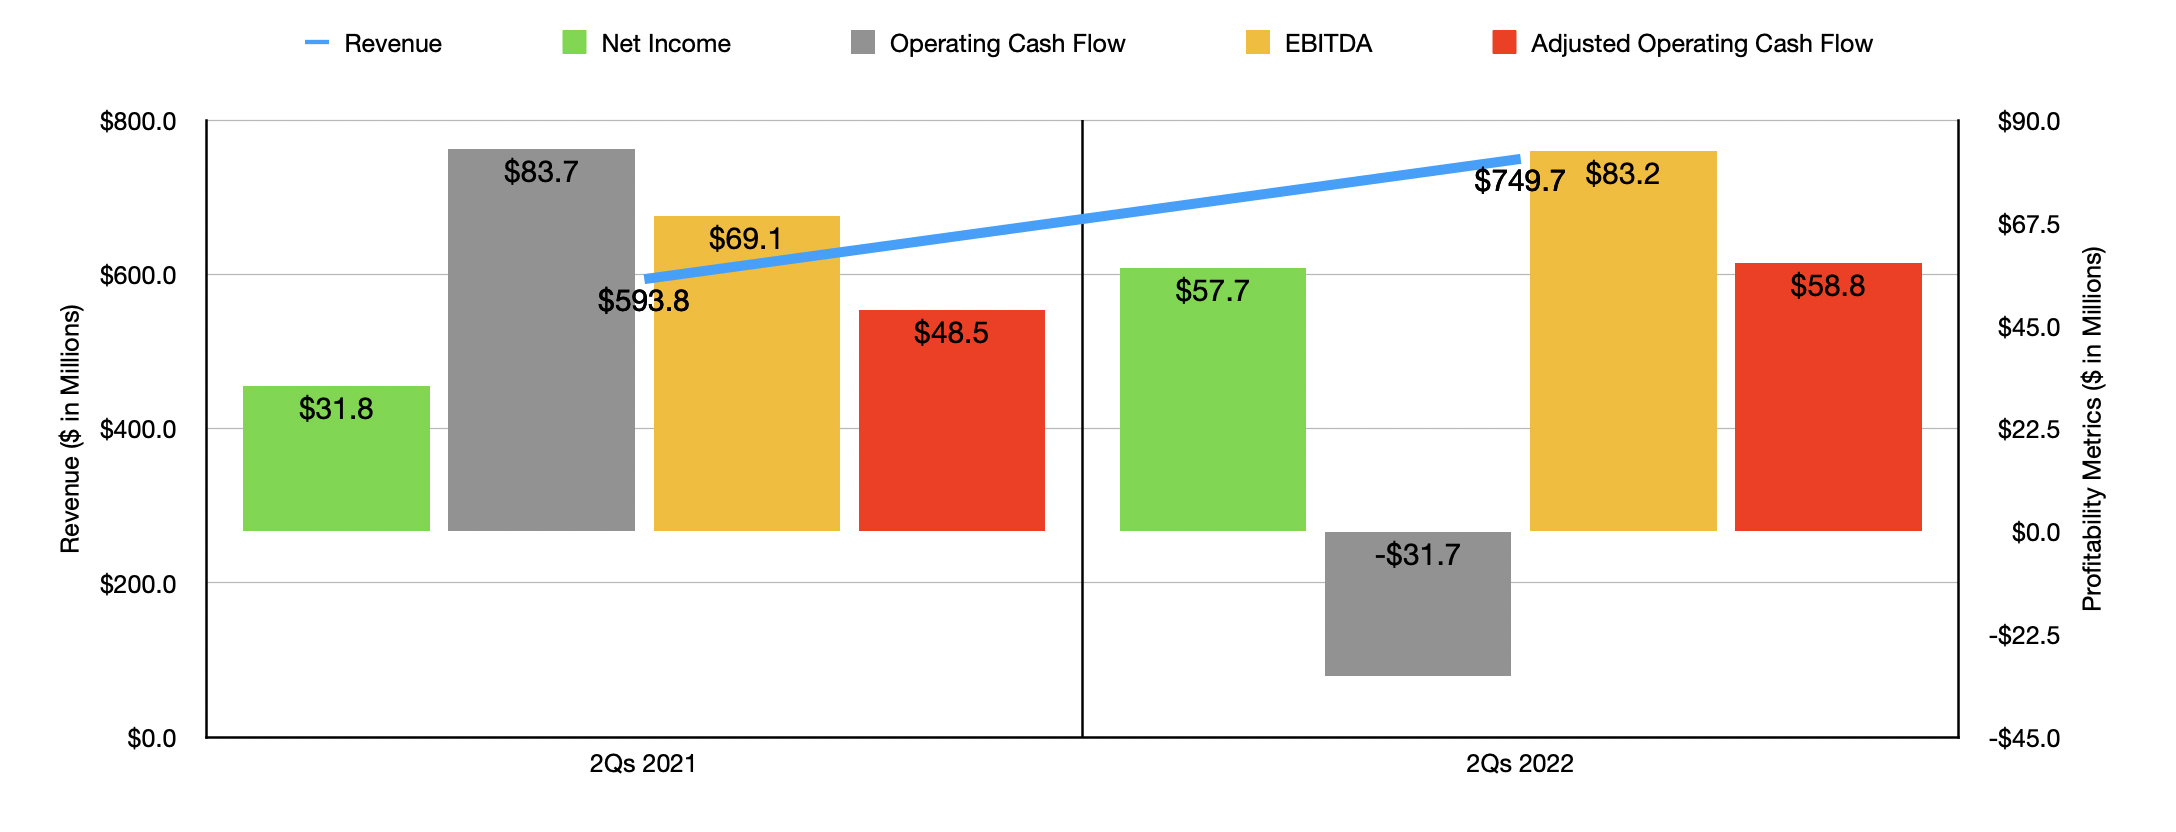
Based on this return disparity, you might initially think that the fundamental performance of the company was suffering. But that couldn’t be further from the truth. Since that article was published, we have had data covering not one but two quarters come out. And the results so far have been impressive. Revenue in the first half of the 2022 fiscal year came in strong at $749.7 million. That’s 26.3% higher than the $593.8 million generated the same time last year. This jump in revenue year over year was driven by strength across the board. New vehicle sales for the company grew by 18.3% during this window of time, with the average selling price of RVs rising by 23.4% from $74,900 to $92,400. This was offset to some degree by a decrease in the number of new units sold from 4,904 to 4,725. Revenue from pre-owned vehicle sales grew by a more impressive 45.2%, driven by the average selling price of these units climbing 18.3% from $63,000 to $74,500, and by an increase in the number of used units sold, excluding the company’s wholesale operations, from 2,501 to 3,075.
Author – SEC EDGAR Data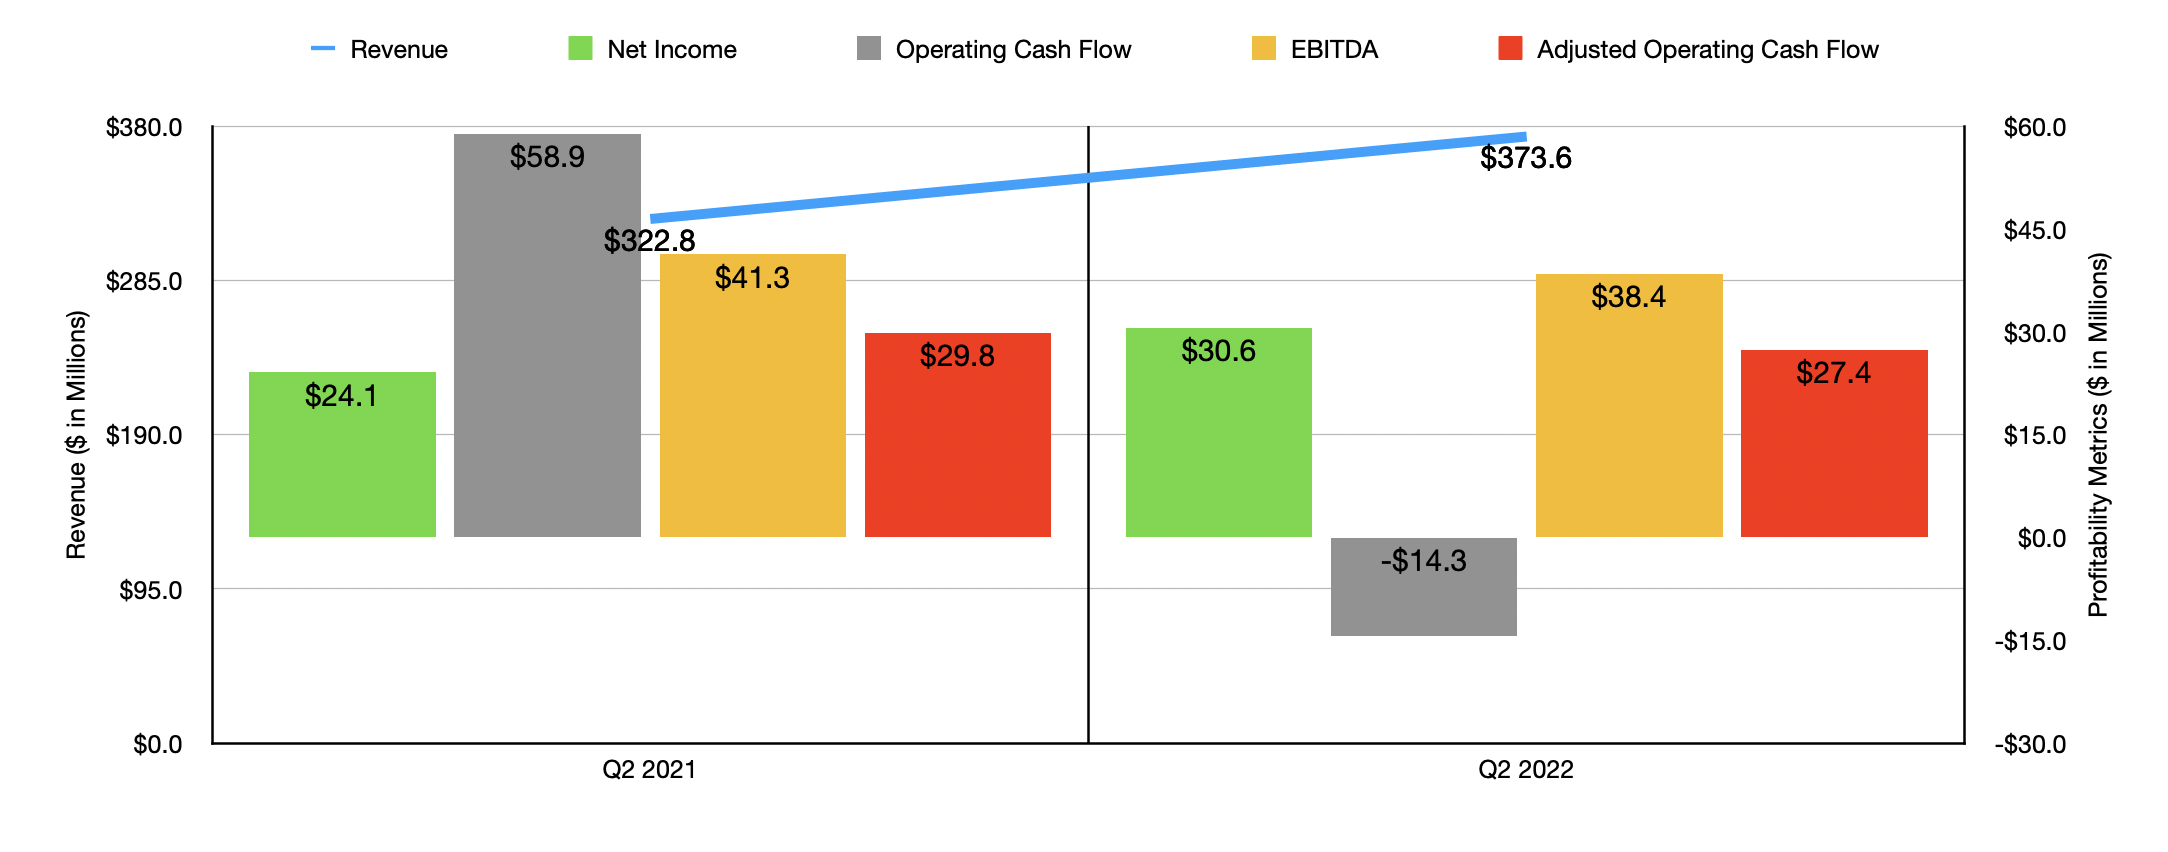
Even in the second quarter alone, sales for the company remained impressive, climbing by 15.7% year over year from $322.8 million to $373.6 million. The average selling price of new vehicles rose from $72,100 to $89,300, with this rise being somewhat offset by dropping units sold from 2,780 to 2,455. Meanwhile, revenue from pre-owned vehicles grew by 33.1% thanks to pricing climbing from $59,400 to $70,400, and as the number of pre-owned vehicles sold increased from 1,428 to 1,597. Clearly, the second quarter was a bit weaker than the first. And some investors might be worried about that trend continuing. But even if financial performance were to revert back to what it was in prior years, shares of the company would still look attractively priced, as you will soon see.
From a profitability perspective, the company also remains strong. In the first half of the year, net income came in at $57.7 million. That’s almost double the $31.8 million generated in the first half of 2021. Operating cash flow did worsen, dropping from $83.7 million to negative $31.7 million. But if we adjust for changes in working capital, the metric would have increased from $48.5 million to $58.8 million. Meanwhile, EBITDA for the company also improved, climbing from $69.1 million to $83.2 million. Unfortunately, not everything is great on this front. In the second quarter alone, results did show some signs of pain. Yes, net income in the second quarter did climb to $30.6 million compared to the $24.1 million reported the same time last year. But operating cash flow dropped from $58.9 million to negative $14.3 million. Even if we adjust for changes in working capital, the metric would have worsened, declining from $29.8 million to $27.4 million. Meanwhile, EBITDA also declined, dropping from $41.3 million to $38.4 million.
Author – SEC EDGAR Data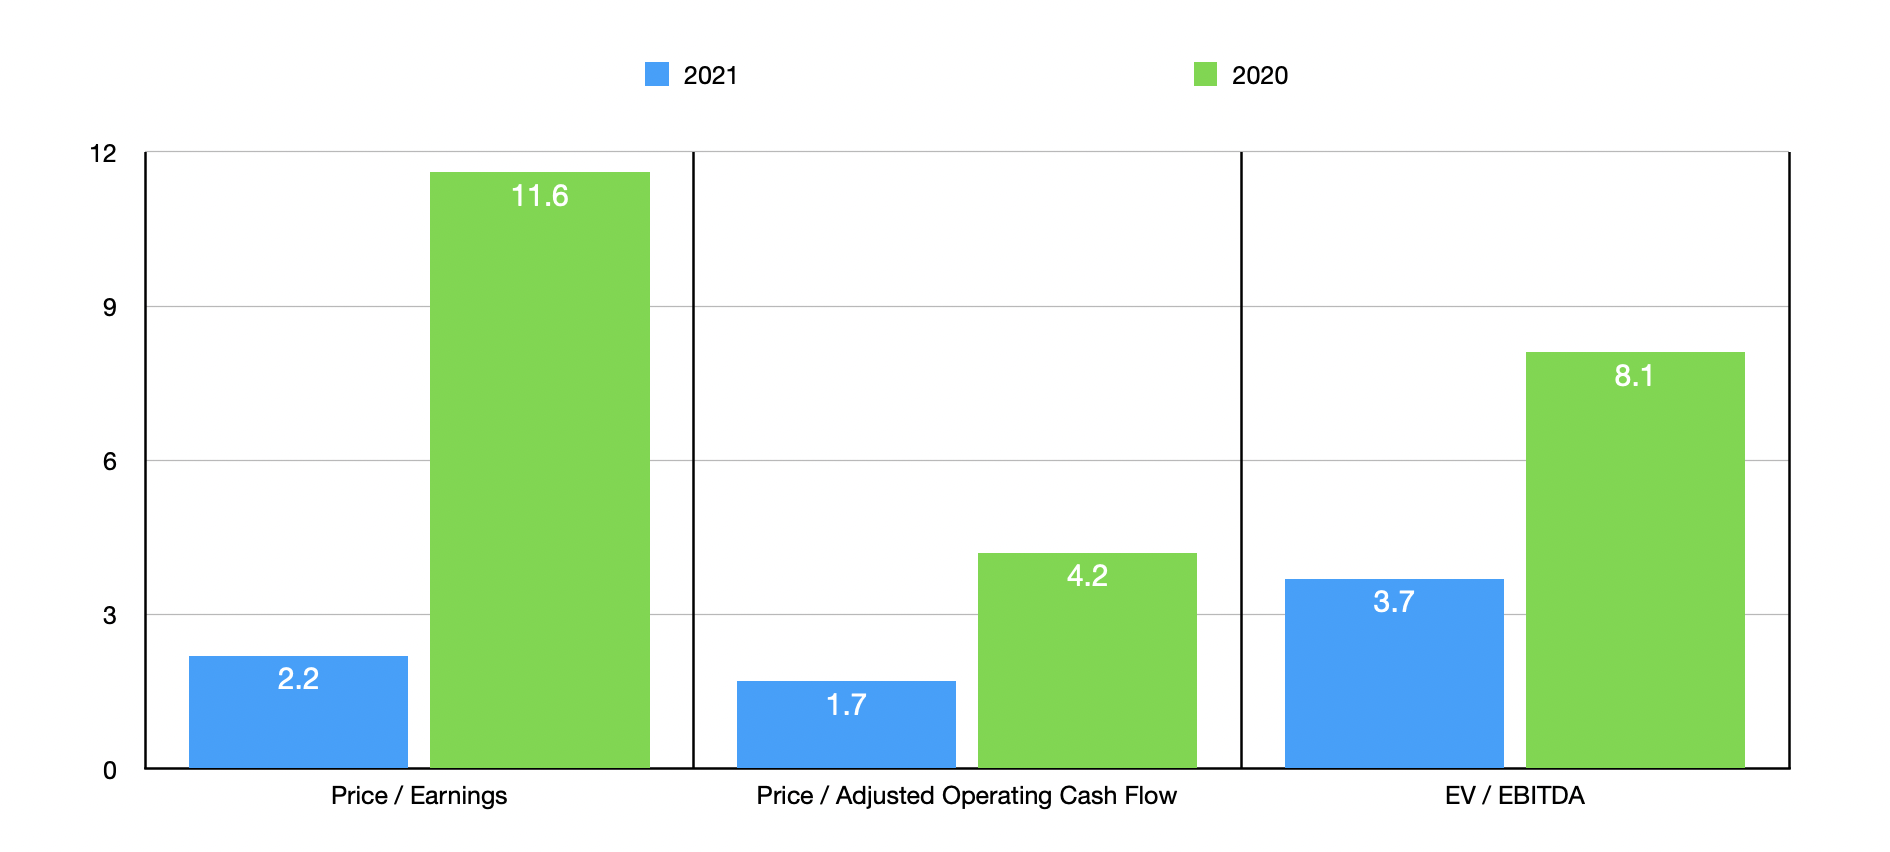
Because of the weakness experienced in the second quarter of the year, I would be hesitant to extrapolate financial performance for the rest of the year. And management has not provided any detailed guidance on this front. Instead, I’ve decided to price the company based on results from 2021. Using that data, the company is trading at a price-to-earnings multiple of 2.2. The price to adjusted operating cash flow multiple is 1.7, while the EV to EBITDA multiple should come in at 3.7. These numbers compare favorably to the 11.6, the 4.2, and the 8.1, respectively, that we get using data from 2020. As part of my analysis, I also compared the company to five similar businesses. On a price-to-earnings basis, these companies range from a low of 3.7 to a high of 12.2. And when it comes to the price to operating cash flow approach, the ranges are from 3.2 to 8.3. In both cases, using our 2021 calculations, Lazydays Holdings is the cheapest of the group. When it comes to the EV to EBITDA approach, the range is between 3.3 and 7.8. And in this scenario, two of the five companies were cheaper than our prospect.
| Company | Price/Earnings | Price/Operating Cash Flow | EV/EBITDA |
| Lazydays Holdings | 2.2 | 1.7 | 3.7 |
| Winnebago Industries (WGO) | 4.7 | 5.4 | 3.3 |
| Patrick Industries (PATK) | 3.7 | 4.5 | 4.4 |
| Thor Industries (THO) | 4.1 | 3.2 | 3.4 |
| Polaris Inc. (PII) | 12.2 | 8.3 | 7.8 |
| Camping World Holdings (CWH) | 6.2 | N/A | 6.2 |
Takeaway
The data right now suggests to me that Lazydays Holdings continues to perform well, despite the fact that there has been some weakness from a profitability perspective. This seems to suggest that the business is experiencing margin pressure, but that pressure is not really related to the company’s ability or inability to push inflation-related costs onto its customers. Instead, it seems to be driven by an increase in selling, general, and administrative expenses. This rise should be considered temporary in nature because of acquisitions the company made and because of increased marketing expense, support costs, and investments in IT infrastructure and compliance. Add on top of this the fact that shares in the company look cheap, both on an absolute basis and relative to similar firms, and that shares even look affordable in the event that financial performance reverts back to the kind of profitability experienced in 2020, and I cannot help but to keep my ‘buy’ rating on the enterprise for now.
Be the first to comment