

Adrian Vidal/iStock via Getty Images
The Global X Covered Call ETFs have become increasingly popular as the Global X Nasdaq 100 Covered Call ETF (QYLD) has $7.08 billion in net assets, while the Global X S&P 500 Covered Call ETF (XYLD) has $1.41 billion in net assets and the Global X Russell 2000 Covered Call ETF (RYLD) has $1.26 billion in net assets. These funds generate large amounts of yield, QYLD and RYLD in the low double digits and XYLD in the high single digits, by deploying a covered call buy-write strategy. More recently, Global X created hybrid covered call funds that seek to generate a respectable amount of yield without completely capping the upside potential as markets appreciate. It’s time to revisit the S&P 500 Covered Call & Growth ETF (NYSEARCA:XYLG) from Global X and see how the fund is fairing and what I think about it now that there is a longer track record.
I added XYLG to the Dividend Harvesting portfolio series on Seeking Alpha as I was captivated by the hybrid approach. XYLG offered an opportunity to deliver more income than many traditional equities while still providing exposure to future capital gains as it would be tied to the S&P 500. XYLG isn’t nearly as popular compared to the full-covered call funds. XYLG only has $36.07 million in net assets, and compared to the level of growth the covered call ETF’s net assets have experienced, this seems odd. I will evaluate XYLG against the SPDR S&P 500 trust ETF (SPY) and XYLD to see how its performing and determine if I want to add to my current position or would I rather stick with XYLD.
Some background on XYLG
In 2020, Global X came out with two hybrid funds with the objective of blending above-average yields with modest potential for capital appreciation. The Nasdaq 100 Covered Call & Growth ETF (QYLG) and XYLG were supposed to be Global X’s solutions to providing income without sacrificing all the gains from writing covered calls against their entire holdings. XYLG is similar to XYLD, but the main difference is that XYLG only writes covered calls on 50% of the portfolio. XYLG holds shares of the companies within the S&P 500 index and then deploys its call buy-write strategy on 50% of the portfolio. Today XYLG has a 12-month trailing yield of 8.04%, pays a monthly distribution, and trades around $30 per share.
XYLD invests at least 80% of its total assets in the securities of the CBOE S&P 500 Half BuyWrite Index. The CBOE S&P 500 Half BuyWrite Index measures the performance of a theoretical portfolio that holds a portfolio of the stocks included in the S&P 500 and writes one-month at-the-money covered call options on the Reference Index. The written covered call options on the Reference Index are held until expiration. By only writing call options on approximately 50% of the portfolio in the Reference Index, the strategy can provide income generation from the call options while allowing for some potential upside exposure to the growth of the underlying constituents of the Reference Index relative to a 100% covered call strategy.
Global X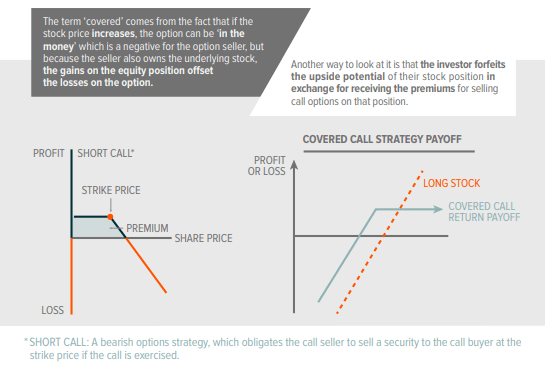
How XYLG is fairing compared to XYLD and SPY
The markets have continued to witness choppy price action as many external events are impacting investor sentiment. A 50 bps (0.50%) hike is on the table for the next FED meeting with a possible plan of reducing the balance sheet by $95 billion per month. Today, the consumer price index, one of Wall Street’s favorite ways to measure inflation, came in at 8.5%, which is now a 40-year high. Not only are the worries of inflation rising and a recession on the horizon impacting the markets, but the war in Ukraine also rages on, and geopolitical tensions continue to maintain at elevated levels. This hasn’t been the easiest investing environment so let’s see how XYLG is doing compared to XYLD, which is the full covered call ETF tracking the S&P and SPY.
Seeking Alpha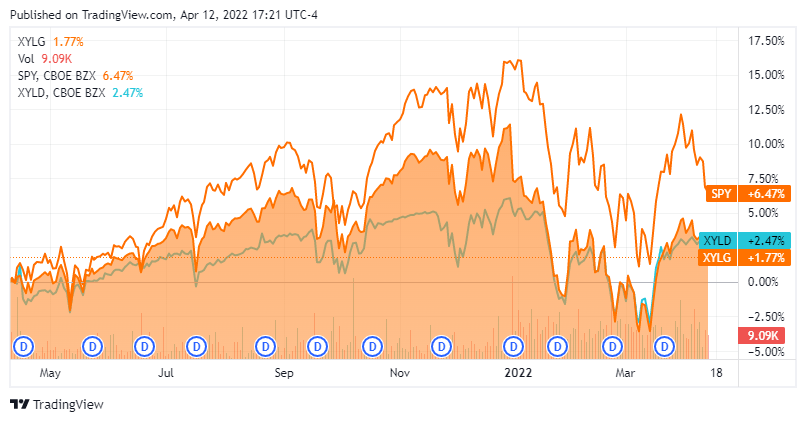
Over the past year, SPY has appreciated by 6.47%. Interestingly, XYLD has outperformed XYLG by almost a full percentage point. If SPY was down over this period, this outcome wouldn’t be as shocking, but since the relative index is up, the ETF with only half of the covered call exposure should be up more than the one with the entire fund exposed covered calls. Exposing the entire fund to covered calls essentially puts a ceiling on the entire fund’s appreciation.
Seeking Alpha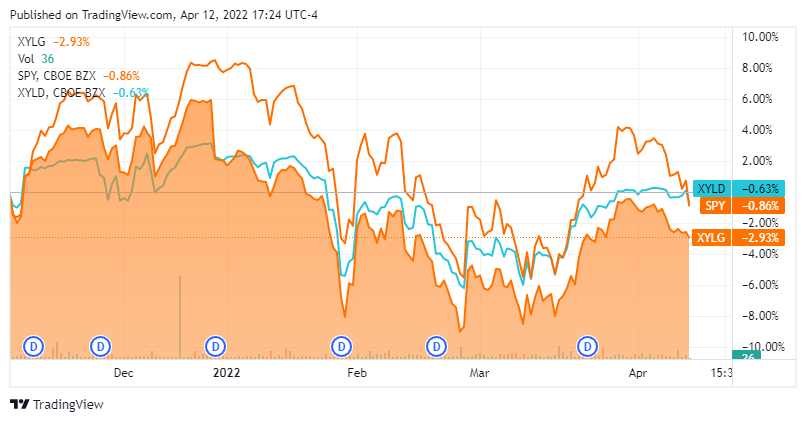
XYLD has navigated the downturn better than both SPY and XYLG. Over the previous 6-months, XYLD has been down -0.63% compared to SPY being down -0.86% and XYLG -2.93%. In 2022, YTD, both XYLD, and XYLG, have outperformed SPY, but XYLD is holding up better than XYLG as its down -2.66% compared to -5.31%. On performance alone, XYLD looks to have appreciated more by just a slight margin and has mitigated the downside better than XYLG. These are certain points against XYLG, in my opinion.
Seeking Alpha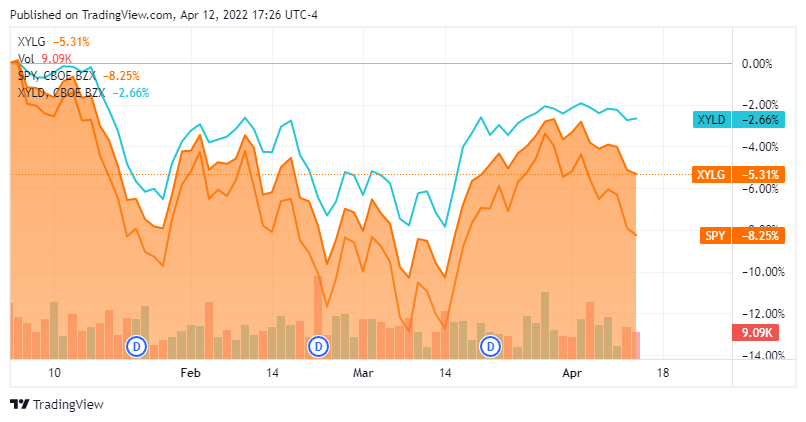
Comparing the income investment with XYLG and XYLD
Regardless of whether you’re investing in XYLG or XYLD, income is an important investment aspect. We saw the charts on price performance, so now I want to look at these funds from an income perspective. I will evaluate these funds 2 ways, from the amount of income they both generated and what a $5,000 investment would have turned into since 9/29/20 when XYLG debuted while reinvesting each of the monthly distributions. I picked $5,000 for the initial investment because it wouldn’t be a fair analysis going with 100 shares of each due to the difference in share prices.
Steven Fiorillo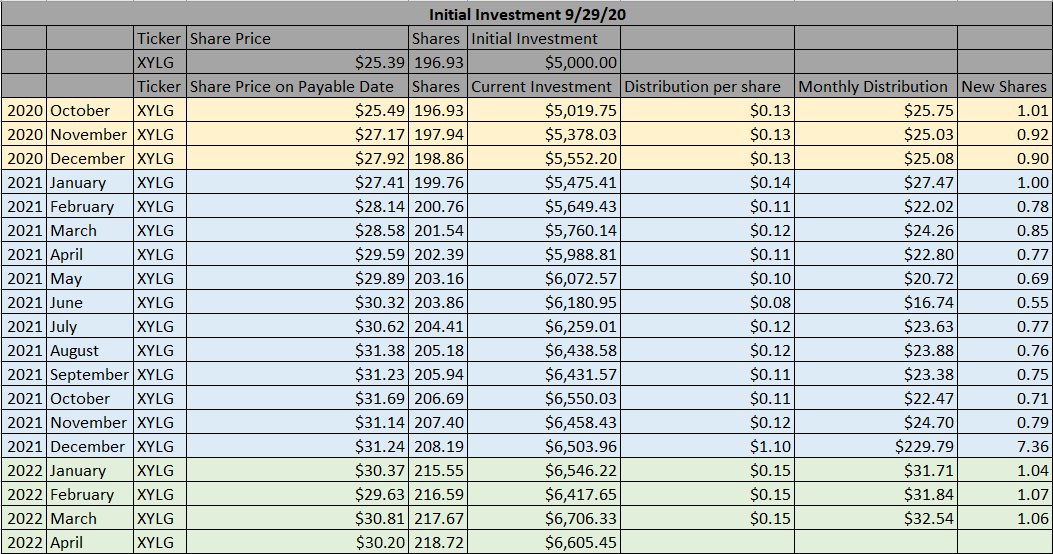
An initial investment of $5,000 on 9/29/20 in XYLG would have purchased 196.93 shares. By reinvesting each distribution, your share count in XYLG would have grown to 218.72 shares. Based on the closing price of $30.20 at the close on 4/12/22, your initial investment of $5,000 would have grown into $6,605.45.
Steven Fiorillo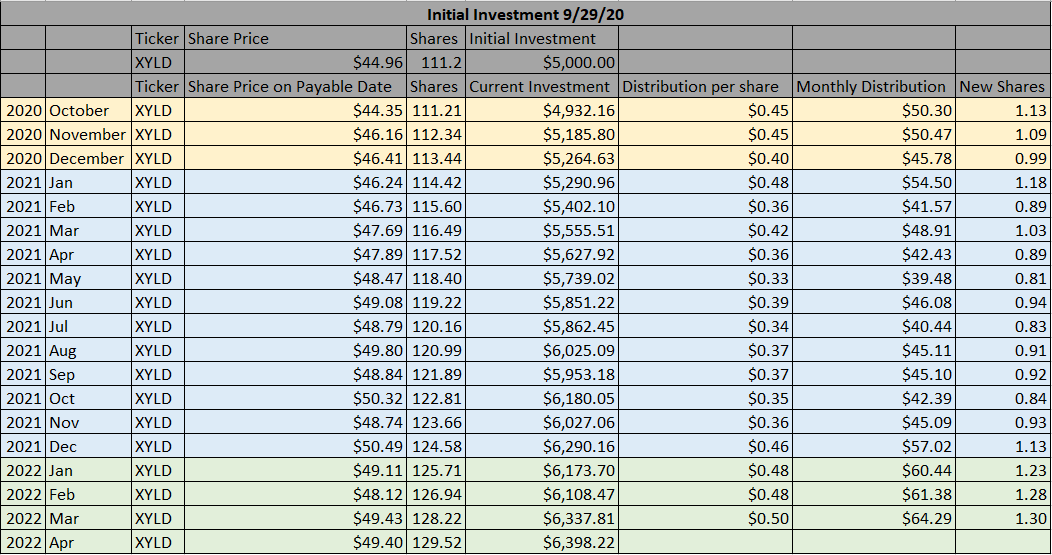
An initial investment of $5,000 in XYLD on 9/29/20 would have purchased 111.21 shares. By reinvesting each distribution, your share count in XYLG would have grown to 129.52 shares. Based on the closing price of $49.40 at the close on 4/12/22, your initial investment of $5,000 would have grown into $6,398.22.
Steven Fiorillo, Seeking Alpha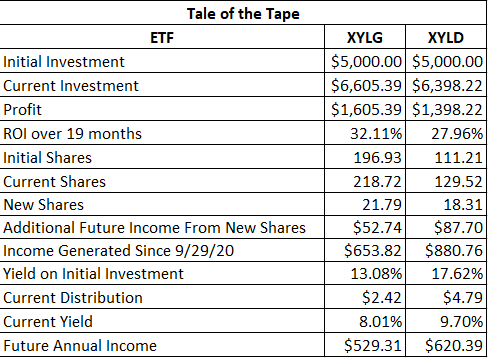
There is a good amount of data to analyze from this comparison. From a purely monetary investment standpoint, a $5,000 investment in XYLG would be worth an additional $207.17 compared to $5,000 in XYLD over the past 19 months. While XYLD has mitigated the downside better over the past year, there are two factors why XYLG has become victorious in this exercise since its inception. The first reason is that since 9/29/20, XYLG’s share price has appreciated by 18.95%, while XYLD has only appreciated by 9.88%. The second reason is that in December of 2021, XYLG generated a large amount of income, allowing 7.36 shares to be purchased through the reinvestment of the distribution, which slightly increased the following 3 distributions. Your investment in XYLG would have generated $1,605.39 in profit for an ROI of 32.11% on the initial investment. XYLD would have generated a $1,398.22 profit for an ROI of 27.96% on the investment. Overall you would have generated an additional 4.14% by investing in XYLG compared to XYLD since 9/29/20.
XYLD has been the superior investment from an income perspective, which comes as no surprise since it’s a full-covered call ETF. I think the margins may shock you, though. By reinvesting the distributions in XYLG you would have ended up with 21.79 new shares, generating an additional $52.74 in annual income. Since 9/29/20, the $5,000 investment in XYLG produced $653.82 in distributions, a 13.08% yield on investment. XYLG currently has a distribution of $2.42, placing its current yield at 8.01% and its future annual income at $529.31. By reinvesting the distributions in XYLD, you would have ended up with 18.31 new shares, generating an additional $87.70 in annual income. Since 9/29/20, the $5,000 investment in XYLD produced $880.76 in distributions, a 17.62% yield on investment. XYLD currently has a distribution of $4.79, placing its current yield at 9.70% and its future annual income at $620.39. Overall, an investment in XYLD would have generated an additional $226.94 in income, and looking forward, your investment would generate an additional $91.09 in income compared to XYLG.
Conclusion
It really depends on what time period you’re looking at, but ultimately, XYLG does meet its investment objective. Since its inception, XYLG’s share price has increased by 18.95% compared to 9.88% for XYLD, which is pretty close to the 50% vs. 100% covered call correlation between the two funds. If you’re looking for growth and income, XYLG works, and by reinvesting the distributions, you would have come out ahead of an investment in XYLD by 4.14% over the past 19 months. From the downside mitigation and income side, I would give the edge to XYLD. In the recent downturn, XYLD’s share price has declined less on a percentage basis, and it does generate more income. One of the biggest shocks though is that XYLD only generates an additional 1.69% on its forward yield. I like both funds, and they both seem to achieve their objective. With the yield spread being so close, I would rather XYLG over XYLD based on the larger 4.14% profit generated throughout my investment scenario. It looks like XYLG will be more volatile than XYLD during periods of uncertainty, but the data indicates that XYLG has outperformed the XYLD counterpart when reinvesting the distributions over the past 19 months. If you’re looking for a hybrid fund that can throw off large single digits in yield while still capturing the growth, XYLG may be an interesting option to consider.
Be the first to comment