

Gea Veenstra/iStock via Getty Images
It’s April 12th, 2022, about two years since my last article on Seeking Alpha. Since March of 2020, I’ve been of the opinion that America Is Rising To The Challenge, namely the challenge of Covid-19. We evaluated the different recovery scenarios and concluded that given the economic stimulus, the recovery would be like “pouring gasoline onto a bonfire”, and that “we will recover fiercely!”. We also covered the interdependence of all the sectors of the US economy on one another and how we need each other to get through these times. Today, I would like to review some more lessons from the past, the sectors that are working, and what I hope to expect moving forward.
Some readers may have heard of the Horse Manure Crisis in the late 1800’s and early 1900’s and the massive resulting transit pollution problem of the times. According to information I gathered from Eric Morris’s article in Access Magazine, titled From Horse Power to Horsepower, Number 30, Spring of 2007, the combustion engine ended one pollution crisis only to build up into a new one. It was a fascinating article that helped me relate to the problems in New York City, over 100 to 150 years ago.
Some points in the article that caught my interest are that there were roughly 150,000 horses in NYC, which transported everything from people to freight. Eric wrote that “Horses need to eat. According to one estimate each urban horse probably consumed on the order of 1.4 tons of oats and 2.4 tons of hay per year”. The other serious problem at that time was equine manure, which some experts estimated could have been up to 4 million pounds each day. Now that’s a lot of horse manure to deal with (not to mention about 10 million gallons of horse urine). The manure piled up and coated the streets and it stank. When it rained, the manure was mucky and when it was dry, it was dusty and attracted flies and consequently spread disease. The city tried to regulate the problem; however, they were not able to solve the problem until something interesting happened. Because of innovation and the invention and economic efficiency of streetcars and the automobile, the automobile surpassed horses in 1912, and eventually the horse manure problem was solved. By 1917 the last horsecar was decommissioned.
Today, pundits continue to tell us we have a different type of pollution problem. They say the problem is CO2 emissions. When I look around, I can’t help but agree with them. We are destroying our air, water, and ecosystems around the world and I don’t think anyone in their right mind could disagree with that. However, in case some people haven’t noticed in recent months, we are still dependent on fossil fuels. Now like the Horse manure problem of the late 18-early 1900’s, many politicians are trying to regulate, even eradicate the use of fossil fuels before the invisible forces that affect supply and demand in our economy are ready. We can see this very clearly in recent months, in the doubling of gas prices at the pump and the effects it’s having on the many interdependent sectors of our economy. It affects Healthcare, Transportation, Agriculture, Finance, Materials, Industrials, Research and innovation, Utilities, and consequently the consumer. Furthermore, I believe it affects the middle- and lower-income consumer the most.
Our “elected leaders” can force a change in the types of energy we rely on for everyday life, however they cannot force the invisible hand, that affects the price efficiencies of supply and demand. When innovation of alternative energies reaches a certain level of efficiency, then like the horse manure problems of the past, the fossil fuel problems of the present will also go away. In the meantime, I believe the United States of America produces some of the cleanest fossil fuel products in the world. Why on earth would we offshore this important responsibility to nations that do not do this as cleanly or as efficiently as the United States. Truly, I’m not talking about bull manure here.
Relative Sector Update
I’ll keep the sector section brief today as relative strength in sectors has been bouncing around a lot lately. Some very clear changes are the consumer discretionary (XLY) and technology sector (XLK), which have dominated since nearly March of 2009 are now relatively underperforming the S&P 500. That was a long run, but for now, it seems to be over. What can be gleaned from the long run in XLK and XLY is that our methodology of identifying and holding the sectors that are leading can be successful. Furthermore, by removing sectors and individual equities that, on a relative strength basis, are not performing well, a disciplined investor can potentially limit large losses and wait for another day, when that great idea is working.
Currently, as of April 11th, 2022, the sectors that are leading on my relative strength radar are as follows:
Industrial (XLI) – Relative strength in this sector is positive, however it is losing ground.
Consumer Staples (XLP)
Healthcare (XLV)
Utilities (XLU)
Real Estate (XLRE)
Equally weighted S&P 500 index (RSP)
There has also been a switch from the S&P 500 Growth Index (SPYG) to the S&P 500 High Dividend index (SPYD). I don’t think getting a nice yield while we wait on the fate of the world is a bad thing for now. If you want to find the holdings for these different sectors, I find Yahoo Finance to be a good resource.
Market Risk Meter
Proprietary Market Risk Meter (Christopher DeMaria, DeMaria Financial Services)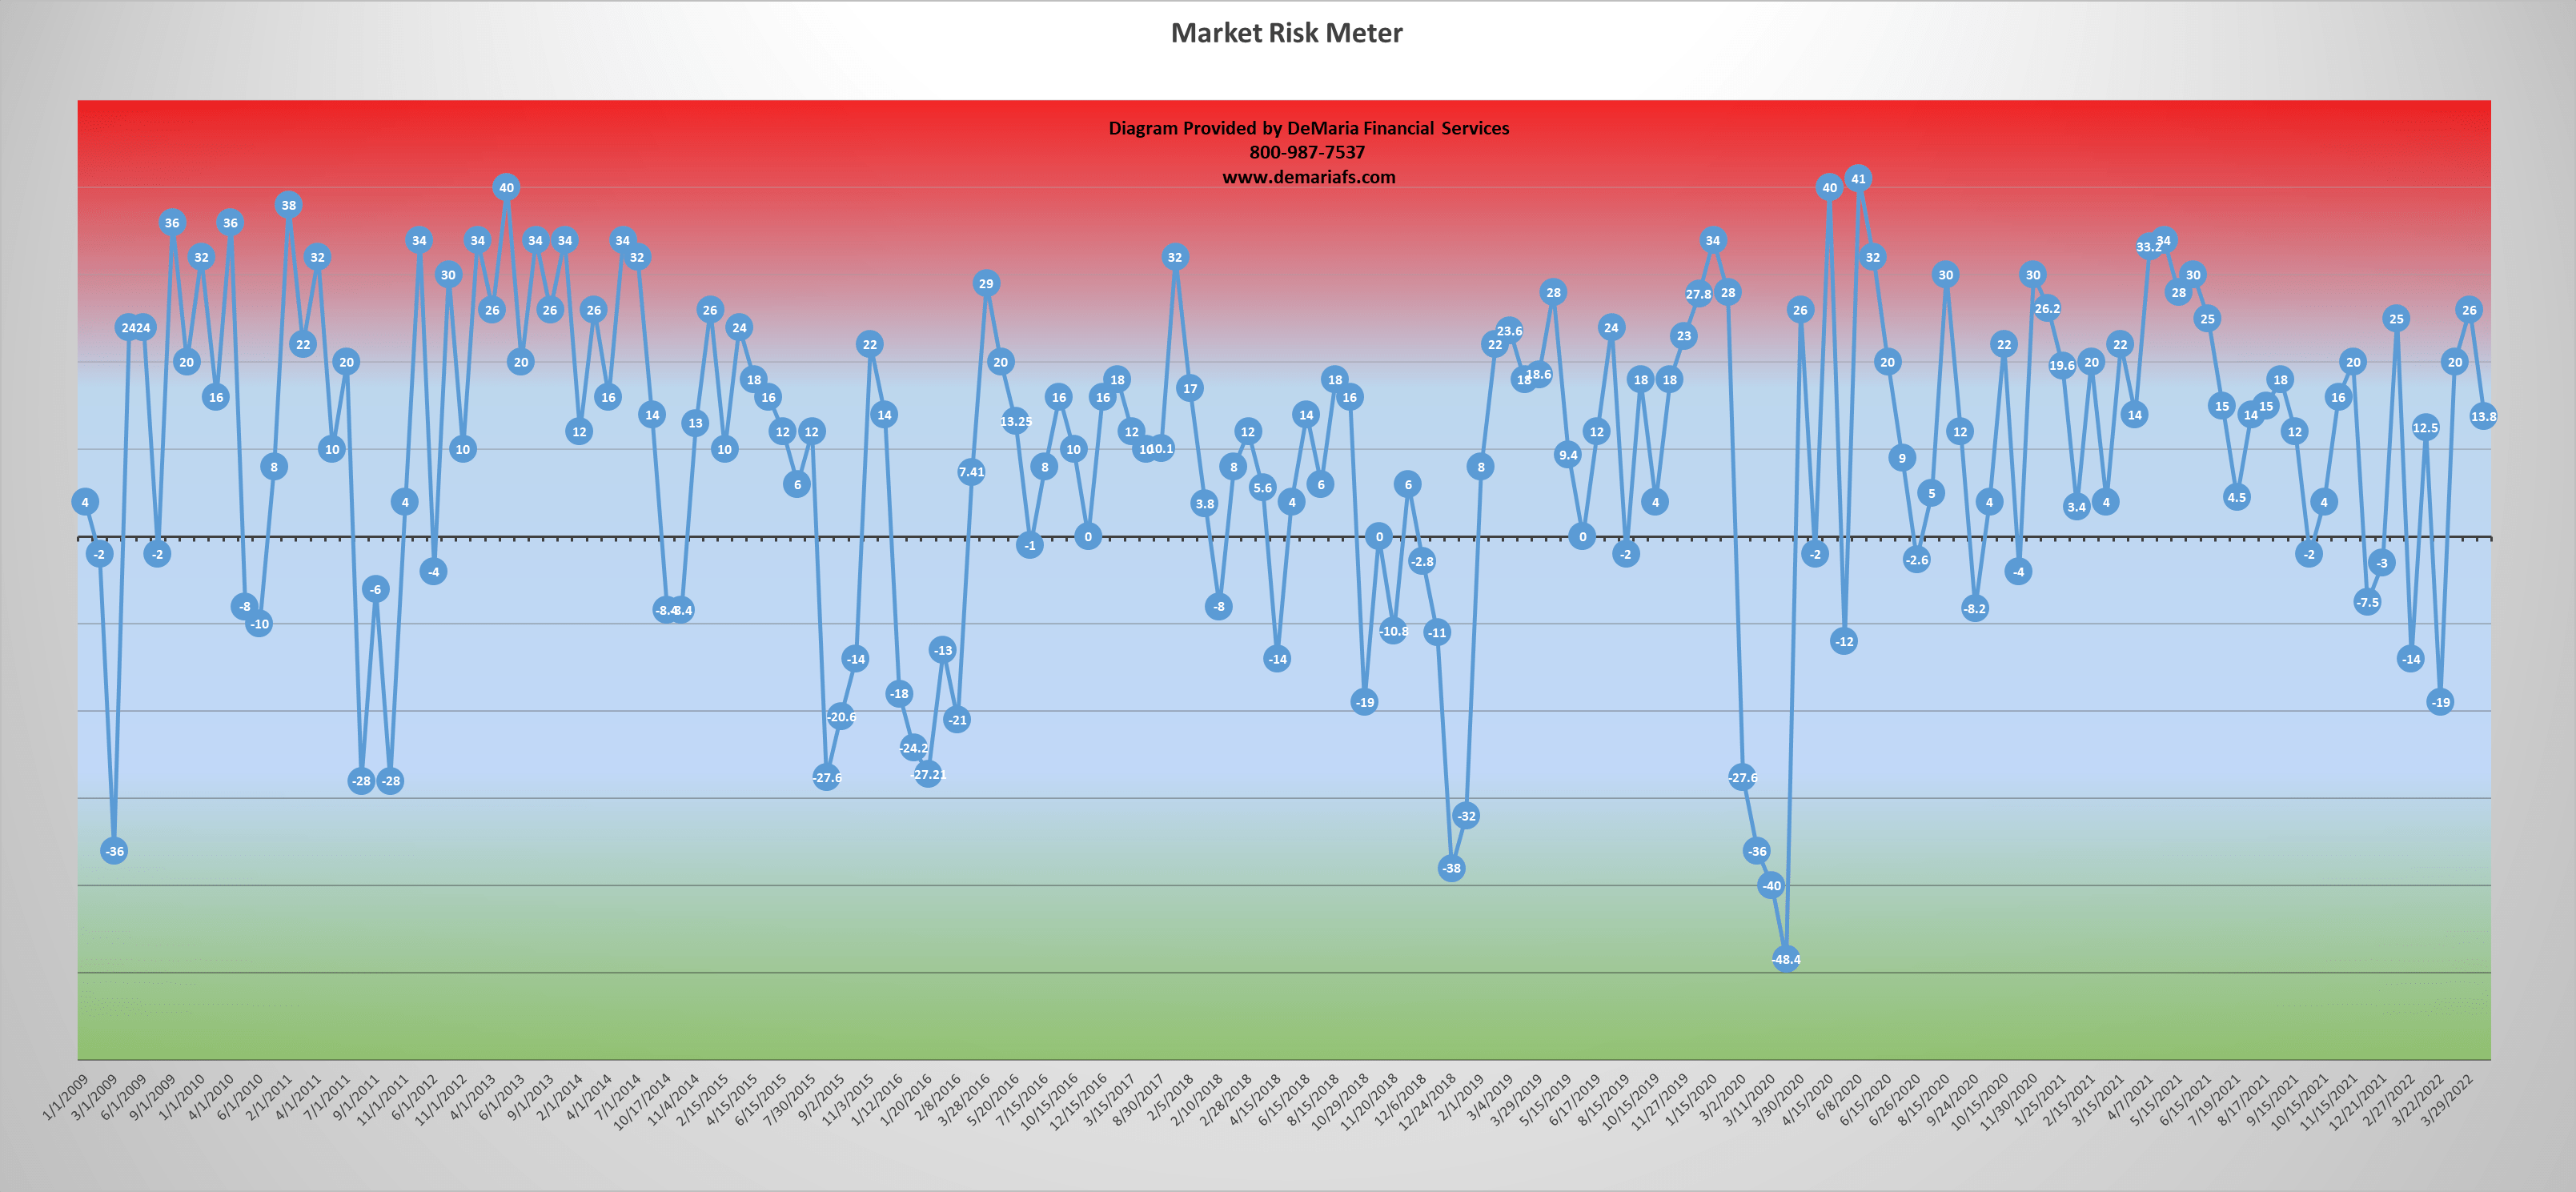
These performance charts have been provided for informational purposes only, and should not be used as the sole basis for making an investment decision. Investment decisions must be made on your own individual needs and risk tolerance. The content you gather from any performance chart is just one of the factors that should be considered before making your investment decision. Past performance is not a guarantee of future performance, and the performance of these diagrams are subject to a number of market factors that may cause the price to fluctuate.
I designed a proprietary risk meter in January 2009, to help me gauge the level of risk in the markets. Over the last few months, the general market has not had a blowout panic moment, that one might expect, knowing that there are nuclear missiles pointed at most of the developed world, and I am a bit skeptical of any rally attempts before that happens. In client portfolios at this time, I am holding long-term core positions however, many tactical positions have been moved into more defensive investments like (XLP), (XLU), other relative strength leaders like (XLI), (XLRE), and (XLV) and even cash equivalents. At least until we get closer to a lower risk entry point that has been eluding us, despite inflation, rising rate, and the potential for escalation of the war between the Ukraine and Russia.
More about the proprietary Market Risk Meter
I am a firm believer that many things will return to some sort of mean over time. When looking at the markets and risk, I prefer to view the ebbs and flows as ocean tides. When the tide comes in, per my methodology, risk is higher. Conversely, when the tide flows out, risk is lower. Although I cannot measure exactly when a correction or bounce will occur, I can tell you when there is more or less inherent risk in the market. I can also examine whether the tide has come in further than normal, (presenting greater risk) or gone out further than normal (providing us with rare lower-risk entry points)
More specifically, on the chart above, when risk rises above 20, it is time to begin trimming losers, taking some gains from winners in your portfolio and reviewing the types of positions you feel comfortable holding when things get ugly. If you’re more of a long-term asset allocation investor, look at re-balancing your portfolio by shifting equity gains to other less correlated asset classes. You may also consider hedging strategies like selling calls, purchasing puts, or stop limit orders to try to mitigate risk.
When readings get below -20, hopefully you will have already identified your buy list of favorite mutual funds, equities, ETFs etc. because once you identify that high volume, high volatility, downside trading day coupled with a strong reversal and 1-2 days’ follow through, you will now begin purchasing. Behind the scenes, you will be purchasing at prices that under normal rational conditions, investors would not be willing to sell for but once emotion is brought to the table and when others are panic selling the rules of logic are usually tossed out the window. It’s like comparing an orderly fire drill to what really happens when there is a fire.
Those historical or even hysterical moments are like gems to the well trained and experienced money manager who is looking to buy but these events are rare. Seeing as the ideal buying opportunities do not present themselves very often, as evidenced by the fact that not every correction gets to -20 or lower on my risk measurement tool, there is a little more to discuss. Most purchases are made by identifying market reversals between the -10 and 0 levels on my diagram. I will continue to purchase some positions between 0 and 10 and rarely ever purchase anything above 10.
Thoughts
I’ve had a bit of time to let my mind wander and think about a lot of things over the last few years. Things like why are these things happening in the world? Why are there so many things that just don’t seem fair or right? Why are so many people suffering and what can one person, like me try to do to make any of this better for anyone? If you ask my wife, she might tell you that all that thinking just caused smoke to come out of my ears as my mind kept spinning into unsolvable paradoxes.
I think the result of all my futile overthinking is that I have no idea what’s going to happen tomorrow, and I don’t have a crystal ball. I do believe we can rely on a few things to help us glean into the present. History is one of those things and even though history doesn’t precisely repeat itself, I believe it certainly rhymes.
If we look at history, the long-term rates of inflation have been about 3% to 3.5%. This includes periods of very high rates of inflation, like in the early 1980’s and periods of lower inflation, like 2000 until 2022. One of the historically effective ways to offset inflation has been through ownership of assets that can adjust for rising costs (commercial real estate, equities, etc.). Like the analogy of gas prices at the pump rising quickly with increasing petroleum prices, many industries are also able to adjust their prices to compensate for increasing costs. It seems like a simple concept to me; however, the stock market can be a terrifying place without proper discipline, experience and faith.
Continuing with this example, if the stock market has grown on average between 8% and 10% over the long term, this means that a portfolio could potentially double about every 9 years or about every 13 years when adjusted for 3.5% inflation. Another thought is that if you have $100 in a no interest checking account, and long-term inflation rates remain about the same, the real value of your $100 will be worth about half in 20 years.
These concepts are why I continue to try and share the little bit of knowledge I’ve learned over 24 years of managing money for investors.
Hopes and Conclusion
With short-term inflation and energy prices increasing, there appear to be some very real pressures on our economy. The apocalyptic scenario of the big button being pushed hasn’t really come to mind since my childhood years in the early 80’s, and I’m going to disregard that one for now, because it doesn’t seem relevant to a long-term investment horizon. My hope is that our leaders recognize that the world is still dependent on fossil fuels and my belief that western developed nations produce some of the cleanest and most efficient fossil fuel energy and combustion products. I will continue to hope that through the invisible forces that control the world economy, we can quickly come to the point where cleaner alternative energy sources are efficient and cost effective, consequently ending any government efforts to force the use of presently costlier alternative sources.
If we do evade my biggest childhood apocalyptic fear (the big button), fundamentals appear to indicate next leg of the long-term secular bull market might be led by small company stocks, which have mostly been on the sideline for the last year. According to the Wall Street Journal P/E yields in that asset class are expected to decline dramatically, based on forward 12 month estimates from Birinyi Associates. However, due to the methodology I use, portfolios will not be taking on meaningful positions in small caps until they are performing well on a relative strength basis.
Finally, because of current events, my belief that the world still appears to be dependent on energy is crystalizing. Until we arrive at a major innovation driven shift that moves us into cleaner transportation and energy sources, let’s reward the companies that are doing it the cleanest and in a way that’s most friendly to our environment.
Be the first to comment