

Andrew Burton/Getty Images News
Earlier on I wrote about Alibaba (NYSE:BABA) and the fact I would not buy the shares of this company just yet since I am now expecting a full-scale recession. However, I would like to compare JD.com (NASDAQ:JD) and Alibaba as I consider the latter to be a far better choice for investors than JD. That is because of Alibaba’s leading position in the e-commerce market, but most importantly, its profitability. But let me explain this in a bit more detail.
The E-commerce market in China
Trade.gov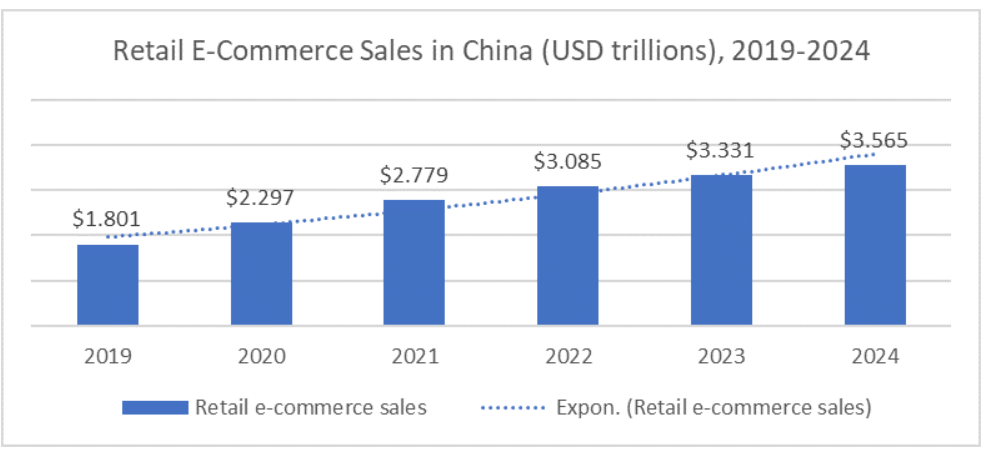
Right now, China is the biggest e-commerce market in the world. It alone generates almost 50% of the global transactions. According to eMarketer, in 2020 in China there were 710 million digital buyers, whilst the transaction volume totaled $2.29 trillion in 2020. Some analysts predict the Chinese e-commerce market would reach $3.56 trillion by 2024.
The diagram below shows the market shares of Alibaba (TMall), JD.com, and the other three small companies working in the business-to-consumer sector for the year 2020, respectively.
TMO Group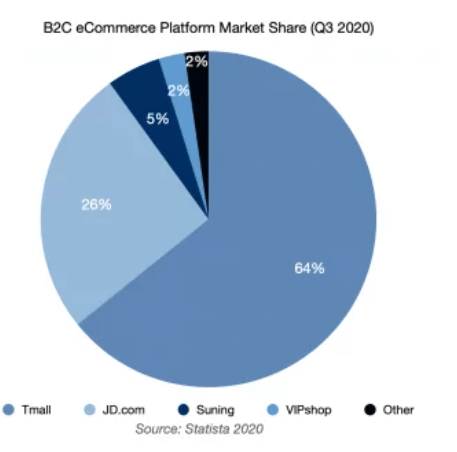
Based on this diagram, Alibaba is almost two times larger than its closest competitor JD in terms of e-commerce market share, whereas other companies operating in the same sector are far smaller than both BABA and JD.com.
JD and BABA – Financial indicators
But let us see several other factors used to compare companies. These are sales, profit, employees, ROCE (return on capital employed), and market capitalization.
I prepared a table comparing the indicators for both BABA and JD.
|
Alibaba |
JD.com |
|
|
Recently reported annual sales ($billion) |
134.57 |
149.3 |
|
Recently reported annual net profit ($billion) |
9.77 |
(1.58) |
|
Number of employees |
251,462 |
298,717 (as of 2021) |
|
Recently reported ROCE (%) |
6.19 |
1.2 |
|
Market capitalization ($billion) |
328 |
105.7 |
Source: Prepared by the author
Interestingly enough, despite the fact the market share of BABA in the e-commerce market is higher than that of JD, right now BABA’s total revenue is somewhat lower than that of JD.
At the same time, Alibaba has been showing a far better revenue growth performance than JD for many years.
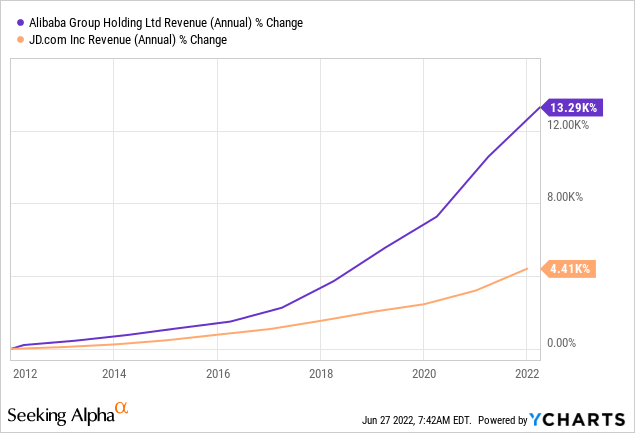
As can be seen from the graph above, JD’s revenue only grew by 4,410%, whereas Alibaba’s sales rose by 13,290% over the last 10 years.
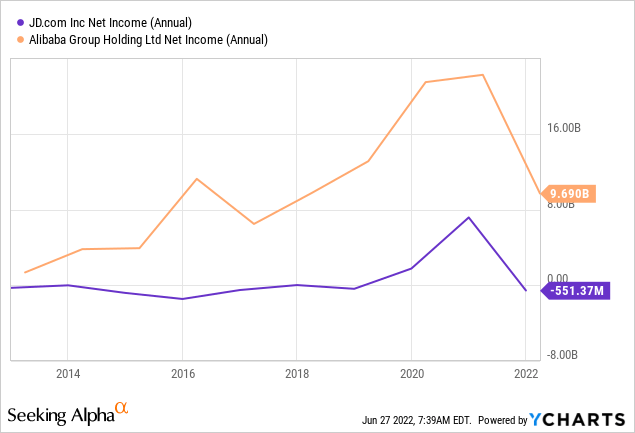
As concerns both JD’s and BABA’s net profits, they declined in 2021. However, JD’s net profit turned negative, whereas BABA’s net profit fell almost 50%.
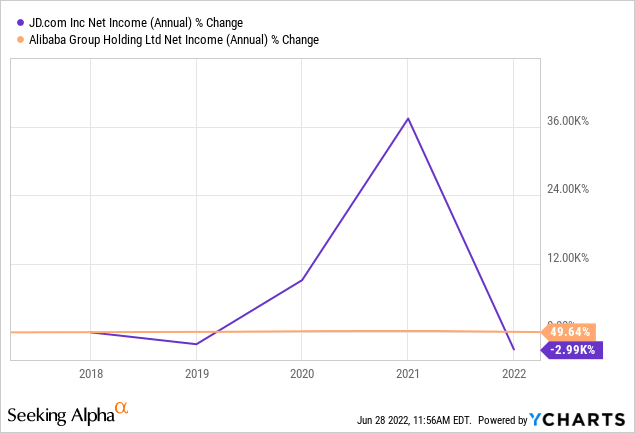
If we take the recent 5-year period, we will see that BABA’s net profit increased, whereas that of JD turned negative.
So, we can say that BABA is more efficient than JD. This is especially true if we have a look at the ROCE ratio of each company. Despite the fact JD’s workforce is even bigger than that of BABA, JD is less able to deliver profit.
Credit ratings
Now, a couple of words about the two e-commerce companies’ credit ratings. Alibaba’s Fitch rating is A+, which is an upper-medium grade. JD’s S&P Global’s credit rating, meanwhile, is a lower-medium grade or BBB.
BABA has plenty of liquidity. Its total cash and investments were $71.77bn, its current liabilities only totaled $60.53bn, whereas its total liabilities were $98.26bn. BABA’s current ratio (current assets/current liabilities) is $100.71bn/$60.53bn=1.66. A value above 1.5 is considered to be good. It is widely expected that the average annual free cash flow in the next few years will be quite high but, at the same time, affected by higher investments and anti-monopoly fines.
Fitch also expects BABA’s fund from operations gross leverage to be 1x or below. Alibaba would have a solid net cash position. Alibaba’s debt level is very moderate, whereas its cash balance is high. That is why it does not need substantial profit growth to keep its financial profile strong. In fact, its core e-commerce business alone is enough to finance capital expenditures, investments and other business costs. Inspiring is also the fact Alibaba can buy back its shares. In my view, it is much better when a company pays dividends. But buyback programmes help to keep the share prices stable.
As can be seen from the excerpt below, Alibaba has been reporting positive net profits for many years already and has been also growing its profits for many years. So, it seems that only the recent reporting period was a one-off.
Seeking Alpha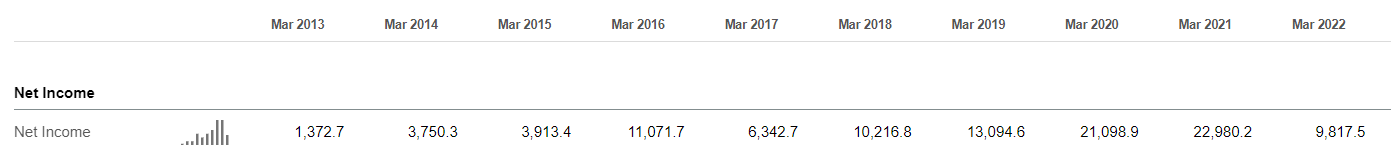
JD.com is a company enjoying product diversity and a conservative financial structure. Some of the company’s strengths include non-electronic products, logistics services, and improved service quality.
Its total cash and investments were $28.48 bn, its current liabilities totaled $34.54 bn, whereas JD’s total liabilities were $40.43 bn. However, the current ratio seems to be acceptable. JD’s current ratio is = $45.62 bn/$34.54 bn = 1.32. This is above 1. But JD’s balance sheet still seems to be poorer than that of Alibaba.
But the very fact that JD.com cannot deliver a sound net profit history makes it look quite disadvantaged as opposed to its close competitor BABA. The recently reported poor earnings results were not a “one-off” as can be seen from the excerpt below. 2018, 2017, 2016, and many other years were marked by net losses, which alone should make investors feel dubious about buying JD’s shares.
Seeking Alpha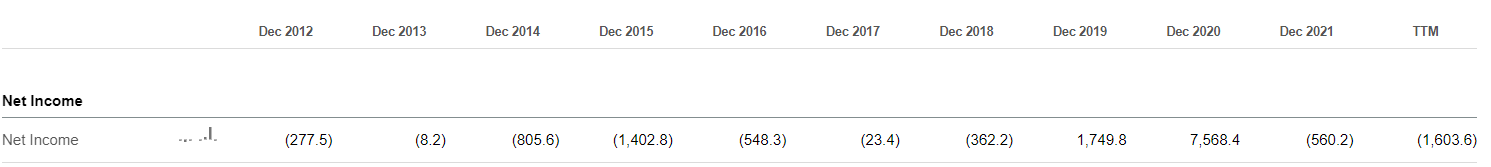
Risks
I would say that both companies are facing a tremendous amount of risk as the global economy is on the verge of a major recession. Both JD and BABA rely on consumer demand, which will fall during a recession. This, in my opinion, is the biggest risk. However, in my view, JD will be affected more substantially than BABA since the latter is a profitable company.
But, in my view, political pressures pose a bigger risk to BABA than JD. When the Chinese government decided to introduce tougher regulations for the local high-tech firms, BABA was the first to take the hit as opposed to JD. It is enough to check the financial news headlines linked to Chinese anti-monopoly regulations to see that Alibaba was a very important target. It all started at the end of 2020 and is still worrying investors now. For example, the arrest of a man in Hangzhou at the beginning of May surnamed Ma briefly wiped tens of billions of dollars off Alibaba’s valuation. The market, however, was wrong at the time since the person arrested was not BABA’s founder, Jack Ma. It is important because it looked plausible to investors that tougher measures against BABA and its founder would be imposed by the Chinese government.
Valuations
As I mentioned in my other article on Alibaba, by many ratios Alibaba’s stock is more attractively valued than that of its closest rival JD.com.
But if we just have a look at these two excerpts from Seeking Alpha, we will see that Alibaba’s stock seems to be cheaper. It is, in other words, trading closer to its 52-week lows than JD.
Alibaba
Seeking Alpha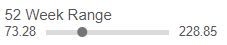
JD.com
Seeking Alpha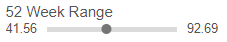
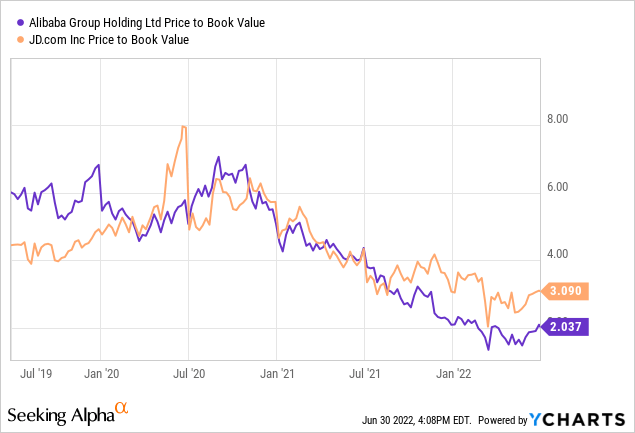
From the graph below, we can also see that BABA’s stock got substantially cheaper than that of its close competitor over the last 3 years, which makes Alibaba seem to be a better choice.
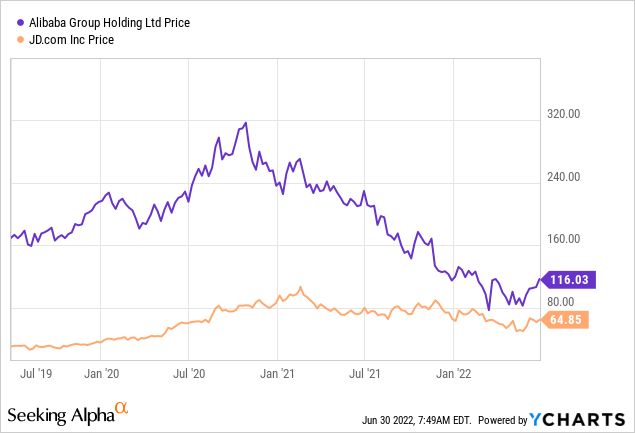
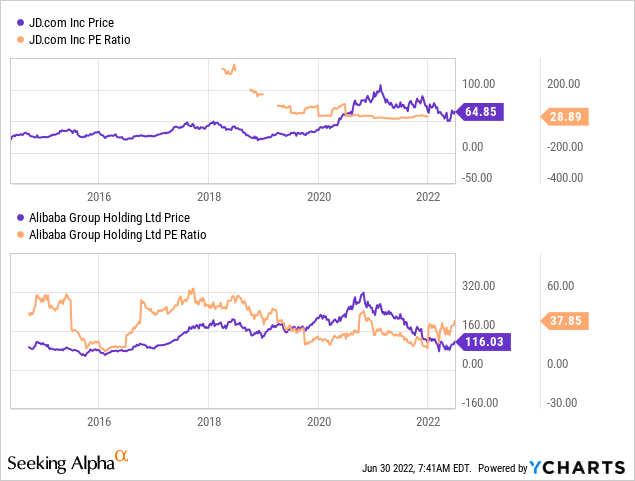
Right now, JD’s price-to-earnings (P/E) ratio is negative. It was negative for several years in a row. However, Alibaba’s P/E is around 38. It is high, by all means, but this figure is due to the fact its recently reported earnings fell by 50% mainly because of a fall in the value of its investments.
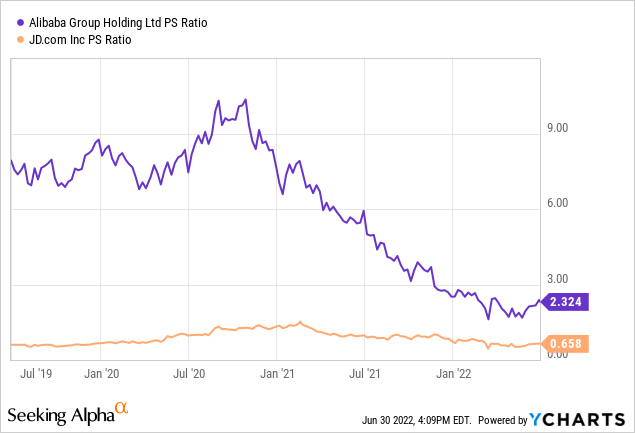
However, as I mentioned before, JD’s sales even exceeded these of Alibaba. That is why JD’s price-to-sales (P/S) ratio is much better than that of its closest rival, BABA. But BABA’s P/S ratio is also quite low, just about 2, whereas a good ratio should ideally be below 3. But P/S is the only valuation criterion where JD is better than BABA.
Despite the fact JD’s balance sheet is poorer than that of BABA, JD’s P/B ratio is substantially higher, which suggests obvious overvaluation.
So, I would say despite its lack of profitability, JD is more overvalued than Alibaba.
Conclusion
The key downside risk to both JD and BABA is that of a deep recession. But loss-making companies like JD are more vulnerable to such a threat than profitable ones. Moreover, JD is more overvalued than BABA, whilst BABA has a stronger position in China’s e-commerce. Then, Alibaba’s financial stance is more stable and its credit rating is substantially higher than that of JD.com. However, Alibaba is facing more political pressures than JD. Overall, if you consider investing in China’s e-commerce, I would suggest buying Alibaba for the long term and selling JD.
Be the first to comment