


PM Images
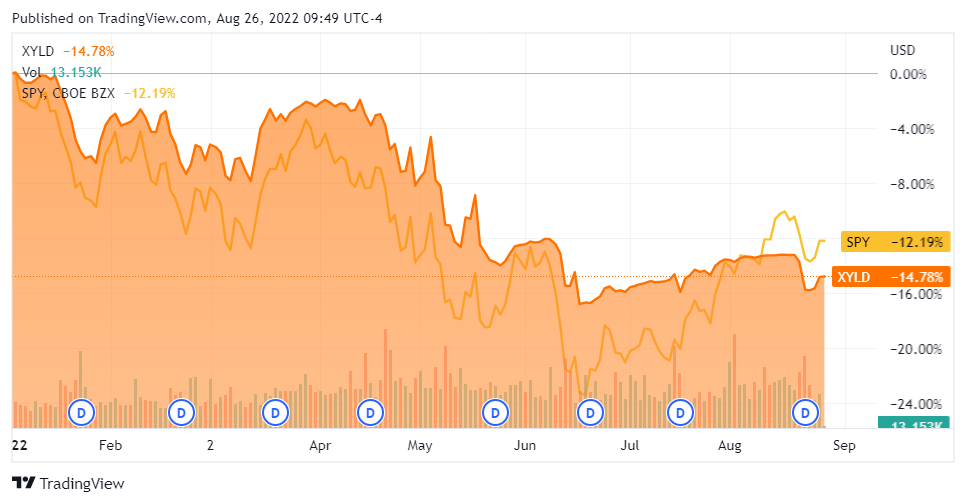
I recently wrote an updated article on the Global X Nasdaq 100 Covered-Call ETF (QYLD) and received some messages about doing a similar update article on the Global X S&P 500 Covered-Call ETF (NYSEARCA:XYLD). Until the beginning of August, XYLD had declined less on a percentage basis than the S&P 500 indices, which I will track by using the SPDR S&P 500 Trust (SPY). SPY has appreciated 14.89% ($53.94) per share from its June low, which has made its 2022 ROI crossover XYLD’s for the first time YTD. Now that summer is almost over, and the bottom may be in, let’s look at XYLD and see how this investment has performed, if its covered-call strategy is holding up, and if its investment premise is still enticing.
Seeking Alpha
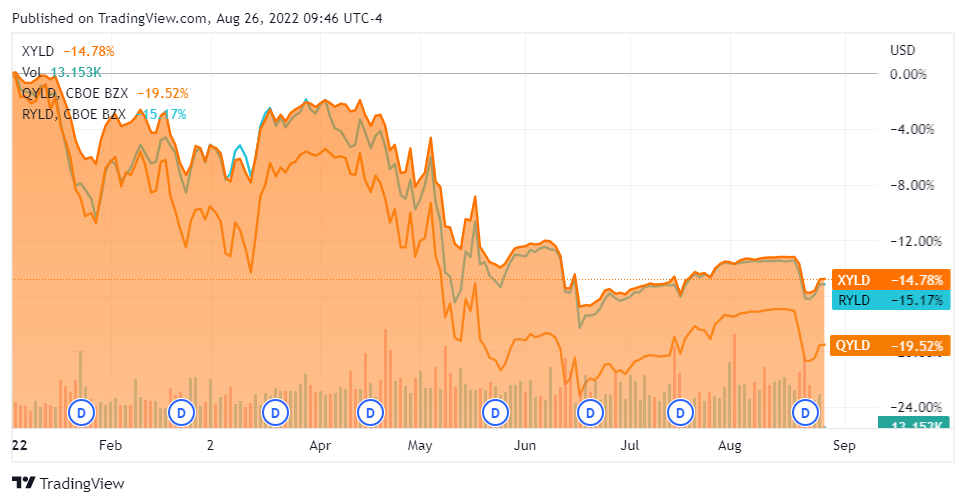
XYLD has been the least volatile from Global X’s Covered-Call ETFs
Global X has three main Covered-Call ETFs, which include the Global X Russell 2000 Covered-Call ETF (RYLD), QYLD, and XYLD. Global X also released the Dow 30 Covered-Call ETF (DJIA), but with only a few months of data, I will not include it in my analysis. From a pure capital appreciation standpoint based on an initial investment, XYLD has been the least volatile compared to QYLD and RYLD. Looking at these funds together from a YTD perspective, XYLD has declined by -14.78%, while RYLD is down -15.17%, and QYLD has declined the most as it’s down -19.52%. XYLD and RYLD from a percentage basis have traded at a similar trajectory recently, but there were points over the winter where the volatility was enhanced in RYLD. Overall the markets have been volatile and in the red throughout 2022, causing many ETFs to follow this trajectory.
Seeking Alpha
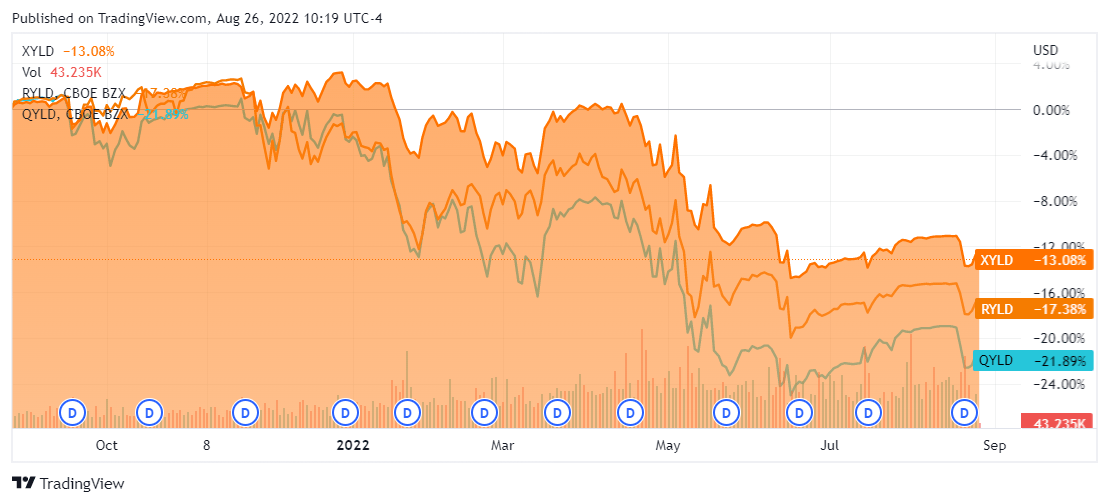
Instead of going back on a YTD basis, if I go back one year, to a point when the market was making new highs at the time, XYLD has declined by -13.08% while RYLD declined -17.38%, and QYLD declined by -21.89%. While these funds track different indices, their premise of writing covered calls to generate monthly distributable income is the same. Without taking the distribution yield into consideration, XYLD has been less volatile than its counterparts through the ups and downs over the previous year.
Seeking Alpha
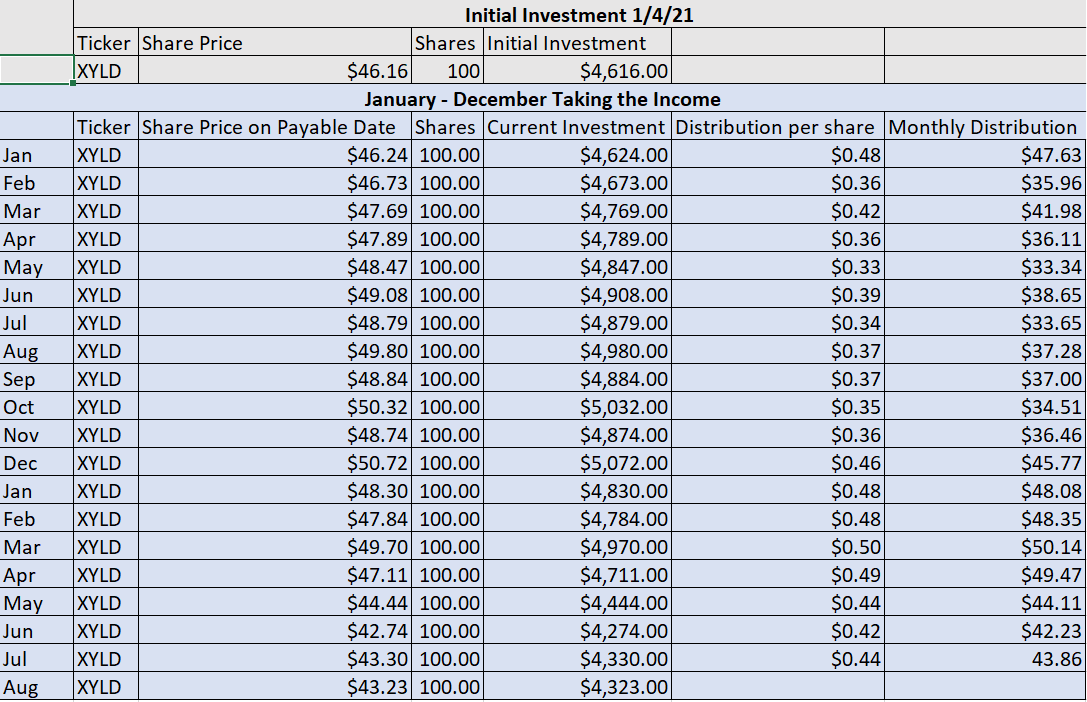
What an investment of 100 shares of XYLD has done since the beginning of 2021 and 2022
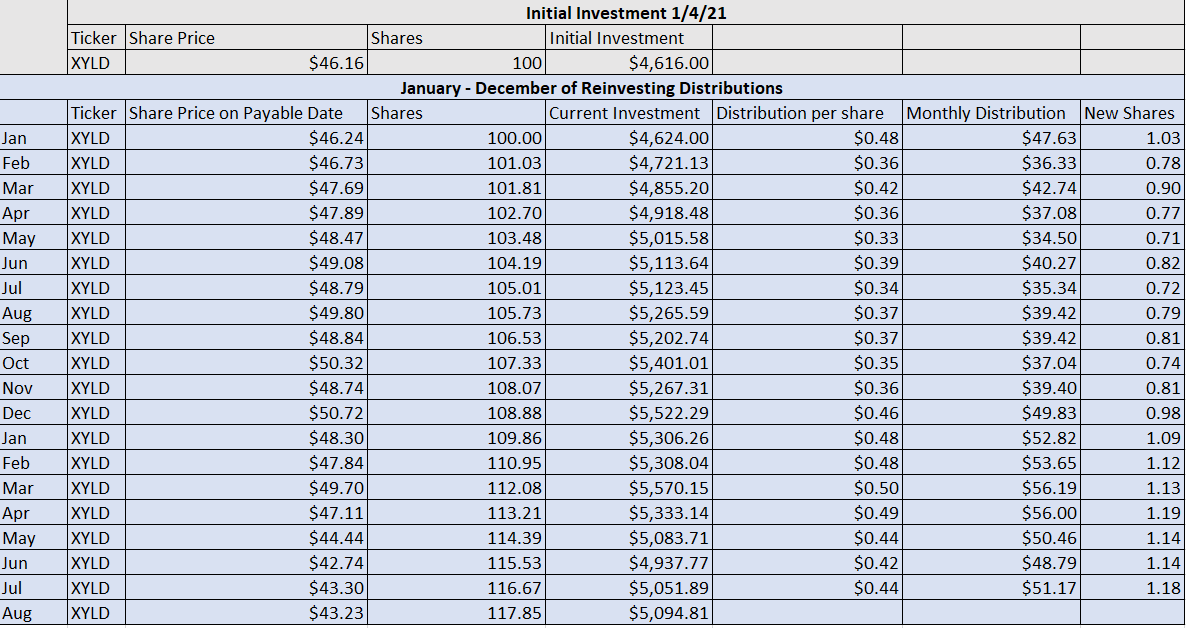
On 1/4/21, shares of XYLD traded at $46.16, so 100 shares would have cost $4,616. This analysis will look at XYLD from two perspectives, taking the distributions as income each month and what would occur if the distributions were reinvested back into XYLD.
Since January 2021, taking distributions as income
Over the course of the past 20 months, shares of XYLD have declined by -$293 or -6.35%. This would value your initial investment at $4,323. Income generation is a critical aspect of XYLD as an investment, and the main driver is investing in Covered-Call ETFs. XYLD has generated and paid out distributable income each month since its inception. Since the beginning of 2021, XYLD has paid out $7.85 per share through its distributions. You would have collected $784.59 in distributable income. This would have created a 17% yield on your initial investment and provided a total profit of $491.59 (10.65%) when the distributions and capital depreciation are netted out. Looking at the Trailing Twelve Months (TTM) of distributions, XYLD’s projected forward annual income would be $517.27, which is a forward yield of 11.21%. Overall, if you’re looking for pure income, these numbers are enticing as you’re not selling off shares and depleting your asset base to generate income.
Steven Fiorillo, Seeking Alpha, Global X
Since January 2021, reinvesting the distributions
The numbers change a bit if you’re reinvesting the distributions in hopes of increasing your future income stream. Since the distributions are being reinvested, your overall share count would have increased by 17.85 shares to 117.85 at the end of July. The current investment would have grown to $5,094.81, which is a profit of $478.81 (10.37%). As your total share count increased monthly, the total distributions paid would increase to $848.10, which is an 18.37% yield on initial capital invested. Each share has produced $5.17 in distributable income over the TTM. The additional 17.85 shares in your asset base will increase the forward annual projected income by $92.35 based on the TTM distributions. Looking forward, the projected annual income generated from the 117.85 shares is $609.62, which is a 13.21% forward yield based on the TTM distribution. By reinvesting the distributions, your yield on invested capital increased by 1.37%, and the forward projected annual income increased by 2%.
Steven Fiorillo, Seeking Alpha, Global X
Since the beginning of 2022 taking the distributions
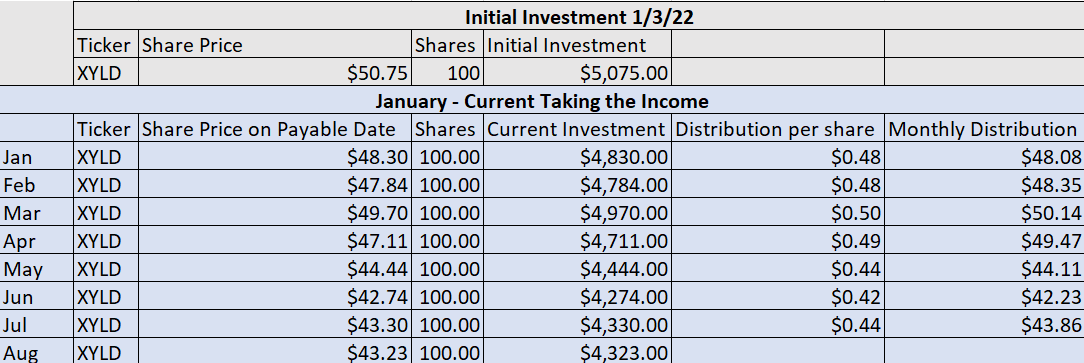
On 1/3/22, shares of XYLD were trading at $50.75, so an initial investment of 100 shares would have cost $5,075. This is what an investment in XYLD would have done. The initial investment would have declined by -$752 (-14.82%) YTD. Over the first seven months of 2022, shares of XYLD generated $3.26 in distributable income. You would have collected $326.24 in income which is a 6.43% yield on invested capital. The total ROI would be -8.39% as you would be in the red -$425.76 after the distributions were netted from capital depreciation. Based on the TTM distribution per share of $5.17, your forward projected income would have been $517.27, which is a 10.19% forward yield on invested capital.
Steven Fiorillo, Seeking Alpha, Global X
Since the beginning of 2022, reinvesting the distributions
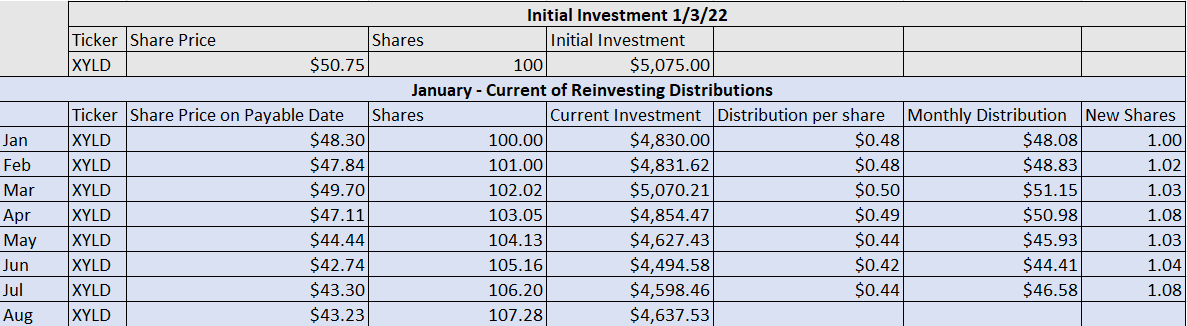
If you decided to reinvest the distributions in 2022 back into XYLD the numbers would look slightly different than if you took the distributions as income. By reinvesting the distributions, your share count would have increased by 7.28 shares YTD. The current investment would be worth $4,637.53, which is a decline of -$437.47 (-8.62%) from your invested capital. Based on the additional 7.28 shares that are now part of your asset base, the annual forward distributable income has increased by $37.64. The new projected annual income based on the $5.17 distributions over the TTM is $554.91, which is a 10.93% yield on invested capital. By reinvesting the distributions, your capital depreciation declined from -14.82% to -8.62%, while you gained an additional $37.64 in projected annual income or 0.74%.
Steven Fiorillo, Seeking Alpha, Global X
Conclusion
The real question that needs to be answered is whether XYLD is a viable investment for investors seeking income? XYLD, along with RYLD and QYLD, are investments that are dedicated to generating income, and the aspects of capital appreciation are minimal. The data I have outlined is what has occurred. Before making any investment in an individual company or fund, investors should define their investment objectives and conduct an adequate amount of research. Income investing is a much different premise than investing for capital appreciation, and while there is no correct answer, there are different vehicles to achieve different goals.
From an income investing perspective, I like XYLD as a vehicle to generate income. There is a premise around investing in an index fund and selling shares to generate income. While, in theory, this could work, you’re depleting your asset base, and the yields on index funds are not large enough to replace those shares over an extended period. Therefore I invest in index funds for long-term capital appreciation and make different investments for income generation. With XYLD, you never have to sell shares to generate income, as it’s paying a monthly distribution. If you look at XYLD as a business, you’re investing capital in order to get paid monthly income, regardless if the price of the asset is fluctuating. XYLD may not be right for everyone, but from an income perspective, its fits within my investment objectives.
Be the first to comment