

Scott Olson/Getty Images News
Looking for more income from the S&P 500? Though the S&P only yields ~1.5%, there are several S&P 500-related ETFs and CEFs with much higher dividend yields.
Profile:
The Global X S&P 500 Covered Call ETF (NYSEARCA:XYLD) seeks to provide investment results that correspond generally to the price and yield performance, before fees and expenses, of the Cboe S&P 500 BuyWrite Index.
It follows a “covered call” or “buy-write” strategy, in which the Fund buys the stocks in the S&P 500 Index and “writes” or “sells” corresponding call options on the same index. The fund has a 0.60% expense ratio. (XYLD site)
Holdings:
XYLD’s top four sectors are Tech, Healthcare, Financial, and Consumer Cyclical, which combine to form ~64% of its portfolio. The biggest overweights vs. the S&P 500 are Tech and Healthcare, while Financials is the most underweighted sector.
Tech had been a great sector to be in over the past several years, but hasn’t been so in 2022, registering a -25.55% YTD performance. Healthcare also is down -11.62%. There’s only one sector in the green so far in 2022 – you guessed it – Energy, which is up over 18%. XYLD’s Energy weighting is 4.36%, vs. the S&P’s 5.85%.
Hidden Dividend Stocks Plus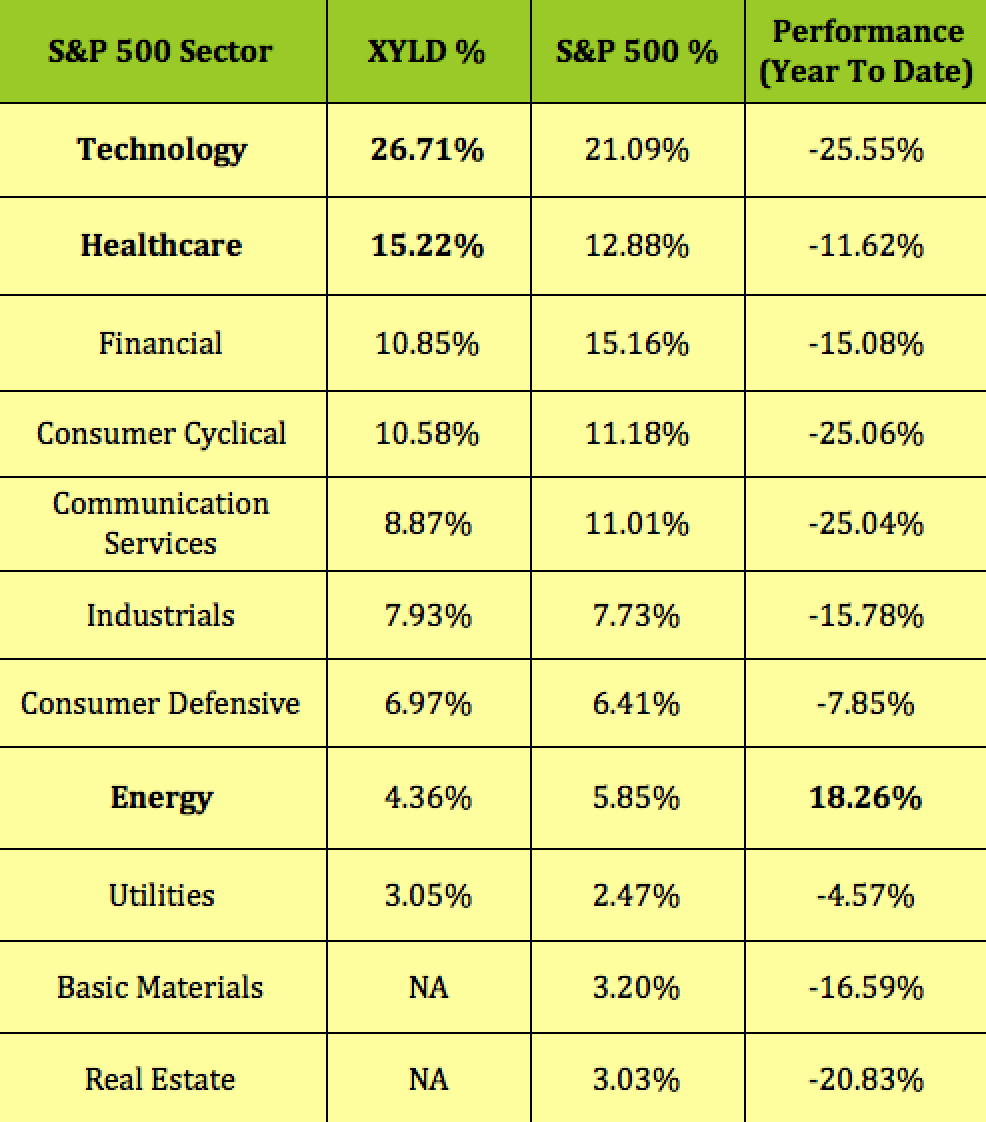
As an S&P 500-based fund, XYLD’s top 10 holdings is comprised of large-cap familiar names, such as Apple (AAPL), Microsoft (MSFT), Amazon (AMZN), and Alphabet (GOOG) (GOOGL):
XYLD Site
Performance:
As of 6/30/22, XYLD had a 7.15% NAV performance since its inception, with a slightly higher 7.25% price performance, a bit lower than its index. It lagged its index over the past one-, three-, and five-year periods:
XYLD Site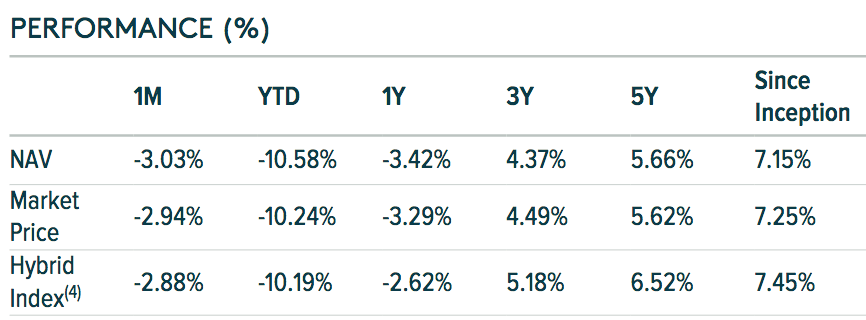
There are several other ETFs and CEFs which also employ a covered call strategy on the S&P 500, in order to generate income.
The Eaton Vance Tax-Managed Buy-Write Income Fund (ETB), a CEF has had the best performance over the past year and so far in 2022, leading these other funds by a wide margin.
XYLD is near the bottom for price performance in 2022, and over the past year, quarter, and month:
Hidden Dividend Stocks Plus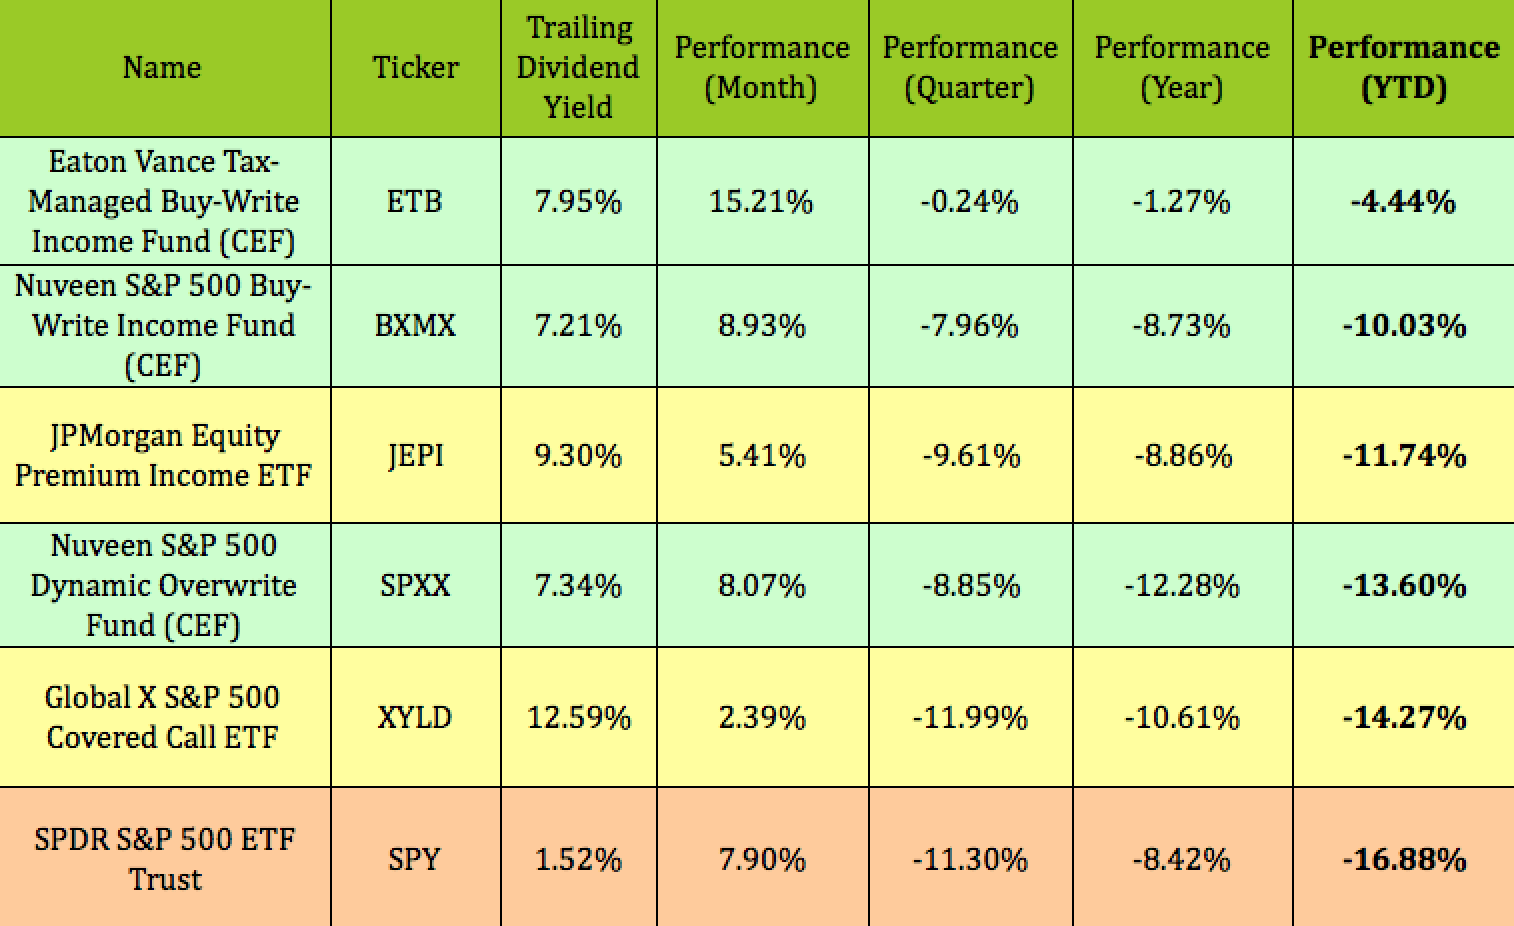
On a total return basis, however, XYLD is in second place, thanks to its high 12%-plus trailing dividend yield, with a ~1.98% total return, vs. 6.68% for ETB, and 6.9% for the S&P 500:
Hidden Dividend Stocks Plus
Dividends:
XYLD pays a variable monthly distribution, which has run from $.3451 to $.5014 over the past 12 months, following the ebb and flow of volatility, and subsequent options pricing.
Seeking Alpha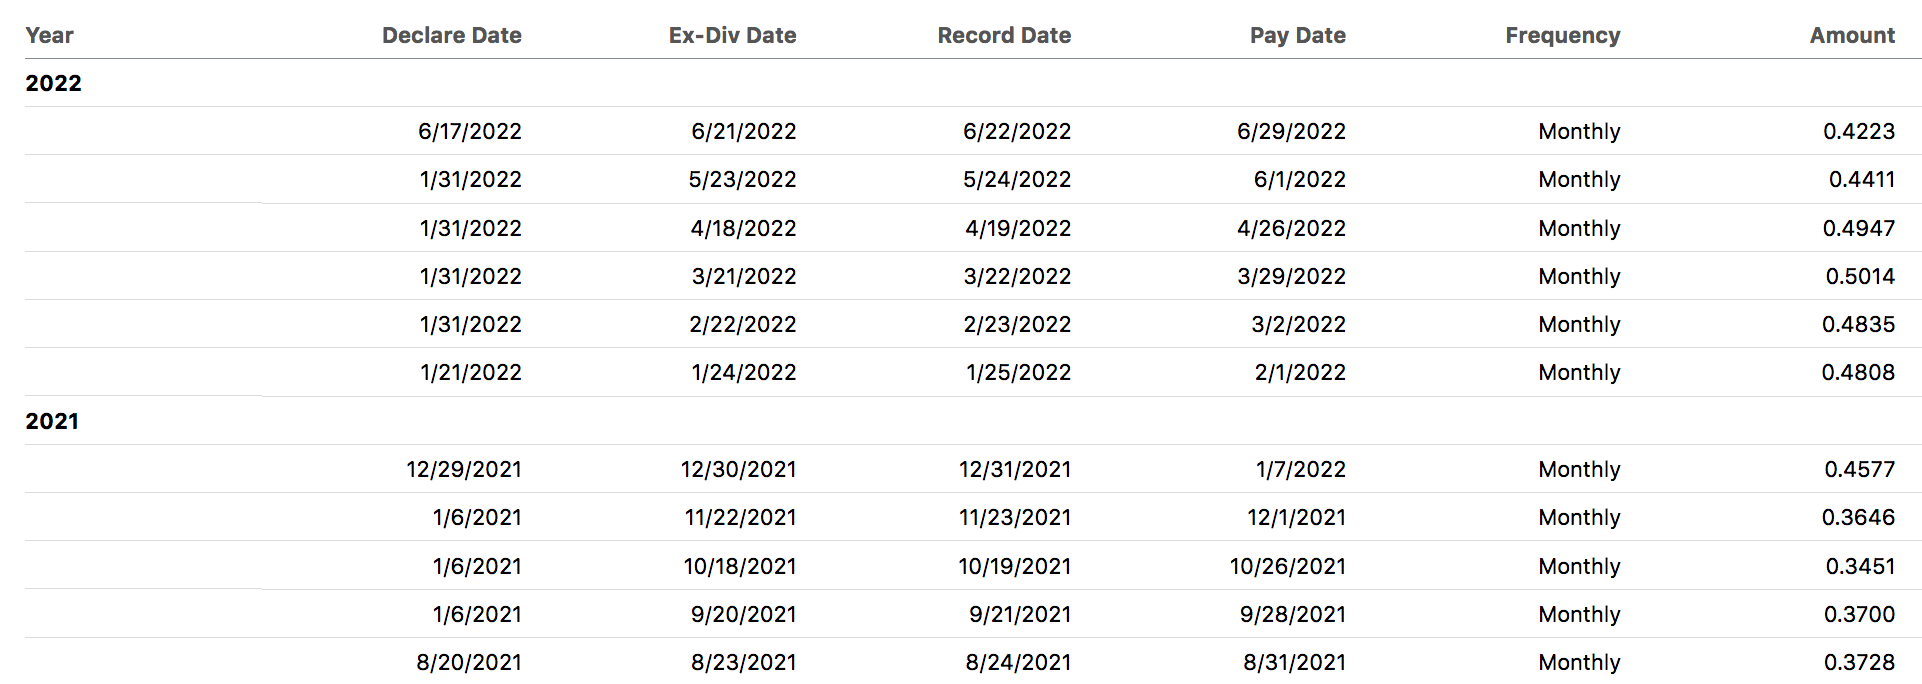
At $43.40, XYLD has a forward yield of 11.68%, based upon its most recent distribution of $.4223. It should go ex-dividend on ~8/23/22, with a ~8/31/22 pay date:
Hidden Dividend Stocks Plus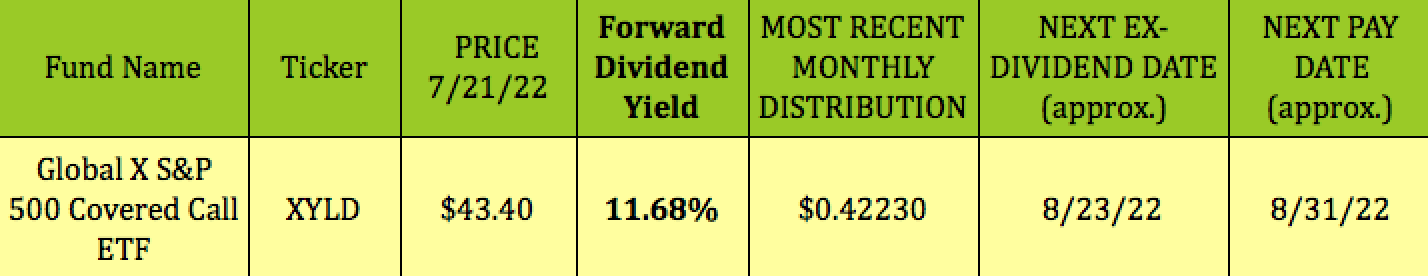
Pricing:
While ETFs such as XYLD and JEPI tend to have small discounts or premiums to their underlying NAVs, CEFs such as EBT, BXMX, and SPXX can have much wider discounts or premiums. A useful strategy when buying CEFs is to try to buy them at deeper discounts or lower premiums than their historical averages.
As of the 7/20/22 close, all three of these CEFs, ETB, BXMX, and SPXX, were trading at higher premiums than their one-, three-, and five-year averages, with ETB having the highest premium to NAV.
Hidden Dividend Stocks Plus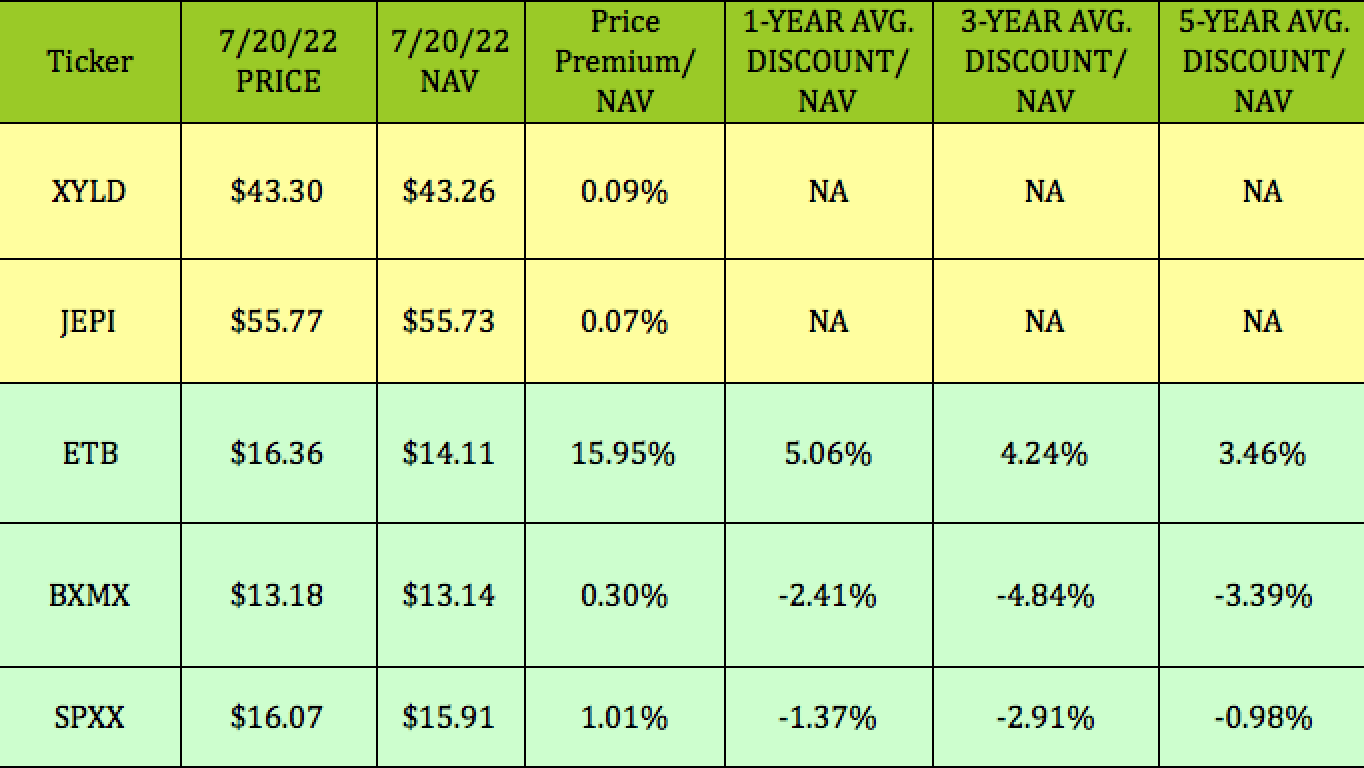
Parting Thoughts:
If you think that the S&P 500 is going to rebound in the second half of 2022, now may not be the best time to buy XYLD as its price performance will lag the market. On the flip side, if your outlook is bearish, XYLD can offer you some downside protection.
All tables by Hidden Dividend Stocks Plus, except where otherwise noted.
Be the first to comment