

sturti/E+ via Getty Images
Introduction & Key Facts
The SPDR S&P Retail ETF (NYSEARCA:XRT) is an exchange-traded fund designed to track the performance of the S&P Retail Select Industry Index (XRT’s benchmark). Per SPDR, sub-industry exposures that XRT is exposed to include:
Apparel Retail, Automotive Retail, Computer & Electronic Retail, Department Stores, Drug Retail, Food Retailers, General Merchandise Stores, Hypermarkets & Super Centers, Internet & Direct Marketing Retail, and Specialty Stores
XRT is a small, niche fund, with $271.77 million in assets under management as of September 22, 2022. The gross expense ratio is reported as being 0.35%, which is not cheap but reasonable in line with XRT’s sector-specific strategy. XRT had 97 holdings as of recent, which makes the fund fairly well diversified considering its focus, with an estimated three- to five-year earnings growth estimate of 6.80%, and a price/earnings ratio of 8.64x per SPDR, or a consensus 8.99x on a forward basis. The dividend yield is 1.26% on a 30-day SEC yield basis.
The price/book ratio was 2.03x as of recent, implying (together with the price/earnings ratio) a forward return on equity of 22.58%, which is good. The largest holding represented just 1.31% of the fund as of September 22, 2022, making the fund well diversified also on a compositional basis.
Equity Valuation
Using the above key data, and assuming that the return on equity ticks down to about 15% after about five or six years, my model assumes no buybacks and a constant dividend distribution rate, and arrives at a fairly high implied IRR. The model assumptions also factor in the higher forward price/earnings ratio (driven by consensus analyst estimates predicting forward one-year earnings declines in aggregate).
Author’s Calculations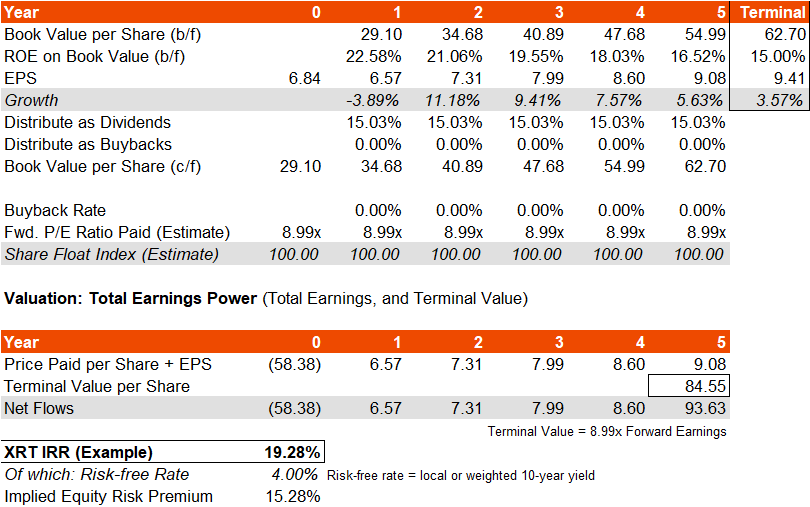
The implied equity risk premium is a large 15.28%, although adjusted for XRT’s historical beta of 1.45x, this could be viewed alternatively as 10.54% on a risk-adjusted basis; still very generous. On the surface, XRT looks undervalued. The fund had fallen by over 30% vs. the S&P 500 since Q1 2021.
TradingView.com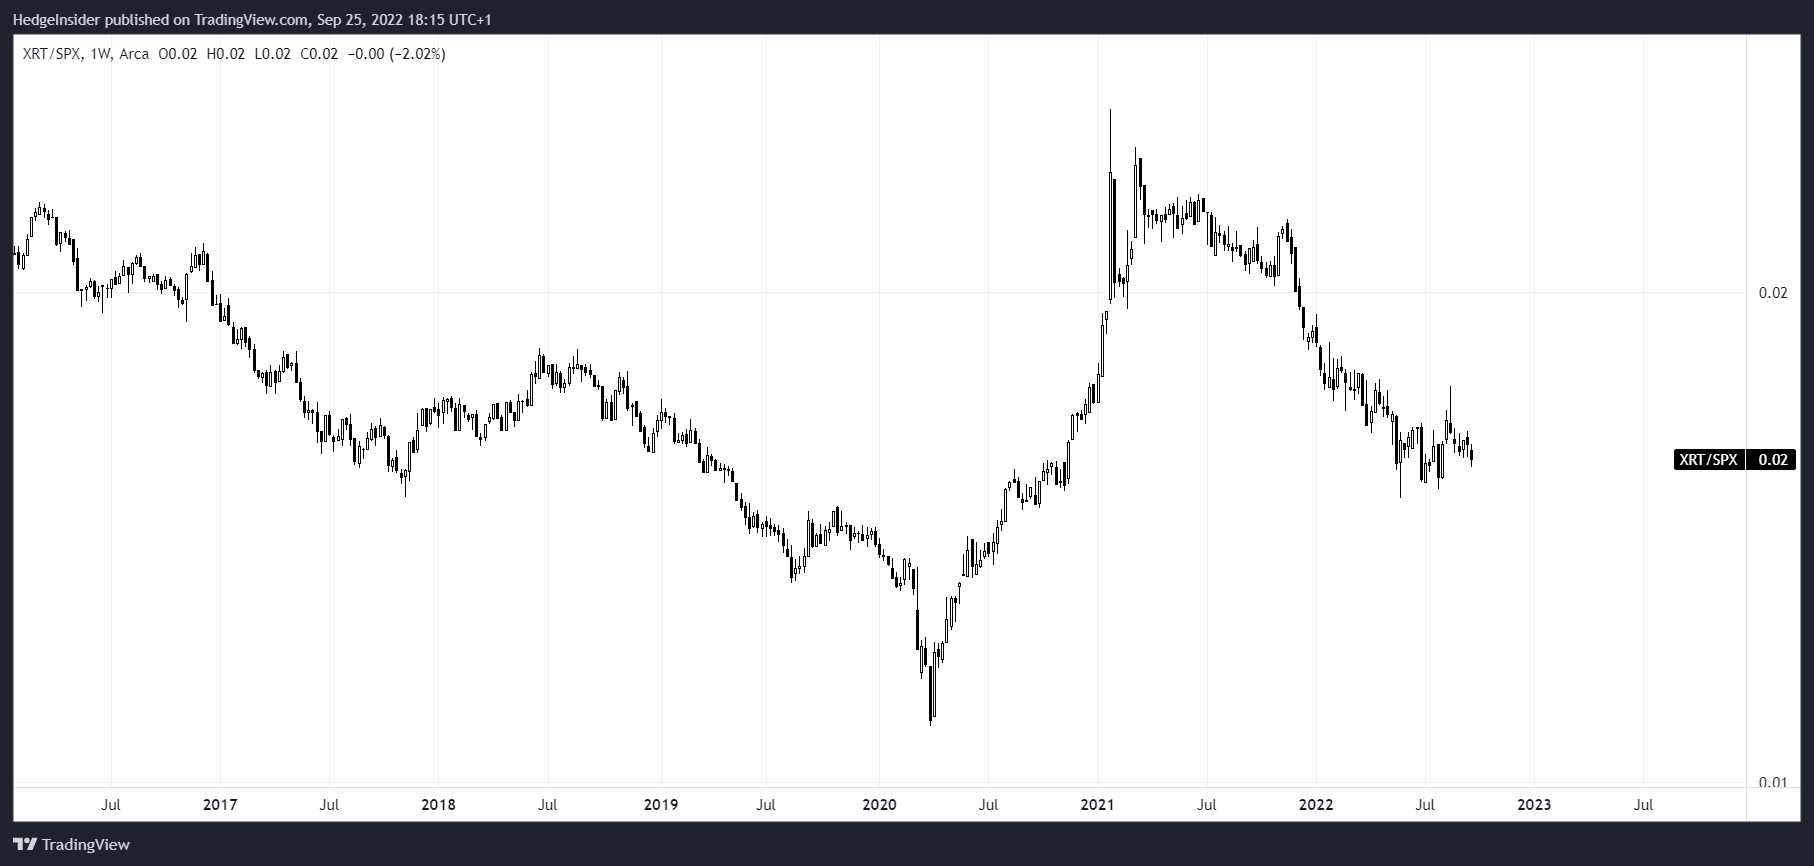
So, it does seem possible (given the fund’s price history) that XRT could revert upward. The fund has shown a capacity in the past to beat the S&P 500 (a popular benchmark for U.S. equity investors). The high equity risk premium embedded in the price seems to support that. My model assumptions were somewhat arbitrary, but nicely fall under the consensus analyst estimates for three- to five-year average earnings growth of 6-7%; my model assumes roughly 5-6%. A more protracted near-term earnings recession would clearly make XRT far less attractive.
Having said that, if I were to change our ‘year two’ earnings growth rate from +11.18% to -10% (signalling a deeper and longer earnings recession), my average earnings growth rate over the next five years would be close to zero, while my embedded ERP would fall to a still-high 6.83% (on a beta/risk-adjusted basis). Therefore, I would say that XRT earns a ‘tick’ on valuation regardless of the short-term economic environment.
Behavioral Model
XRT’s inception was on June 19, 2006, which means there is plenty of price history to create a multiple linear regression. My MLR model below forecasts a decline over the next three months or so; I have constructed bands based on historical volatility of the fund over the past year (re-rated on a three-month basis). My model is based on well over 100 inter-market relationships.
Author’s Calculations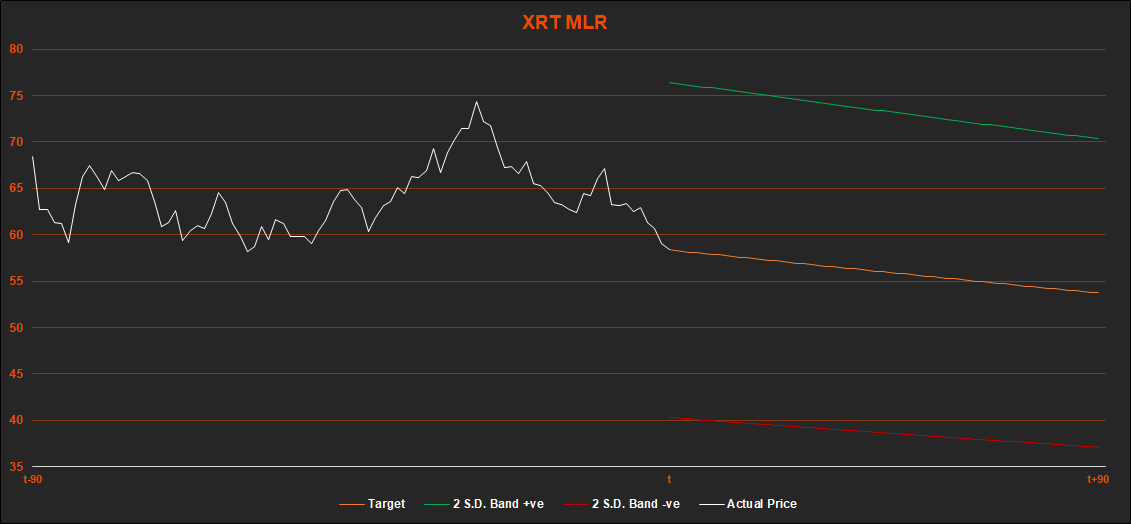
XRT is going to correlate positively with risk-on activity, like most of the rest of the equity markets. In this case, some negative drivers include energy prices (trending upward), a stronger U.S. dollar, and generally higher commodity prices (besides energy). Retail businesses tend to struggle in inflationary environments, so it makes sense that XRT has under-performed over recent years as inflation has picked up. If/when inflationary pressures abate, the floodgates for XRT out-performance should open.
However, based on the MLR model above, some caution is warranted in the near term. The base forecast is gunning for a decline of about -8% over the next 90 days; however, anything could happen, it is only a bias.
Rates & Credit
Currently, the United States is in a monetary hiking cycle, with the U.S. Federal Reserve having last raised rates another 75 basis points to a range of 3.00-3.25% in its last meeting held on September 21, 2022. As inflationary pressures remain, the Fed has not yet “pivoted” to a pause, let alone to cutting rates. Therefore, the current regime remains, which is negative for stocks.
BIS data tells us that the U.S. credit impulse was negative by -5% in Q1 2022, and this is a leading indicator. Across both rates and credit, the environment is tough/unfavorable.
Business Cycle
Fidelity research provides us with the approximate business cycle positioning of the United States as of Q3 2022.
Fidelity.com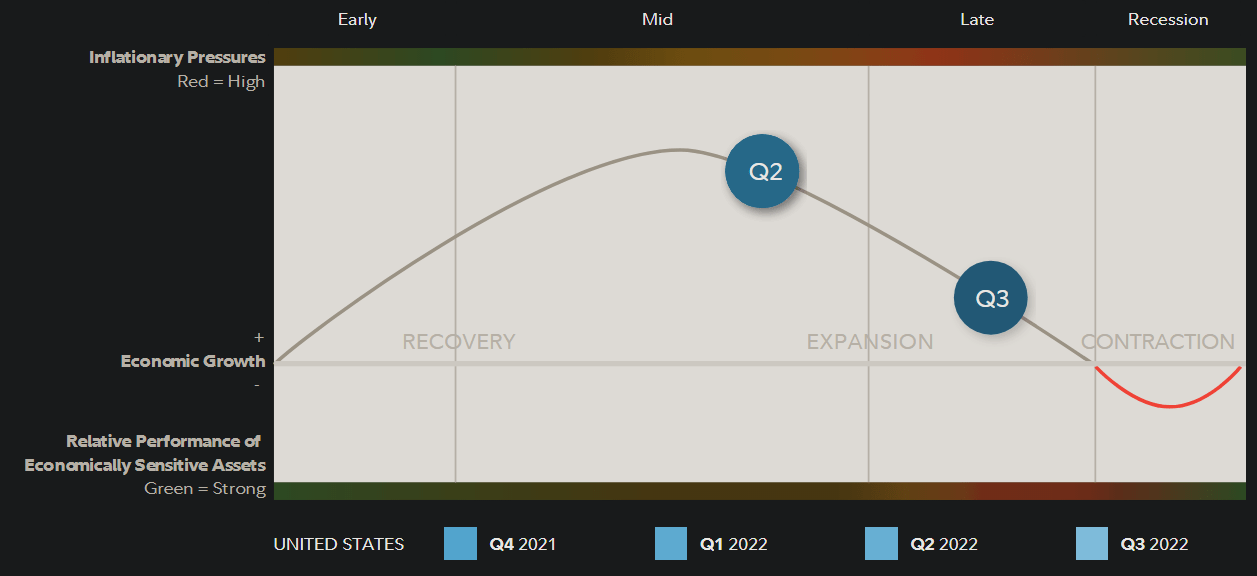
XRT is therefore also going to have to struggle through the latter stages of the business cycle, likely into a recessionary period over the coming 12 months or so. This is negative for stocks in general, but also for consumer spending. So, both on a tactical three-month basis, and on a twelve-month cyclical basis, it is more than possible that XRT will continue to under-perform the S&P 500. However, as equity markets tend to lead the real economy, it is perhaps possible that XRT will rebound over the next three to six months. A current retest of XRT’s recent lows around $57/share might represent the beginning of a bottom formation process.
Foreign Exchange
The U.S. dollar has rallied in recent times, which as mentioned earlier (per my MLR model) tends to correlate negatively with XRT. Indeed, USD tends to inversely correlate with all risk assets. Per the ‘dollar smile’ theory, the U.S. dollar can appreciate in times of both U.S. out-performance and global contraction and/or global risk aversion, and it would seem that the latter situation is applicable at present. The U.S. current account is in fact deeply negative, however.
TradingEconomics.com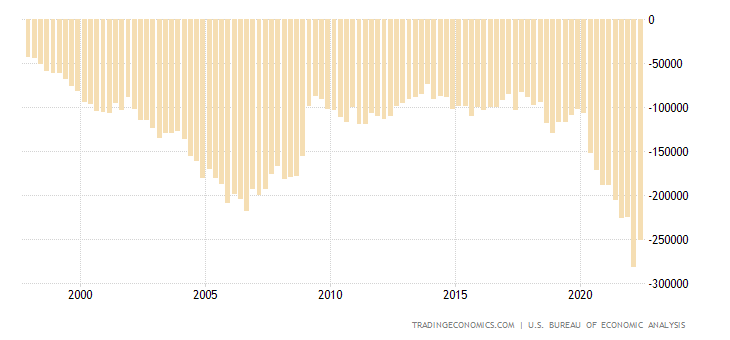
This is a signal of USD over-valuation, even relative to the past 20 years. The second most-liquid currency is the euro; The Economist’s Big Mac Index suggested the euro was overvalued on a GDP-adjusted basis by 4.2% in July 2022. Since then, the euro has fallen by about 5%. So, the USD is probably at fair value on a ‘purchasing power parity’ basis. But on a current account basis, I would imagine there is potential for USD weakness; only a reversal and removal of current risk aversion is required to kick-start the new trend.
The U.S. dollar is bound to turn at some point, but I see no catalysts for immediacy here, and therefore there is no rush to buy into XRT (or equities more broadly) on this basis alone. More happily though, I think that on a fair-value basis, USD should not have too much further to run on the upside, and so this should help to support a rebound in risk markets if/when inflationary pressures ease more sustainably.
Summary
In summary, XRT seems to be undervalued on an intrinsic earnings power basis, but an unfavorable macro and market environment makes it difficult to recommend buying XRT at this current juncture.
Author’s Summary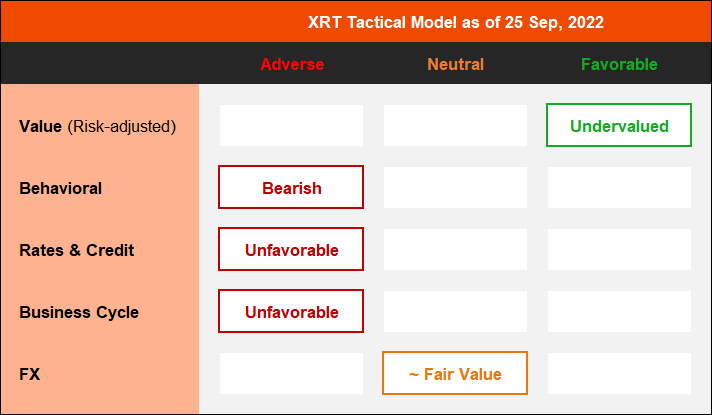
However, a bearish stance would not be appropriate, given the likely under-valuation. I would remain neutral for the time being, but watching for a possible bottom formation; this will likely correlate with the rest of the equity market. The only concern I say, on a relative performance basis, is that consumer spending may get hit harder first in a recessionary scenario vs. business spending (at least initially). Therefore, we may see the S&P 500 rebound first before XRT. Once XRT rebounds/follows, it is possible we could out-performance, but this might not be until the U.S. is already within some kind of universally-recognized recession (or at least moderate downturn).
Be the first to comment