

grandriver
A guest post by Ovi
Typically, the POB posts have a theme. However, due to EIA schedule changes for issuing their reports and missing EIA reports, this post contains oil production updates for several Non-OPEC countries, plus the September DPR report. The country updates come from a combination of official country websites and news articles.
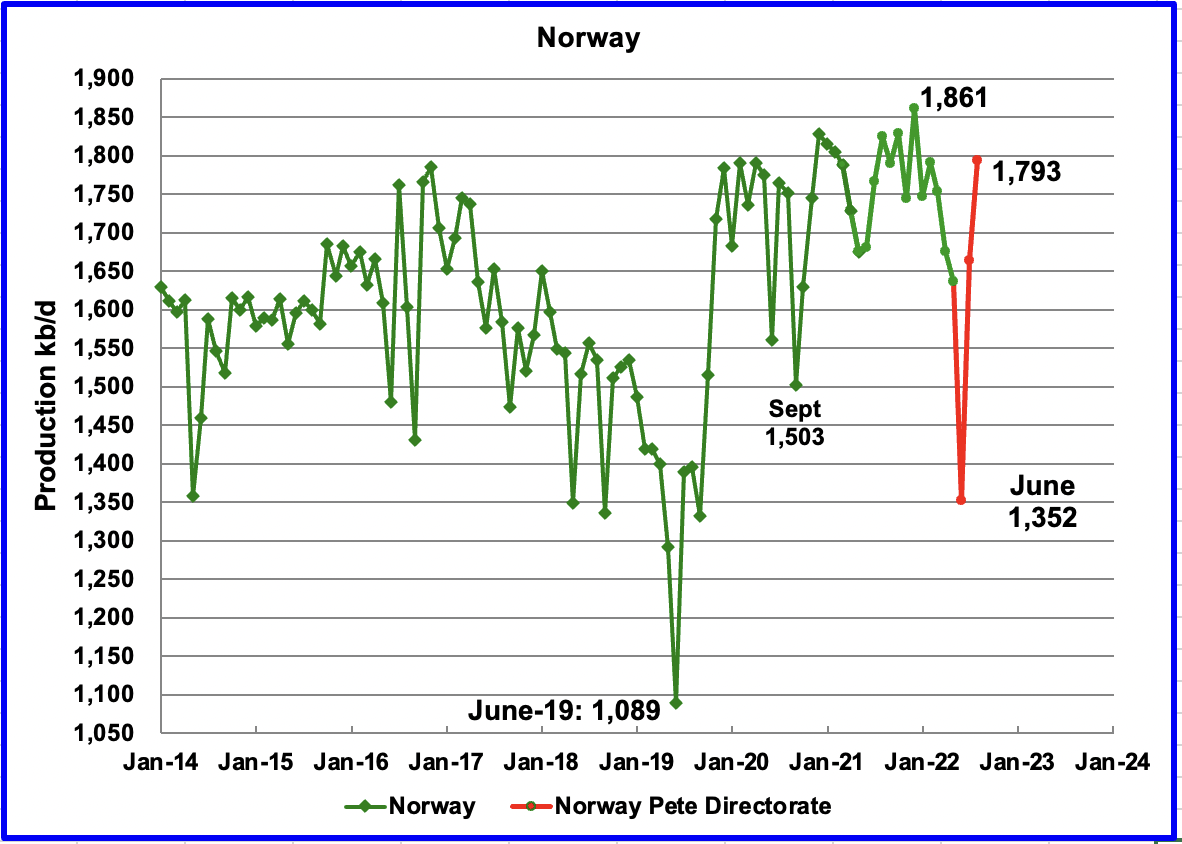
The Norway Petroleum Directorate (NPD) reported that production rebounded from June to July to 1,664 kb/d and then rose to 1,773 kb/d in August. (Red markers.). According to the NPD: “Oil production in August was 3.1 percent lower than the NPD’s forecast and 4.7 percent lower than the forecast so far this year.”
The rebound from the June low is due to the end of summer maintenance and possibly the start up of the second phase of the Johan Sverdrup field along with some other small fields.
According to OPEC: “For 2022, production growth is expected to decrease by 43 tb/d y-o-y to average 2.0 mb/d. Norwegian liquid output dropped by 12% in 2Q22 to 1.74 mb/d, mainly because of maintenance at offshore platforms. In addition to some small start-ups, growth is expected in 4Q22, following the return from maintenance and second-phase production start-up of the Johan Sverdrup field.
For 2023, Norwegian liquids production is forecast to grow by 0.24 mb/d, unchanged from the previous month, to average 2.2 mb/d. Plenty of projects, from small to large, are scheduled to ramp up in 2023 in the Njord, Nova, Ringhorne, Alvheim, Oseberg and Snohvit fields. However, Johan Sverdrup is projected to be the main source of increased output for the year, making up roughly 35% of total Norway’s crude and condensate output.”
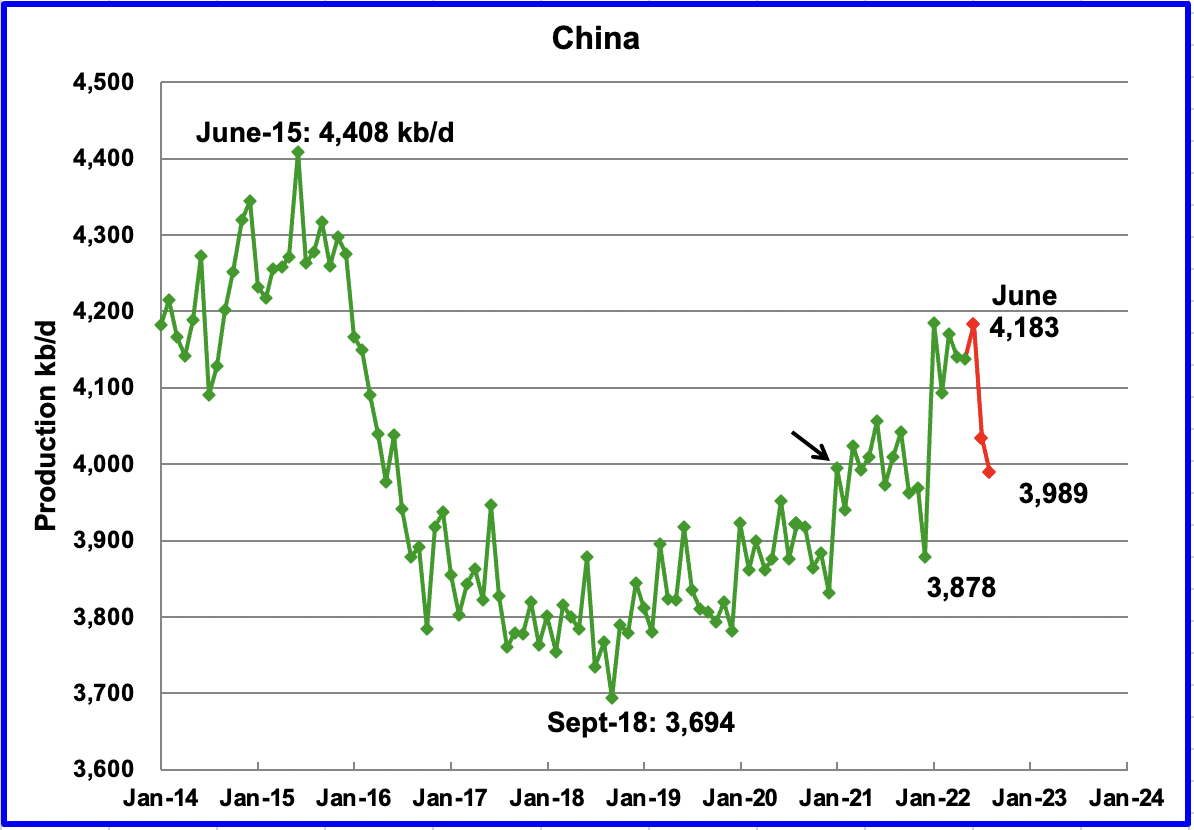
China reported that its output decreased in August to 3,989 kb/d, a drop of close to 200 kb/d from June. (Red markers)
China may be close to its current maximum production level of close to 4,000 kb/d. To offset declines, the national oil company is investing in conventional wells and also drilling for Shale Oil. See Below.
According to OPEC: “Natural decline rates are expected to be offset by the Chinese national oil company’s considerable investments. Tianjin, Xinjiang, Heilongjiang, and Shaanxi were the main producing provinces in the first half of the year. Chinese companies expect additional growth through more in-fill wells and enhanced oil recovery (EOR) projects.
For 2023, y-o-y growth of 30 tb/d is forecast for an average of 4.5 m/d, with Bozhong 29-6, Wushi 17-2 and Kenli 10-1N planned to come on stream under the China National Offshore Oil Corporation (CNOOC). At the same time, ramp-ups are expected from the Changqing, Jilin and Liaohe projects, which are managed by Petro China. The new projects will slightly offset declines from the mature onshore production base.”
According to this source, China’s CNOOC has found shale oil in its South China Sea exploration well for the first time.
“CNOOC believes that the Beibu gulf contains 8.76 billion barrels of shale oil, and claimed that the wildcat well flowed 20 cubic metres/day (m³/d) (125.8 b/d) of shale oil and 1,589m³/d (56,092 ft^3/d) of natural gas, which the Chinese oil giant is calling a commercial discovery.”
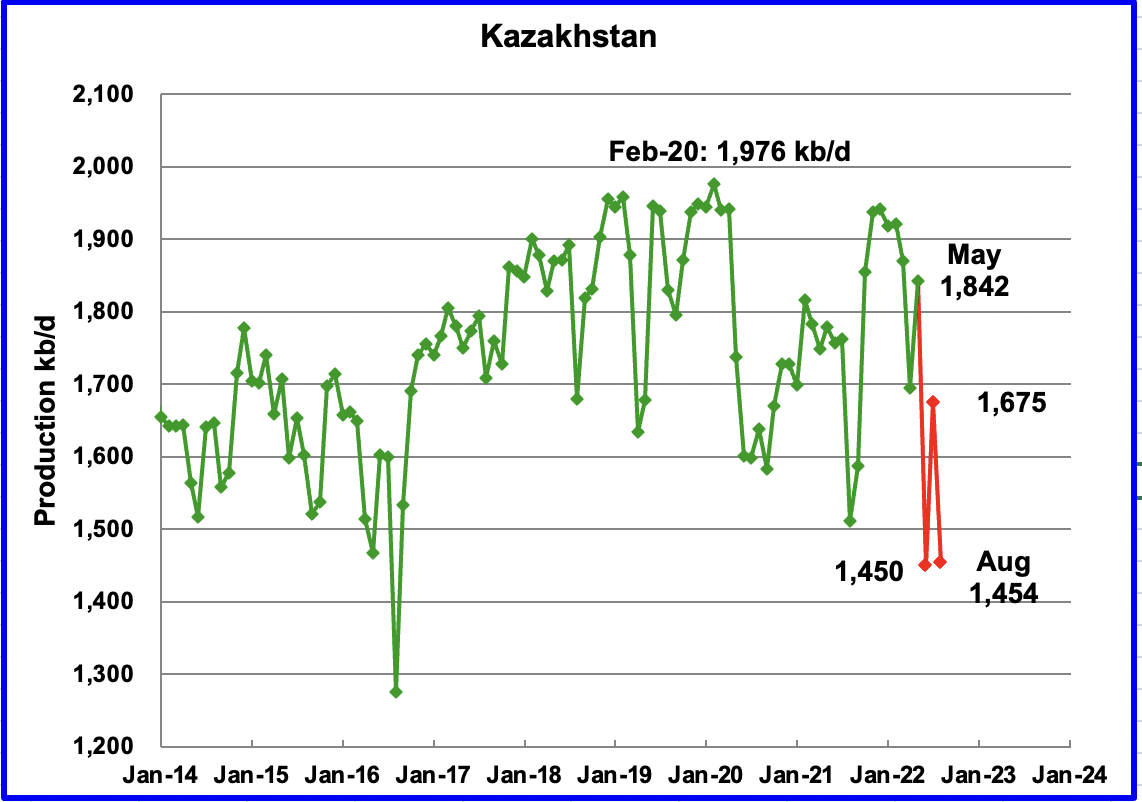
According to this source, August production fell after rebounding in July. The article just reports Crude oil production. Consequently the August number shown in is an estimate based on the percentage drop and a typical C + C to C ratio using earlier EIA data.
“The fall in output was due to a sharp decline in production in the giant Kashagan oil field after a gas leak early in August, as well as planned output curbs in the Tengiz field due to regular maintenance.”
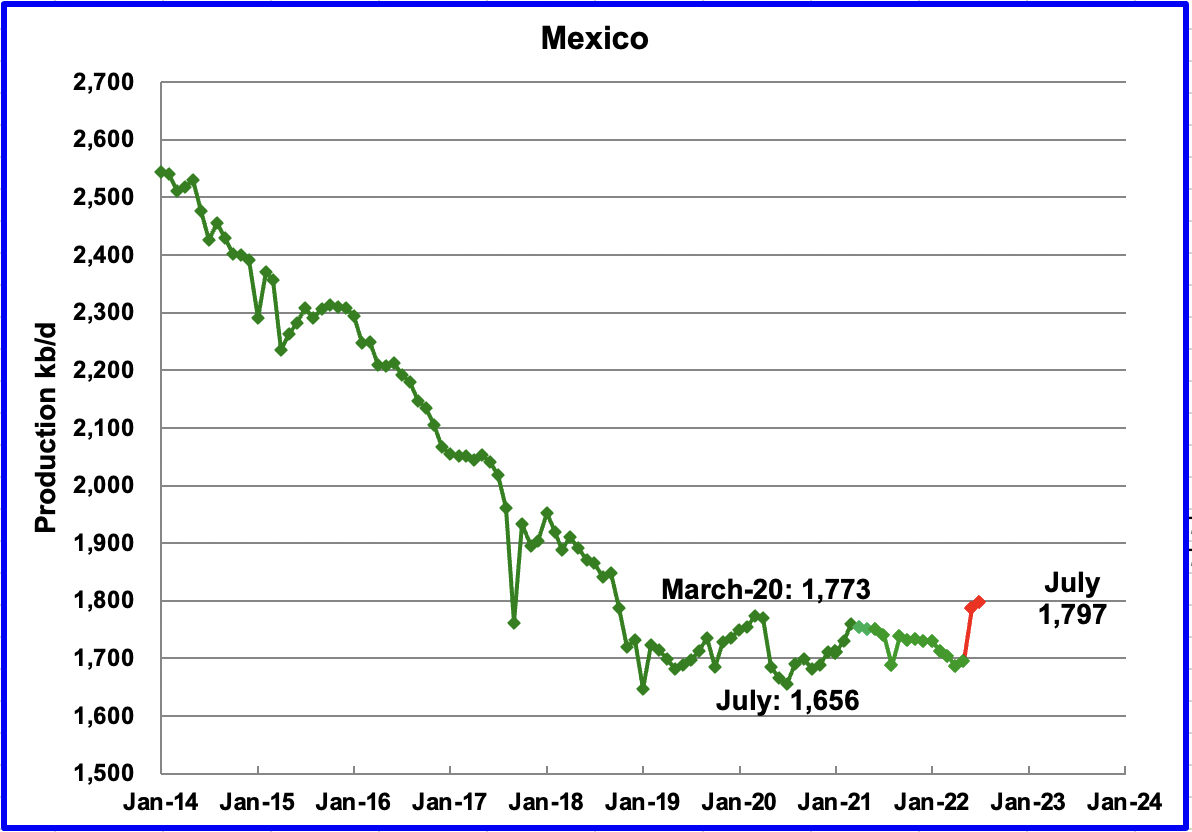
Mexico’s oil production increased by 10 kb/d in August to 1,797 kb/d. This is the third increase since May. Note that the red markers will be reduced by the EIA by close to 80 kb/d. Pemex reported production for May was 1,775 kb/d. The EIA reduced it to 1,695 kb/d, a reduction of 80 kb/d, due to a different definition for C + C.
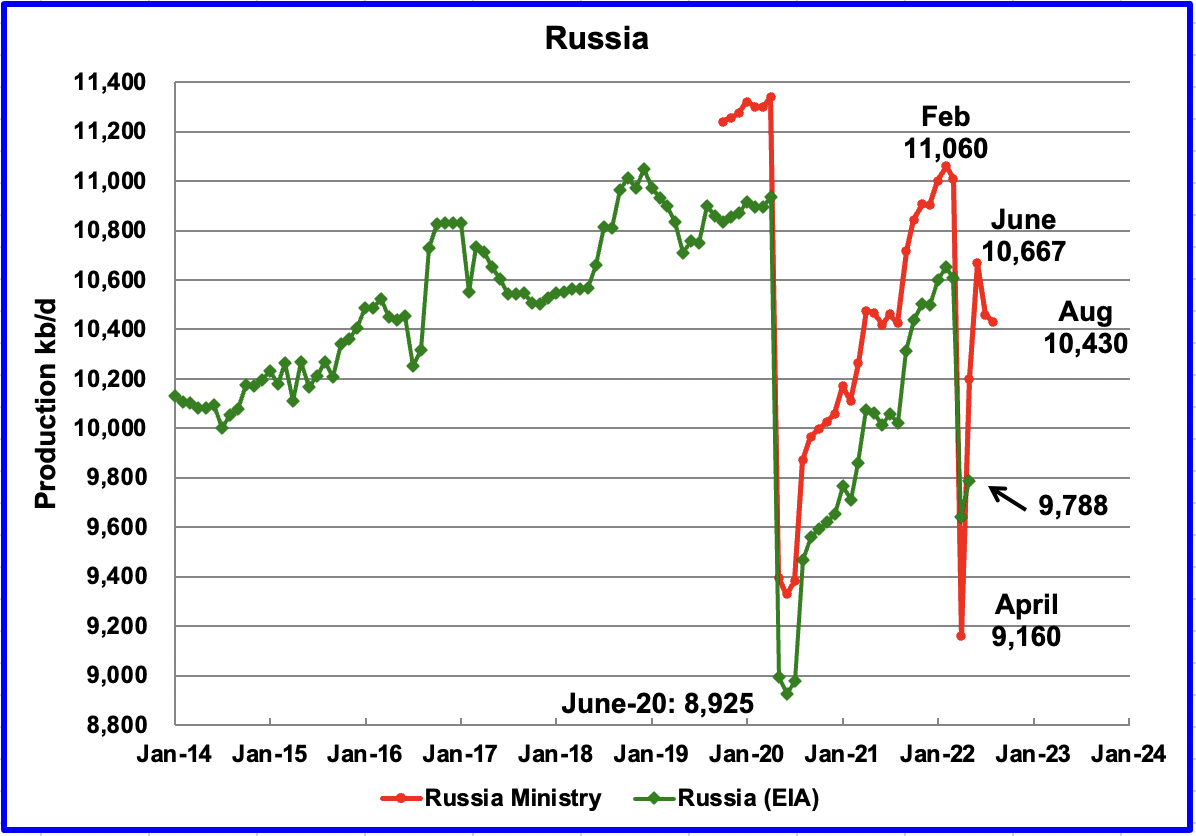
According to this source, August production fell by 30 kb/d from July’s output of 10,460 kb/d to 10,430 kb/d. In addition, this source revised down the original June output from 10,760 kb/d to 10,667 kb/d, a downward revision of 93 kb/d.
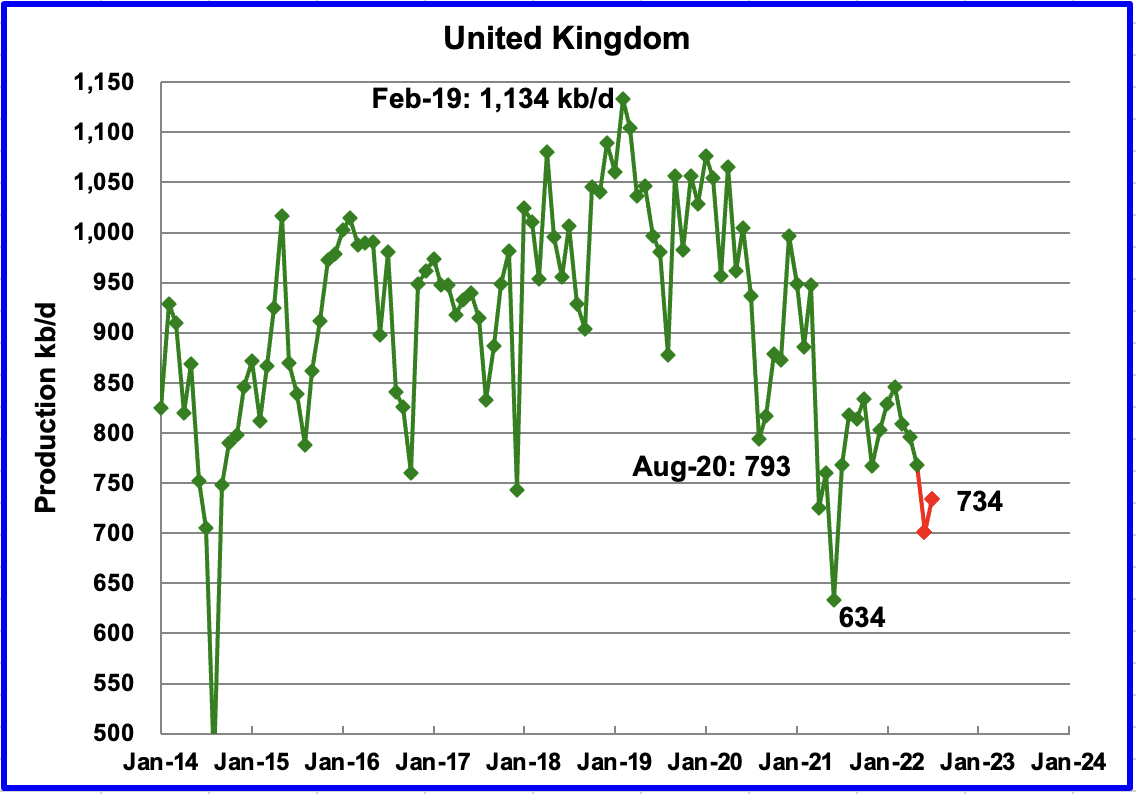
According to this source, UK production dropped in May to 701 kb/d and then rebounded in July to 734 kb/d. Clearly UK production is in decline.
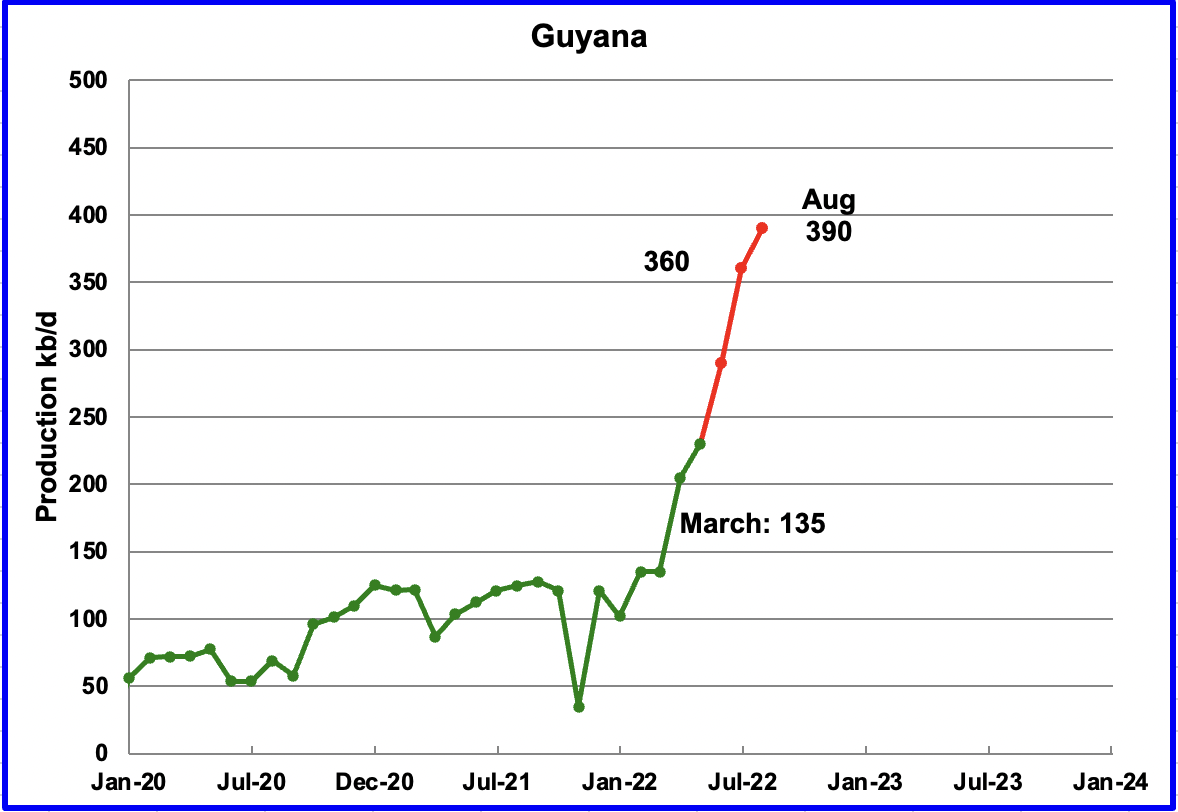
Guyana added an additional 30 kb/d of production in August to reach new high of 390 kb/d. According to the chart below, the operating companies appear to be ahead of schedule on production.
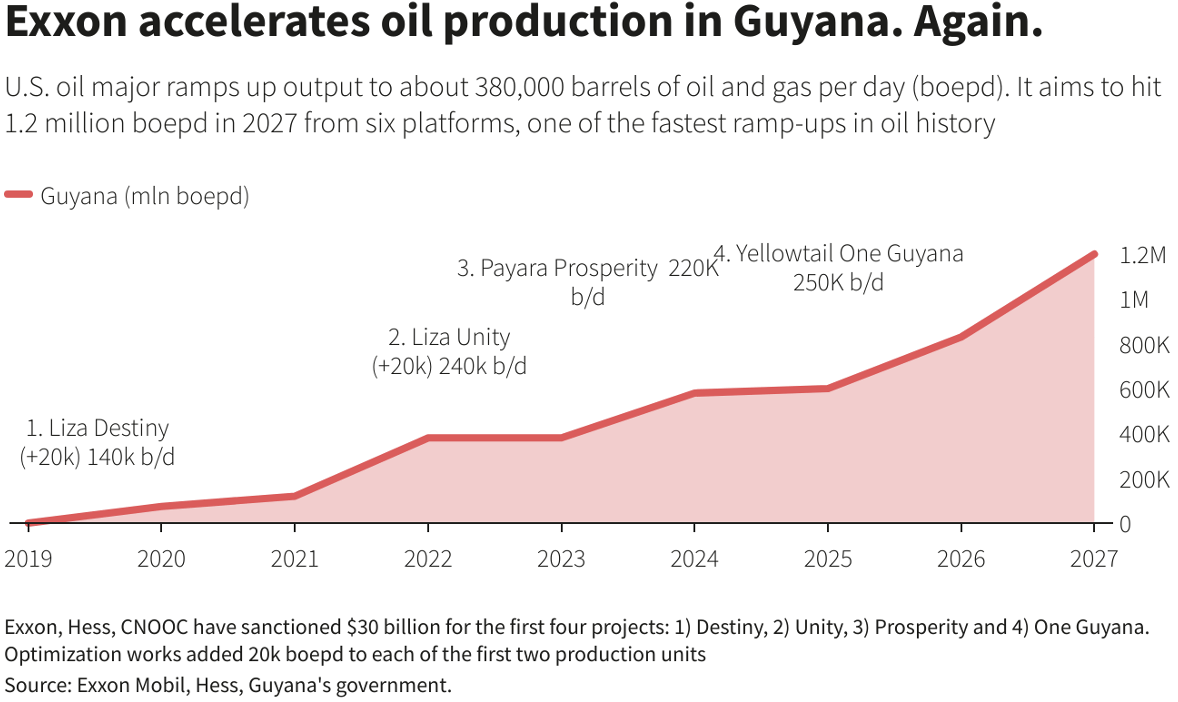
Guyana production schedule.
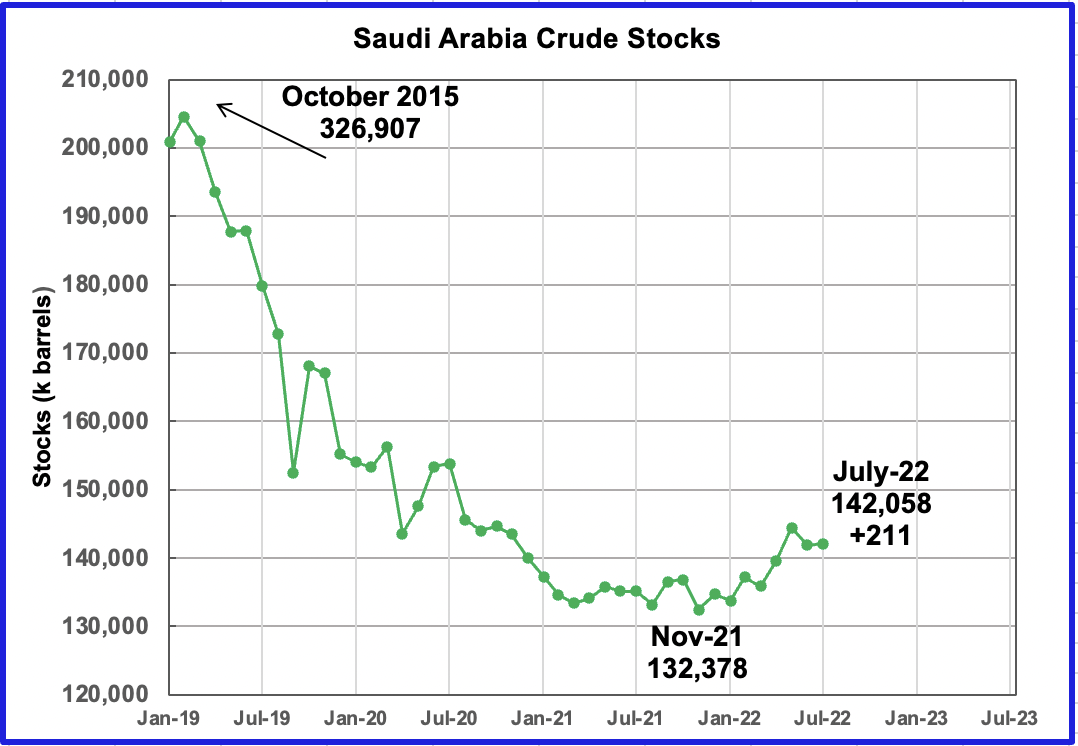
This chart shows Saudi Arabia’a oil stocks starting in 2019. In October 2015, SA had 326 million barrels in storage. Between then and January 2019, their stocks were reduced by 126 M barrels. During most of 2021, stocks bounced around 132 M barrels. In 2022, they have slowly risen to 142 M barrels in July
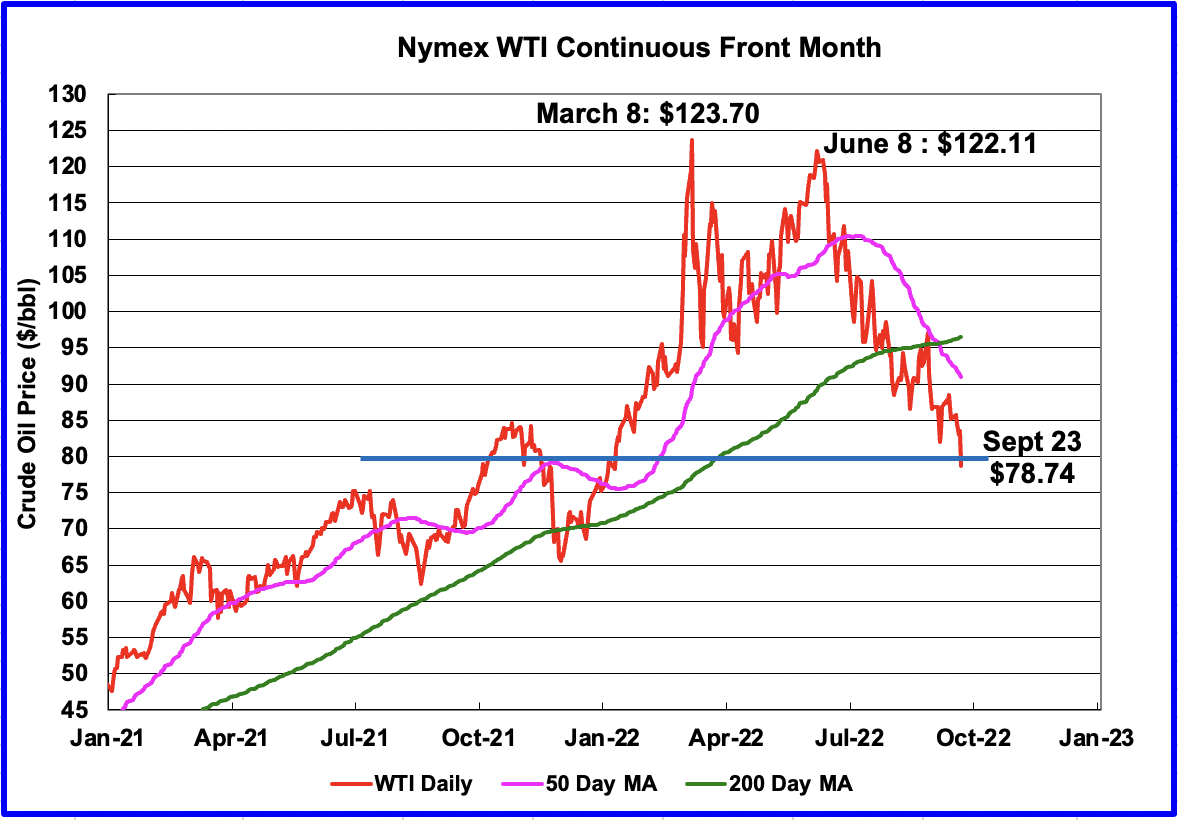
On September 23, 2022, WTI settled below the psychological level of $80/b. OPEC has stated that $80/b Brent is a fair price for both producers and consumers. More recently, some OPEC spoke persons have indicated their preferred level has drifted up to $90/b.
Rigs and Fracs
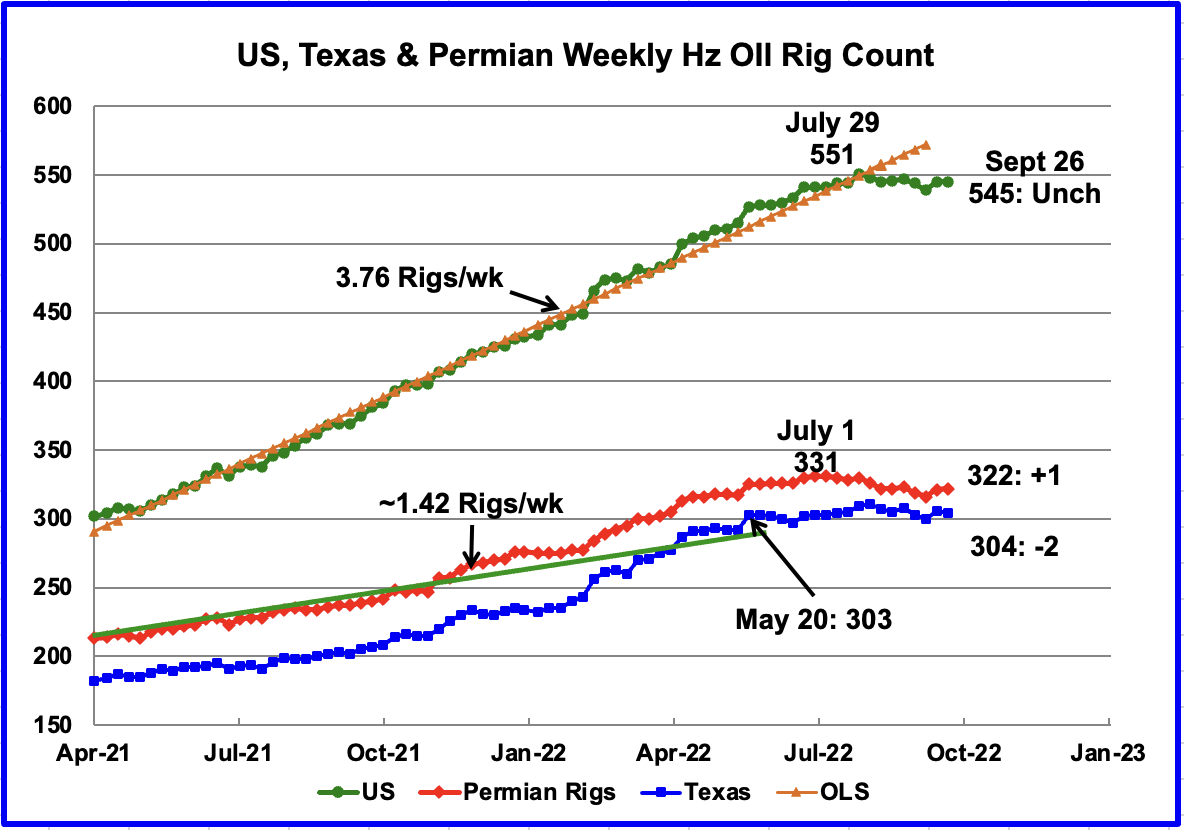
The rig story continues to be that the US Rig count has been holding steady at close to 545 rigs for the past seven weeks. In the week ending September 26, the rig count was unchanged from the previous week at 545. That was down six rigs from July 29 when 551 were operating.
The Permian rose by 1 rig to 322 and is down 9 rigs from a high of 331 on July 1. Note that 59% of the Hz rigs are located in the Permian.
Texas dropped by 2 to 304 and is essentially unchanged relative to May 20 when 303 were operating.
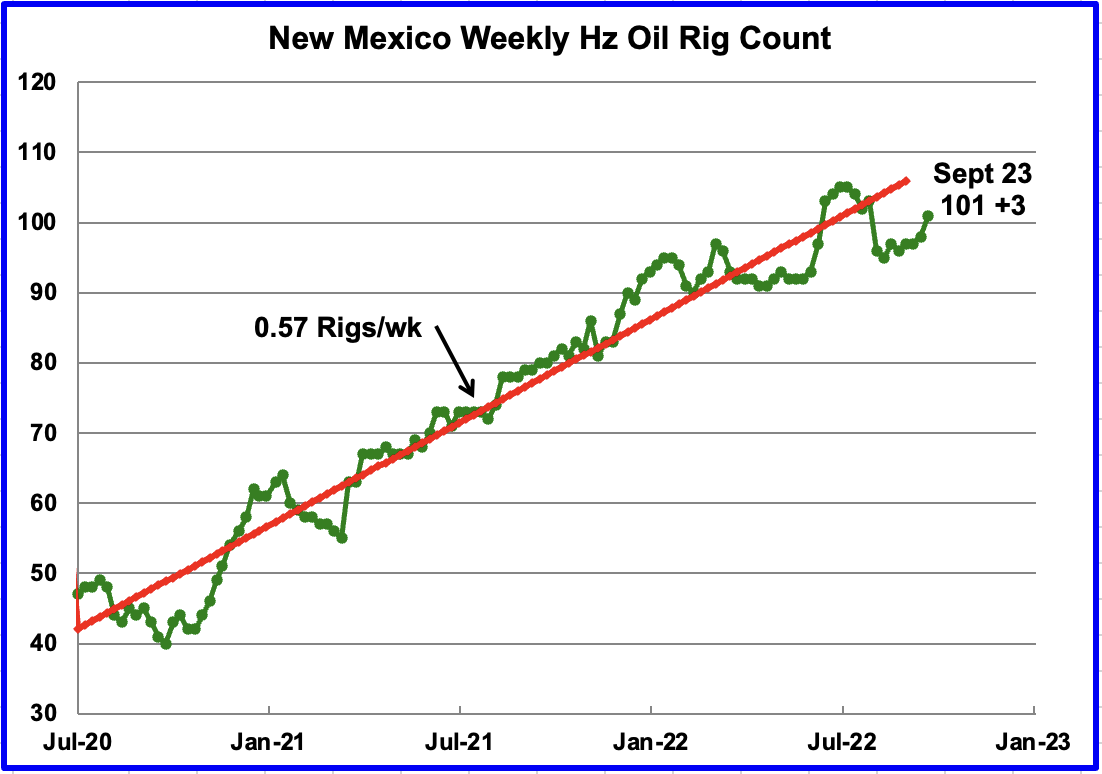
After New Mexico dropped 7 rigs in the first week of August to 96, the rig count has slowly increased to back above 100 to 101. The general trend in the New Mexico Permian has been to add an average of 0.57 rigs per week. This contrasts with the overall Permian trend shown above which has been in a slight down trend.
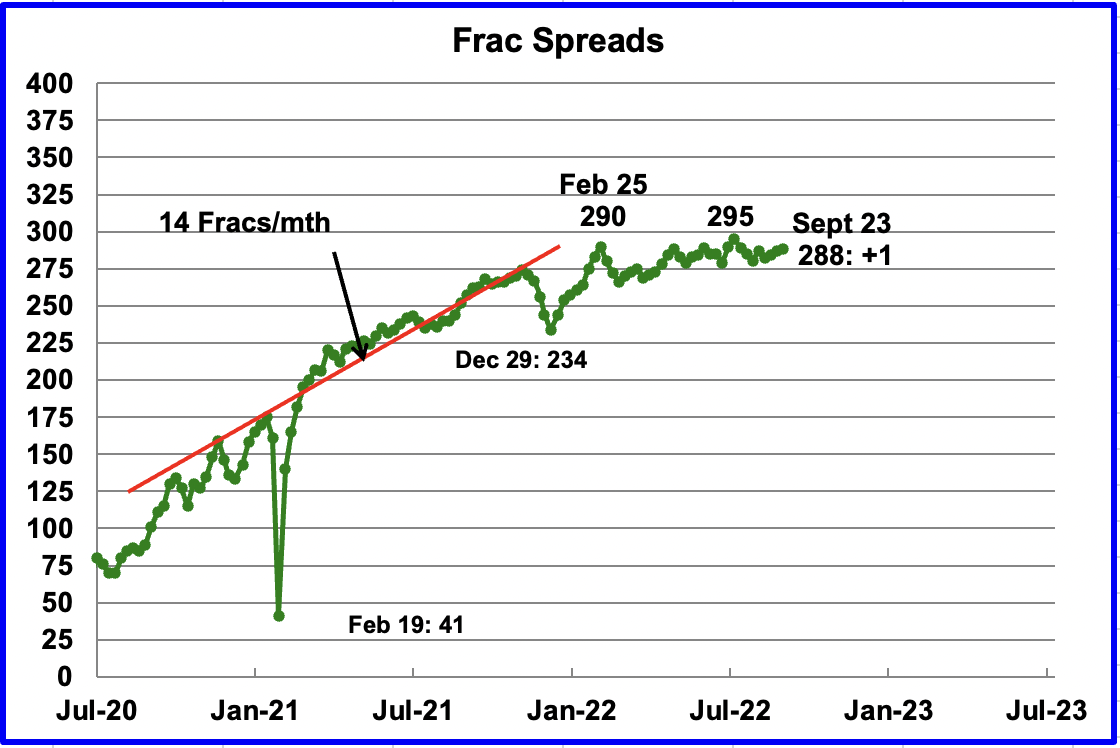
Frac spreads have not shown any growth over the last six months. A high of 290 was reached on February 25 and was not surpassed till July 29, 295. For the week ending September 23, 1 frac spread was added for a total of 288.
Drilling Productivity Report
The Drilling Productivity Report (DPR) uses recent data on the total number of drilling rigs in operation along with estimates of drilling productivity and estimated changes in production from existing oil wells to provide estimated changes in oil production for the principal tight oil regions. The September DPR forecasts production to October 2022 and the following charts are updated to October 2022.
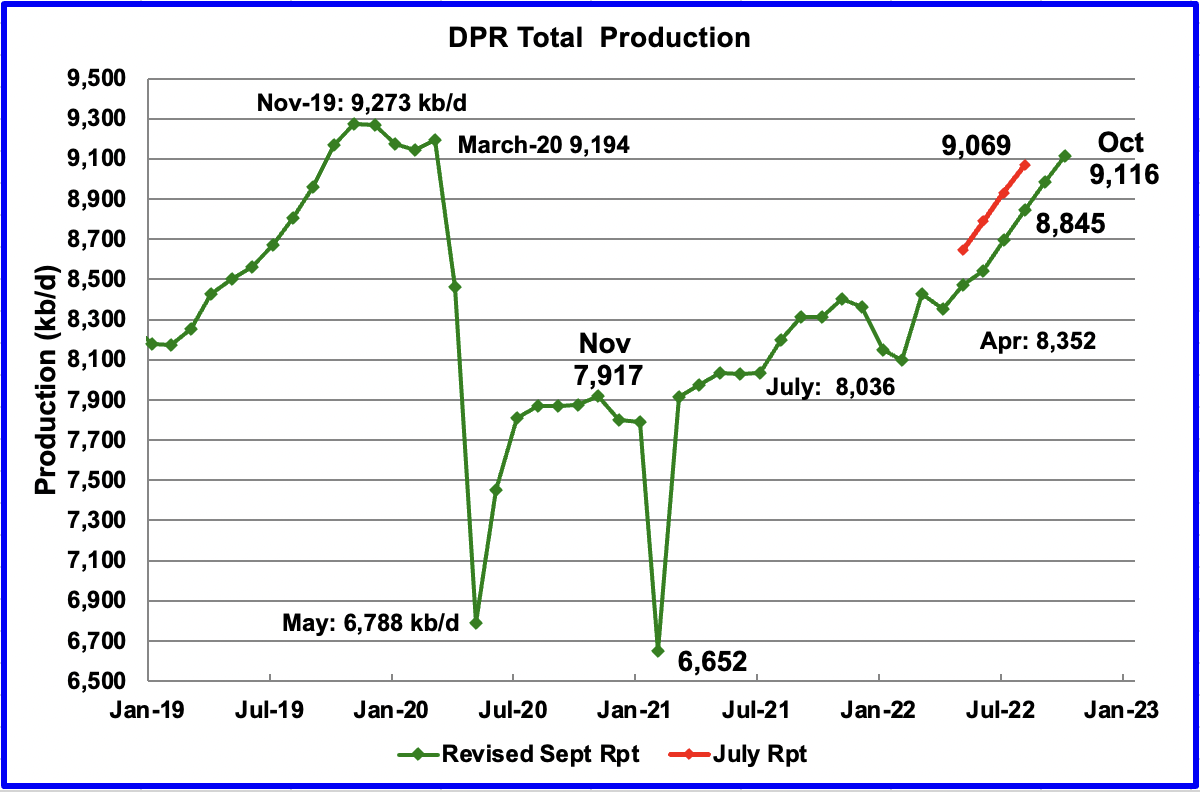
Above is the total oil production projected to October 2022 for the 7 DPR basins that the EIA tracks. Note that DPR production includes both LTO oil and oil from conventional wells.
The September DPR report has downwardly revised the April to September production forecast. The original forecast for August 2022 was 9,069 kb/d. The revised estimate for August is 8,845 kb/d, a downward revision of 224 kb/d. Of the 224 kb/d, 59 kb/d can be attributed to the DPR revising the Bakken April output down by 59 kb/d due to the April/May storm.
The DPR is projecting that oil output for October 2022 will increase by 132 kb/d to 9,116 kb/d. From April’s output of 8,352 kb/d to October’s 2022, output in the DPR basins is forecast to increase by 764 kb/d or by an average of 127 kb/d/mth.
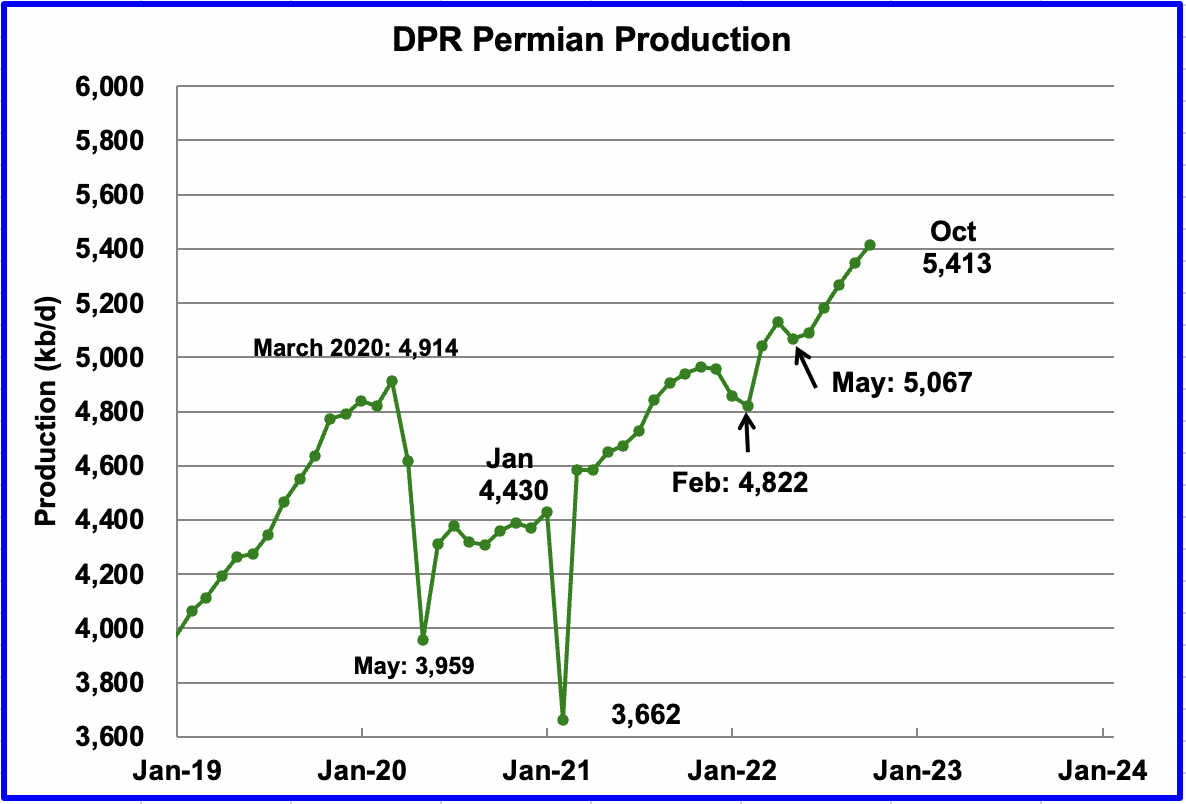
Permian output continues to increase. In October, production is expected to increase by 66 kb/d to a new high of 5,413 kb/d. From May to September, production is forecast to increase by 346 kb/d or at an average rate of 69.2 kb/d/mth. If the Permian were part of OPEC, at 5,413 kb/d it would be the second largest producer after Saudi Arabia.
During August, 416 wells were drilled and 435 were completed in the Permian. (Note that August is the latest data for DUC info). The completed wells added 378 kb/d to August’s output for an average of 870 b/d/well. The overall decline was 292 kb/d which resulted in a net increase for Permian output of 86 kb/d. Of the 435 completed wells, 336 were required to offset the decline. The completion of 19 extra DUCs over the drilled wells contributed 16.5 kb/d of the overall 86 kb/d increase.
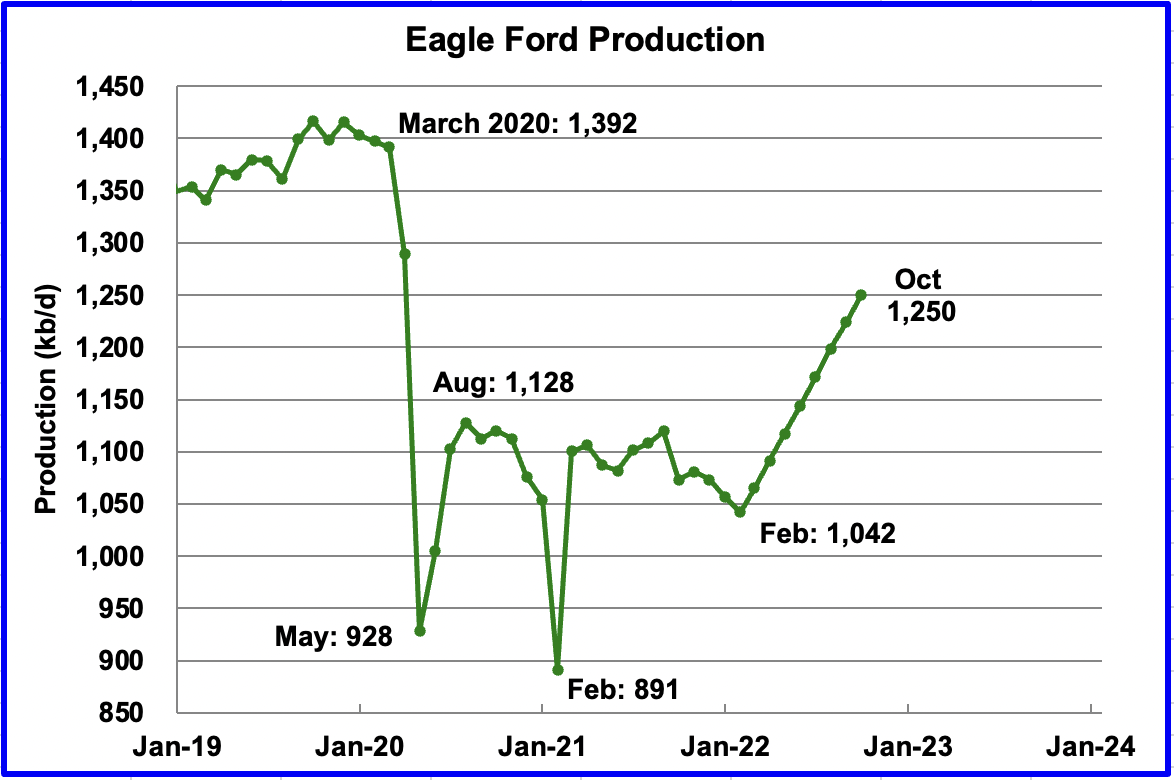
Output in the Eagle Ford basin has been showing an increasing trend since March 2022. For October, output is expected to increase by 26 kb/d to 1,250 kb/d. At the beginning of the year, 43 rigs were operating in the EF. As of September, 66 are operational and accounts for the increasing production.
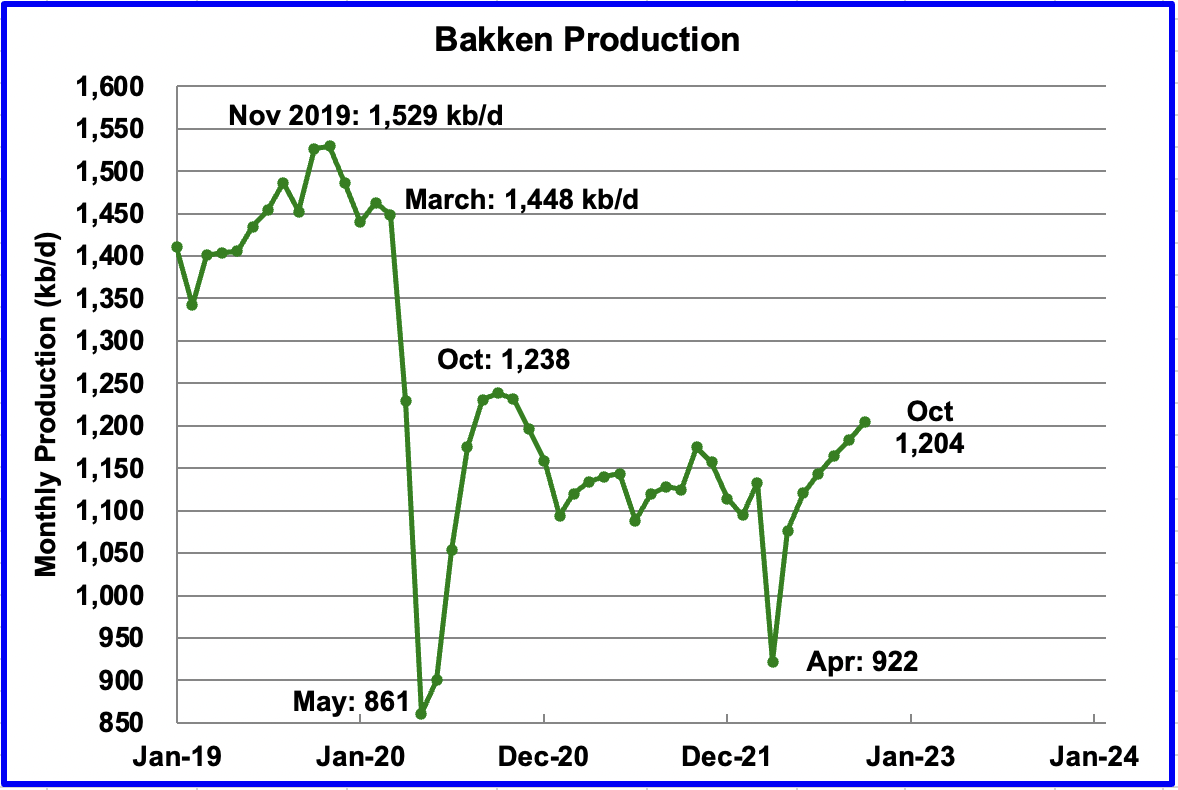
The DPR forecasts Bakken output in October to be 1,204 kb/d an increase of 21 kb/d from September.
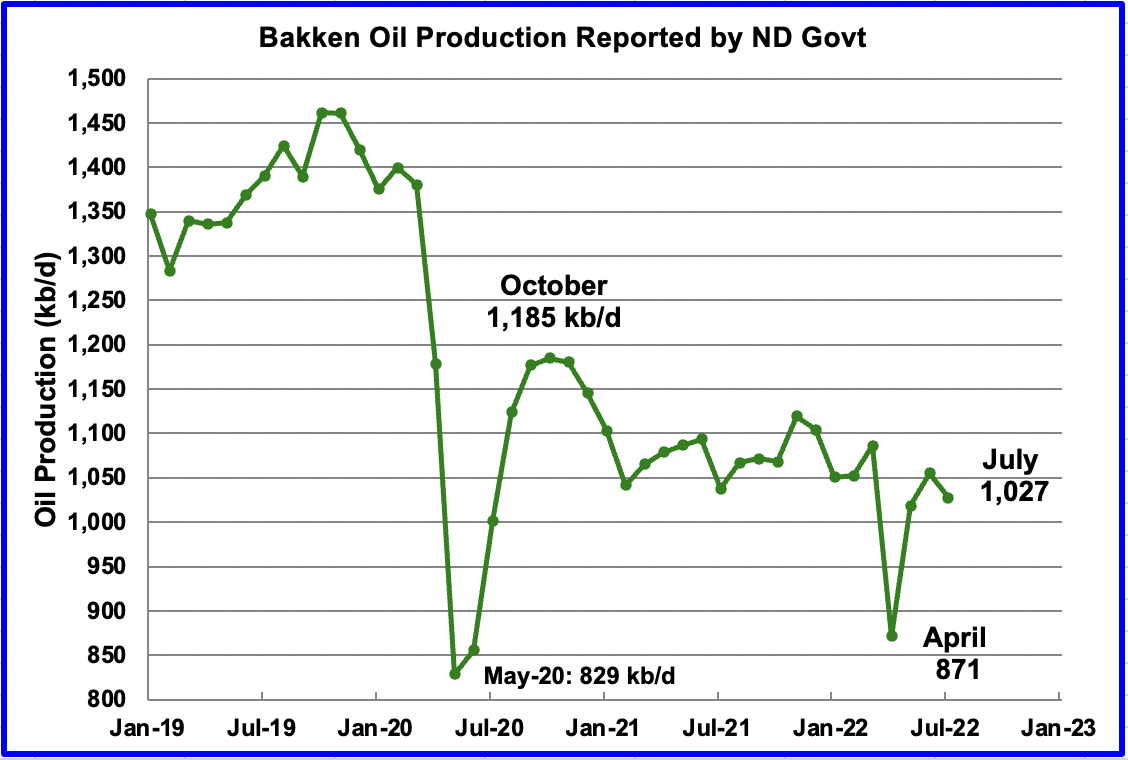
This chart shows the Bakken’s output as reported by the North Dakota government. July production was reported to be 1,027 kb/d down 28 kb/d from June. The DPR Bakken chart above shows July production to be 1,143 kb/d, 16 kb/d higher.
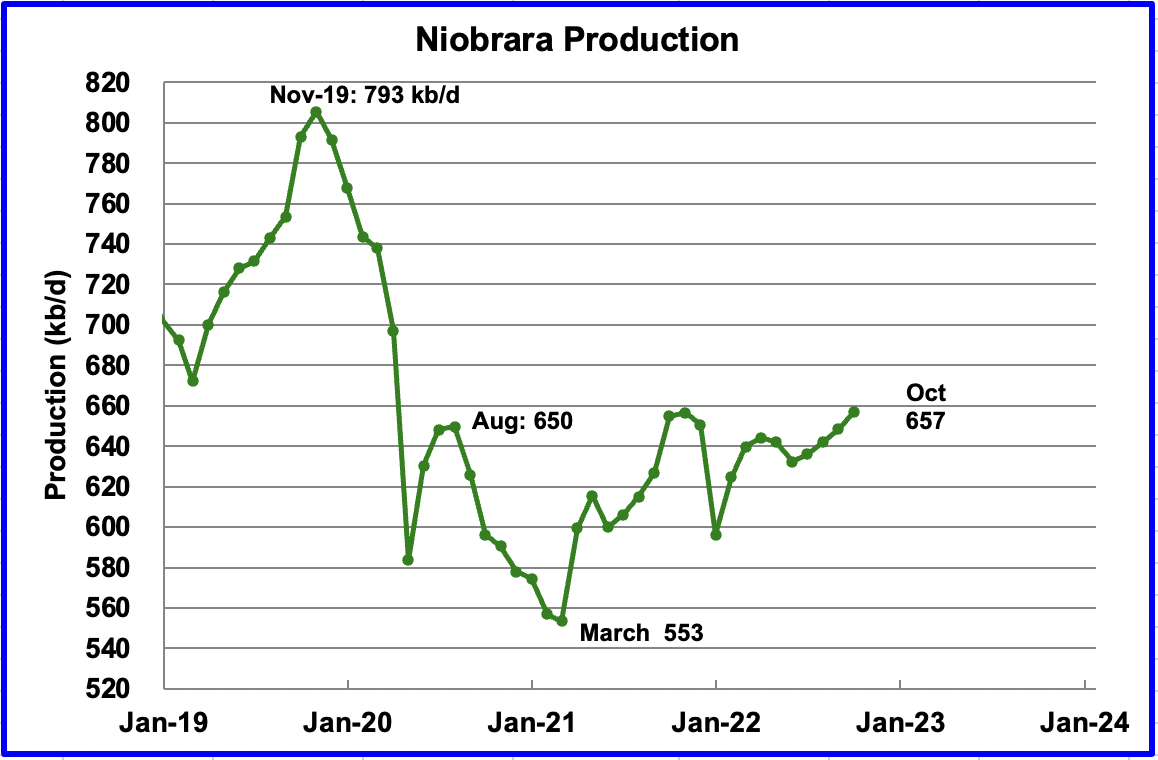
Output in the Niobrara continues to increase slowly. October output increased by 9 kb/d to 657 kb/d.
DUCs and Drilled Wells
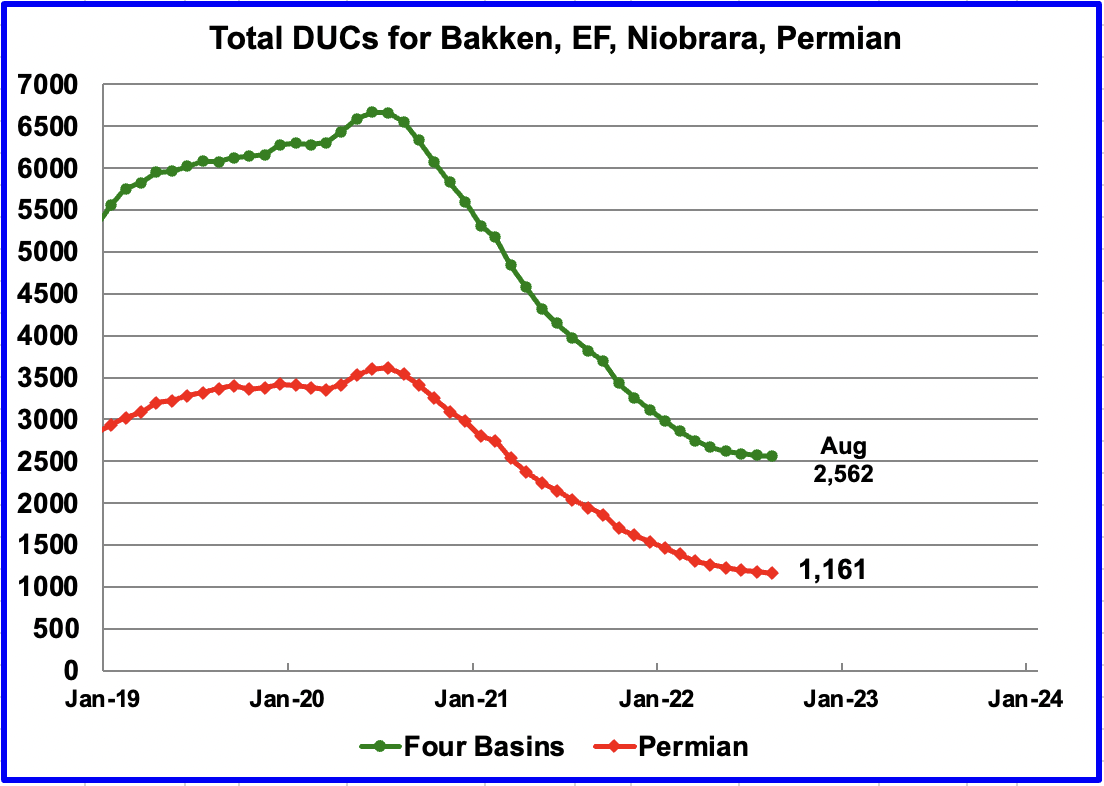
The number of DUCs available for completion in the Permian and the four major DPR oil basins has continued to fall every month since July 2020. Prior to July 2020 more wells were drilled than were completed. The last two data points show how the use of DUCs continues to slow and is further illustrated in the next chart.
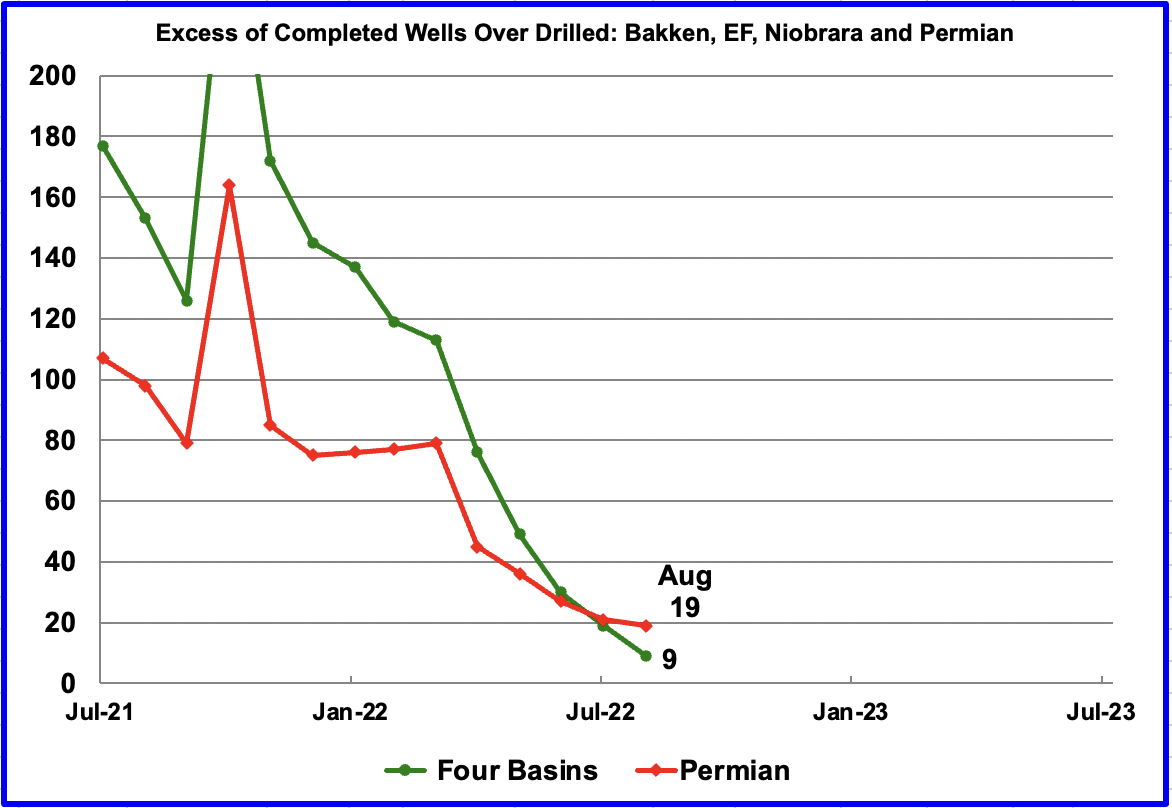
While this chart is titled “Excess of Completed Wells over Drilled”, it could also have been called “Monthly change in DUC completion rate” because the excess of completed wells in a given month is equal to the change in the DUC completion rate.
In these four primarily oil basins, the change in monthly completion rate of DUCs started slowing after peaking in March 2021. In August 2022, 9 fewer DUCs (2,571 to 2,562) remained than in July. Similarly the monthly completion rate for DUCs in the Permian continues to fall. In August, the number of remaining DUCs fell by 19 (1,180 to 1,161). Note that since Permian excess wells were greater than in all four basins combined, a few basins drilled more wells than were completed. For instance in the Niobrara, 119 wells were drilled and 110 were completed.
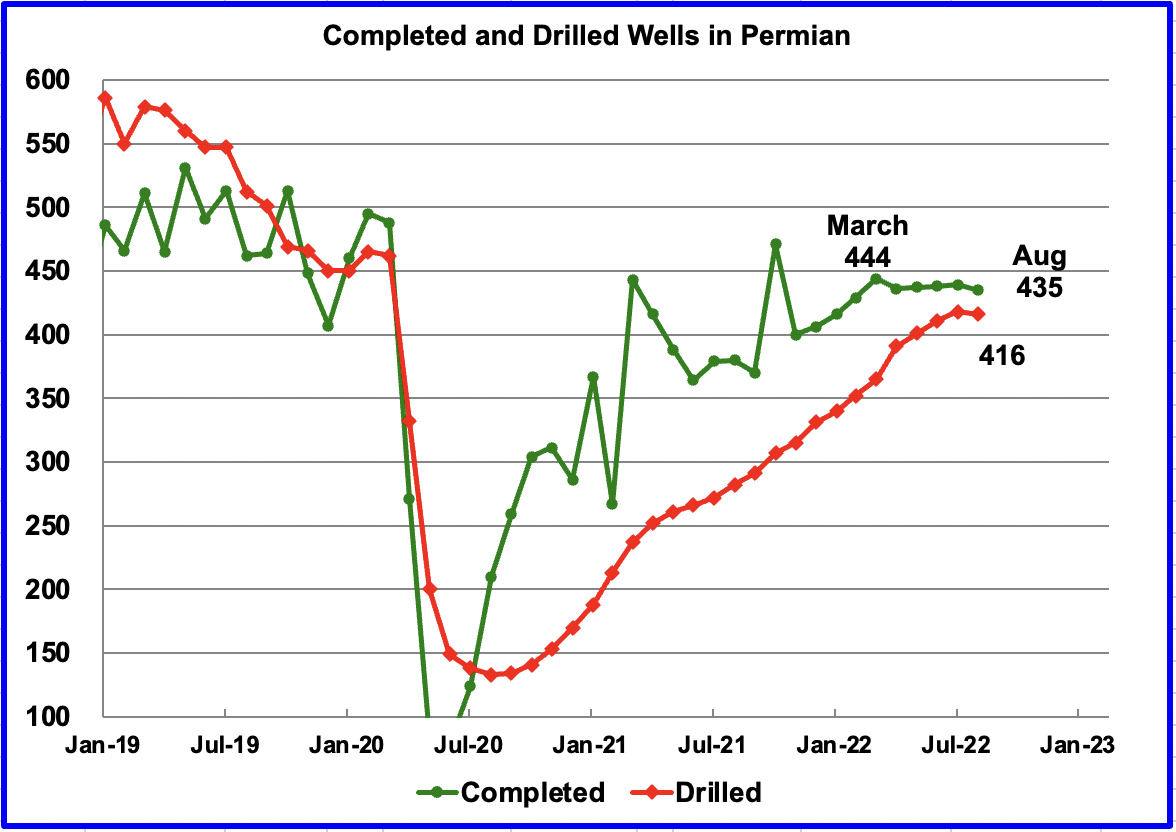
In the Permian, the monthly completion rate has been showing signs of slowing since the recent March peak of 444. This is consistent with the frac spread chart shown above where there has been no growth in frac spreads since February.
In August 435 wells were completed, 4 fewer than in July and 9 fewer than in March. During August, 416 new wells were drilled, a decrease of 2 over July. This is the first time that there was a MoM drop in drilled wells. The gap between drilled and completed wells in the Permian has reached a new current low of 19 DUCs, which is the same as reported in the previous chart.
Editor’s Note: The summary bullets for this article were chosen by Seeking Alpha editors.
Be the first to comment