

Spencer Platt
Investors who do not compromise on quality have a plethora of options to choose from when it comes to ETFs. Funds targeting profitability with peculiar methodologies are aplenty, appealing both to cash flows- and earnings-focused investors, so figuring out which one is the best is a time-consuming task.
However, there is a simpler alternative to delving into dozens of ETFs that imply sophisticated measures of profits and capital efficiency to whittle their lists down to the most capable companies. Equity valuations contain immeasurable amounts of data, and the key issue I would like to focus on today is the correlation between size and quality.
Another way of saying this is that large- and especially mega-cap funds mostly have a meaningfully higher quality compared to their smaller counterparts as a byproduct of their strategies. Invesco S&P 500 Top 50 ETF (NYSEARCA:XLG) is a beautiful example.
Tracking the annually rebalanced S&P 500 Top 50 Index, it picks the most valuable players from the S&P 500 using a buffer rule described in the methodology document. This is a beautifully minimalist but powerful strategy.
As my analysis presented below revealed, XLG could be used as a solid substitution for the iShares Core S&P 500 ETF (IVV) for investors who seek simpler quality-heavy portfolios, at times with a little momentum tilt (thanks to market-cap-based weighting). I will elaborate on that using the Seeking Alpha Quant data and a few selected profitability metrics.
However, there are downsides. First, the differences in expense ratios could become a dealbreaker. IVV is a classic plain-vanilla fund with only 3 bps in fees, while XLG comes with a 20 bps expense ratio. Second, XLG has a top-heaviness issue given the top ten stocks in its basket account for over 52%, which makes it prone to further decline should the rally in IT behemoths lose steam after a euphoric July and the bullish first week of August. In the wake of the fresh inflation data, I believe this is relatively unlikely as bulls have solid arguments to bid up multiples again, but the risk of this rally losing momentum does exist and is not to be forgotten. And third, XLG has all the valuation issues of the upper-echelon equities.
Is XLG truly better than IVV regarding quality?
XLG is markedly overweight in IT, with 39% of the net assets allocated to the sector as of writing this article, which is around 11% higher compared to IVV. Other sectors that saw their weights boosted meaningfully are consumer discretionary and communication. Those that saw their weights cut sharply are industrials and financials, while real estate and utilities were removed entirely.
Created by the author using data from the funds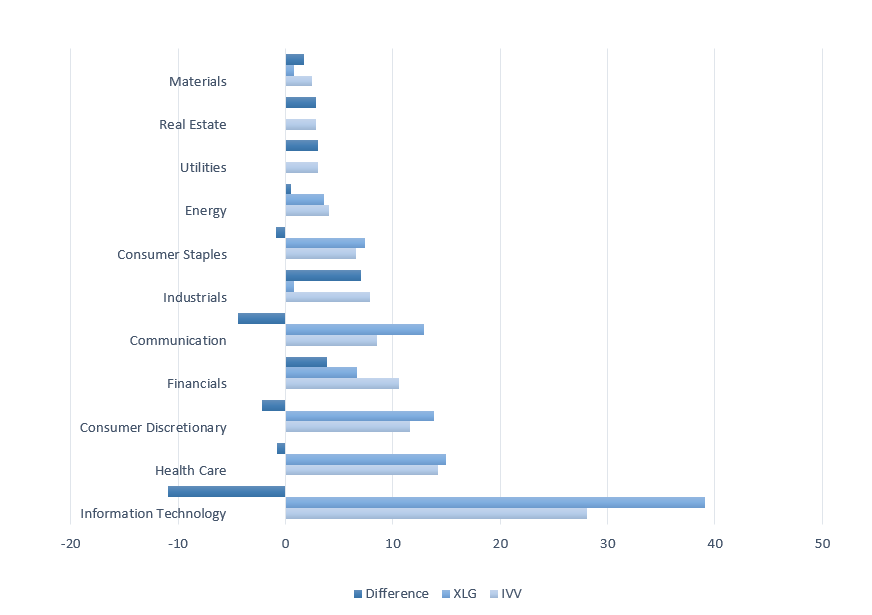
Of course, the XLG investors get much larger exposure to Apple (AAPL) and Microsoft (MSFT) than those who opted for the 500 cohort. Being XLG’s largest holding, AAPL occupies around 13.4% while MSFT sports an 11.2% weight. In IVV, these bellwethers have, though meaningful, only single-digit weights.
Did that tilt the fund towards only the most profitable companies in the world? It did.
I have been constantly talking about the correlation between size and quality in my Seeking Alpha articles, and the XLG portfolio offers a unique opportunity to illustrate this once again.
There are a few methods that can be applied here. This time, I would like to benchmark the Quant characteristics of the XLG holdings against IVV, and then compare Returns on Assets and EBITDA margins of their holdings outside the financial sector.
When it comes to the Quant Profitability grades, XLG beats IVV easily. Inside its portfolio, there is not even a single stock with a grade less than A-. While also sporting robust profitability characteristics, the S&P 500 ETF does have exposure to those with a few issues, illustrated by a D+ grade or worse, around 1.2%. In the case of Stanley Black & Decker (SWK), they are negative operating and free cash flows while DuPont de Nemours (DD) could not cover LTM capex organically and deliver an acceptable asset turnover ratio.
Now, ROA and the EBITDA margins comparison.
Created by the author using data from Seeking Alpha and the fund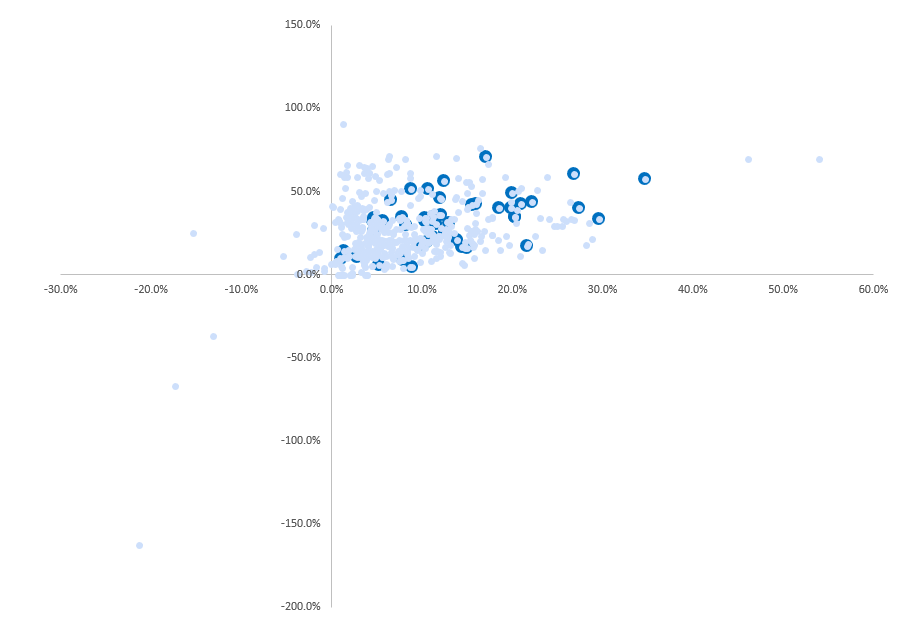
The scatter plot shows clearly the 50 cohort not only has no constituents with negative EBITDA or net income (the nominator of ROA) but also most of its holdings (over 69%, to be precise) have ROA of greater than 10%, which is a solid result deserving appreciation. We see returns on assets are especially strong amongst the fund’s IT investments, as 12 out 14 boast an at least 11% ROA. Two outliers with single-digit figures are Advanced Micro Devices (AMD) and Salesforce (CRM). On a side note, healthcare players cannot boast a similar level of efficiency but their EBITDA margins clearly impress as the sector median is just 4.5% while 11 out of 12 holdings from the sector have a margin of no less than 29%.
Does XLG have an edge over IVV regarding growth?
Unfortunately not. Growth rates are marginally weaker. For example, just 19.2% of XLG’s holdings have a Growth grade of B- or better vs. IVV’s 22.5%.
Anyway, the forward EPS and revenue growth rates of its holdings are still fairly robust, as can be seen on the chart below.
Created by the author using data from Seeking Alpha and the fund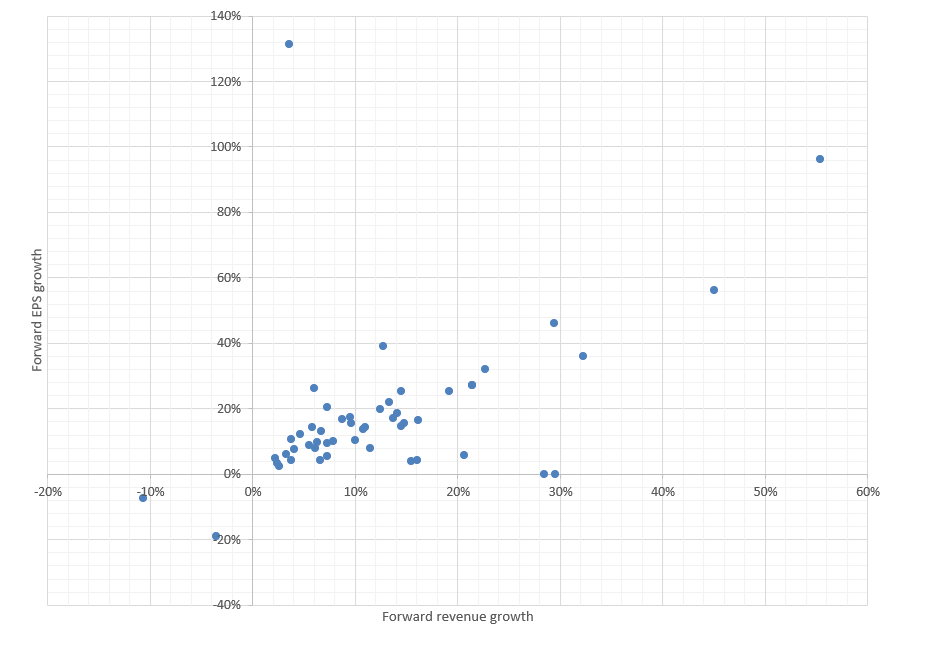
Is XLG’s portfolio more expensive than IVV?
As quality typically invites higher multiples, XLG does come with a greater share of overpriced stocks. For instance, 71.8% of its holdings have a D+ Valuation grade or worse compared to IVV’s 68.3%.
Its portfolio is inherently more expensive than the S&P 500, so investors opting for it should consider whether they are comfortable with larger growth and quality premia and whether they could tolerate periods when these premia become thinner.
What can historical returns tell us?
The key takeaway from the returns analysis of the June 2005 – July 2022 period is that XLG tends to deliver results almost similar to IVV.
For example, their risk-adjusted returns were almost identical as both have a Sharpe ratio of 0.61, though XLG is a bit ahead with 0.92 vs. IVV’s 0.90. If we look at a shorter timeframe, for instance, a 10-year period, the results are also akin, as the S&P 500 ETF delivered the 1.51 Sortino ratio vs. XLG’s 1.52.
The table below provides a better view of historical returns, with green cells indicating XLG’s alpha months and years.
Created by the author using data from Portfolio Visualizer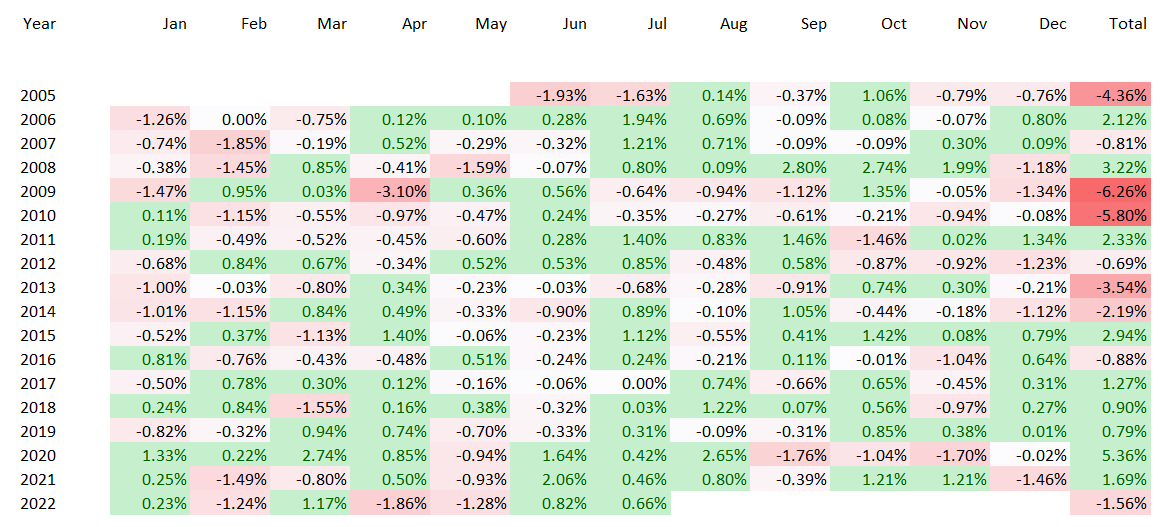
XLG was a clear winner during the late-2010s – early 2020s period, with the coronavirus market rally certainly contributing to its solid 2020 alpha of ~5.4%. We also see its growth- and tech-heavy portfolio was more sensitive to the growth premia issue this year as investors have started to adjust valuations to a new era of higher interest rates, so its total return in the first seven months was marginally weaker, though it outperformed in July.
Final thoughts: Pursue alpha with cost-efficiency in mind
Though indirectly, XLG follows a hybrid momentum/quality strategy, investing in a few most expensive companies in the world.
It beautifully encapsulates how a simple strategy can materially boost a portfolio’s exposure to the quality factor.
Certainly, any factor should be pursued with cost-efficiency in mind. Even though XLG could deliver better short-term returns should bulls continue bidding up multiples, longer-term, lower-cost alternatives like IVV have an edge over it. XLG is a Hold.
Be the first to comment