

Douglas Rissing
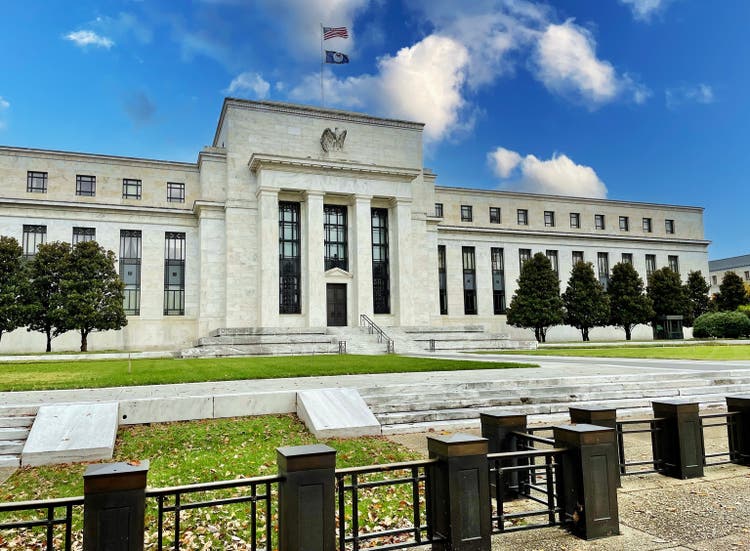
Central banks play a crucial role in ensuring the economic and financial stability of their country or region. They are responsible for conducting monetary policy to achieve price stability and to help manage economic fluctuations.
There are several tools at the disposal of central bankers to conduct monetary policy. The primary, and most effective tool, is setting interest rates. Lower interest rates mean easier access to credit for businesses and households. Higher interest rates mean the opposite – more expensive and limited access to credit.
When economic times are tough and there is slower economic growth, central banks have the responsibility to reduce rates to make sure that there is easier access to credit in the economy. Sometimes though, that is not enough.
During the Global Financial Crisis (GFC) in 2008, the Fed cut the Fed Funds rate by 400 basis points (bps) to essentially zero. The economy was still at risk, and more needed to be done to prevent the collapse and failure of our financial system.
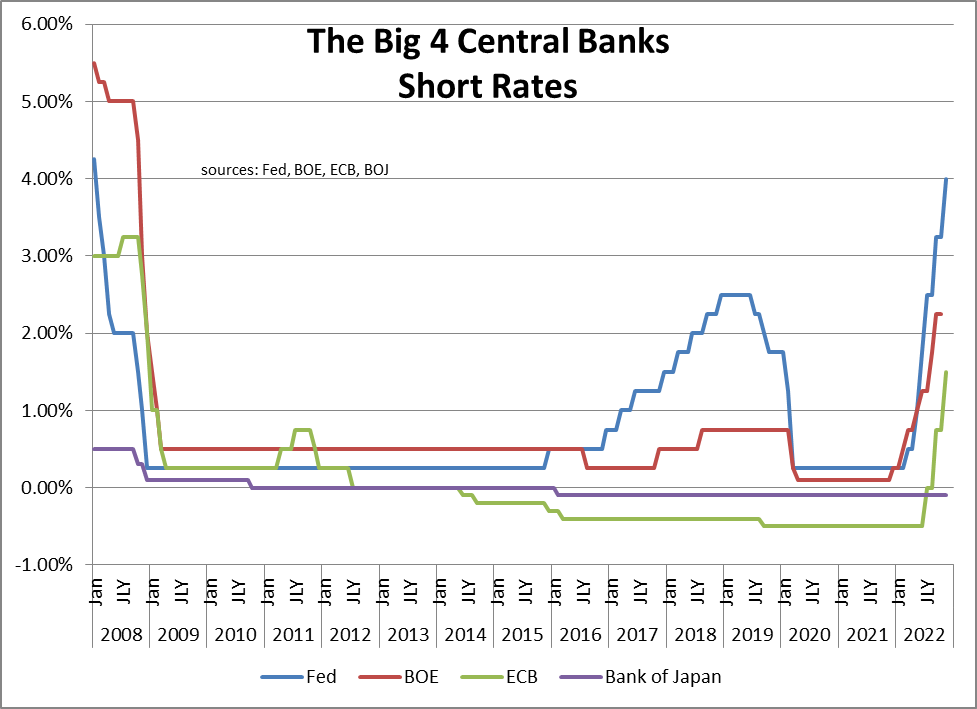
Fed, BOE, ECB, BOJ
The Fed then turned to an unconventional tool. Using Open Market Operations, the Fed embarked on a series of Large Scale Asset Purchases, more commonly known as Quantitative Easing (QE), in an attempt to stimulate the economy and add liquidity to the system. The result was a massive expansion of their balance sheet.
This was the first time the Fed ever used QE.
The entire world was impacted by the GFC, and other major central banks followed the steps of the Fed and implemented QE after cutting their base interest rates to zero, as well.
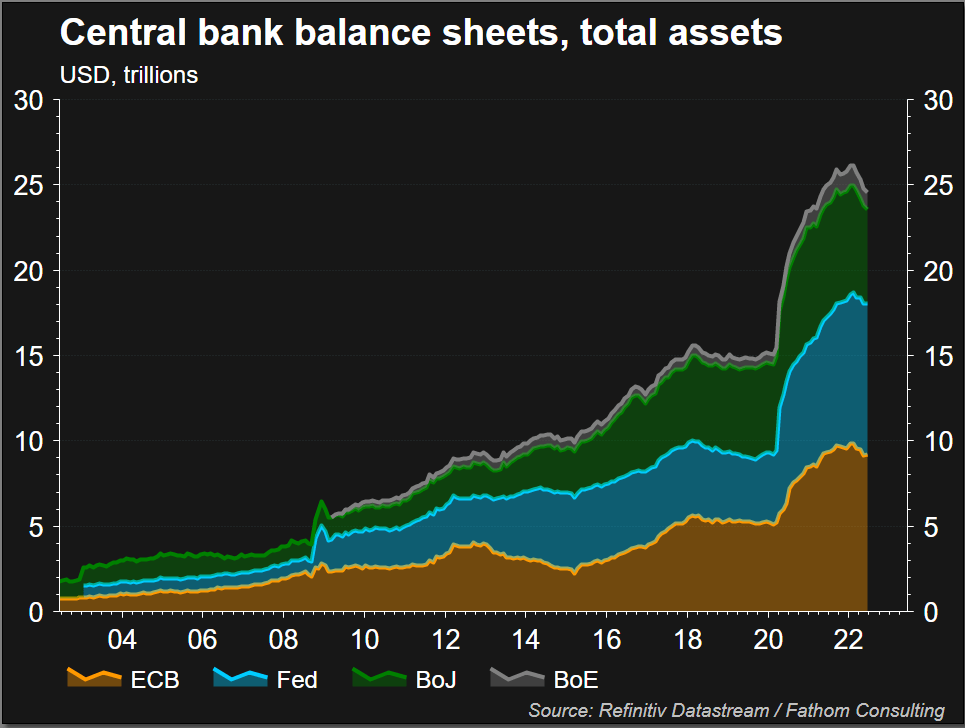
Refinitiv Datastream/Fathom Consulting
These were emergency measures enacted at a time of an economic calamity. The expectation was that when the crisis passed, the central banks would normalize their monetary policy and return to pre-GFC equilibrium.
The fear was that the injection of tremendous amounts of liquidity to the financial system would be inflationary.
But as time went on and the economy recovered, inflation remained quite tame. In parts of the world there even was concern about deflation. The use of QE as a monetary policy tool lingered.
While prices remained under the Fed’s benchmark target of 2%, inflation appeared in a different segment of the financial world creating asset bubbles. With interest rates near zero, and much liquidity floating around, the Fed’s actions forced people to invest in riskier assets.
Money poured into the stock market. And with interest rates so low, money also poured into the housing market. A lower mortgage rate reduced the monthly payment of a mortgage thereby increasing affordability, or conversely, for the same monthly payment one could borrow a larger sum of money. With a bigger mortgage, one could pay a higher price for a house without it costing them more. This led to a spike in housing prices.
As the economy recovered asset prices continued to rise; stocks, bonds, housing and digital currencies set new high after new high. Inflation remained low. We set a post war record for the longevity of an economic expansion at 126 months. Only the pandemic interrupted the growth, but new rounds of QE shortened the downturn and growth quickly resumed.
Despite a prolonged recovering economy with record low unemployment, crisis level QE monetary policy remained.
The market became fat and happy with the stimulative QE. Investors felt smart because of the gains in their portfolios, and homeowners took advantage of their newfound wealth with cash out refinancings at all-time low interest rates.
Money was cheap and easy. Car manufacturers offered zero percent financing. The government could issue billions of dollars in new bonds at virtually no cost to cover their stimulative fiscal policies.
Anecdotally, a clear sign of a pending market top occurred in the summer of 2021 when a neighbor’s son told his mother he didn’t need to find a new job after he was laid off during the pandemic because he was making more money in his bitcoin account than he made when he was working. He sat home and played videogames as he watched his digital portfolio grow.
When price inflation started appearing in the second quarter of 2021, it wasn’t an immediate concern. Fed Chairman Powell called the uptick in inflation “transitory.” Meanwhile, the asset bubbles continued to expand.
As global inflation started spiking higher central bankers finally recognized the severity of the problem and began to perform their mission of controlling prices. They set in motion plans to reverse their monetary policies and tightened by hiking interest rates and reducing their bond portfolios.
The World Central Banks are Now Paying the Price of Quantitative Easing
If QE seemed like too much of a good thing, it was.
Little noticed recent headlines are showing the cost central bankers are now confronting for their QE policies:
“Australia’s central bank has equity wiped out by billions in bond losses” – Reuters 9/21/22
“The Bank of Canada, for the first time in history, is losing money. Is that a problem?” – Toronto Star 9/12/22
“Swiss National Bank loses nearly $143 billion in first nine months” – Reuters 10/31/22
Federal Reserve
QE was always intended as a temporary emergency measure. In his testimony before congress in February 2010, Fed Chairman Bernanke said “The Federal Reserve anticipates that its balance sheet will shrink toward more historically normal levels.”
Reversing QE, however, proved more difficult than expected. The first attempt at policy normalization occurred in June 2013. Bernanke expressed in a press conference that economic conditions had improved enough that the Fed would moderate monthly bond purchases later in the year. The bond market immediately panicked and rates spiked. This period became known as “The Taper Tantrum.” Just mentioning reducing the size of asset purchases scared the bond market. The tapering period only lasted a few months.
The Fed’s second attempt at policy normalization began in 2018. Despite experiencing the longest economic recovery in our history to that date, with unemployment falling to a 50 year low of 3.6% and stocks setting all-time highs, the Fed was only able to cut $670 billion of the $3.65 trillion it had added to the balance sheet.
Then COVID happened, causing the Fed to step in and resume QE, doubling the balance sheet in two years to almost $9 trillion.
The current policy normalization attempt began this year when inflation soared to almost 9%, a 40 year high. The Fed began using their most effective policy tool of raising interest rates with a 25 bp increase in March. Since then there have been 6 subsequent rate hikes. In total, the Fed Funds rate has risen 375 bps this year.
US Y/Y CPI
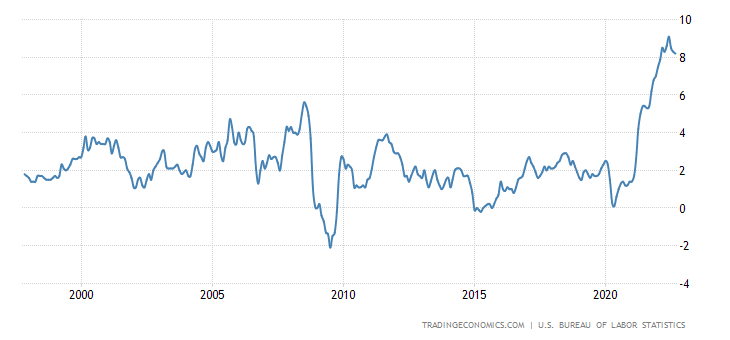
Tradingeconomics.com
In addition, the Fed began their balance sheet reduction plan. First came a tapering of new bond purchases, then a cessation of bond purchases, and finally in June, the maturity roll off started. So far, the Fed’s SOMA portfolio has contracted by $243 billion to $8.6 trillion.
The Fed’s Quantitative Tightening (QT) has had a large impact on the bond market.
Over the past 14 years the Fed has become the largest owner of Treasury securities, holding 26% of all publicly outstanding US Treasury bonds. During the post –pandemic QE period, when the Fed’s balance sheet doubled, the Fed purchased 57% of all newly issued Treasury securities. The Fed was successful in pushing interest rates to record lows. At one point during the peak of the pandemic the entire treasury yield curve, from 3 months to 30 years, offered yields below 1%.
That marginal bid, however, is now gone from the market. As a result of the drop in demand, interest rates have increased dramatically.
When the Fed announced that they would begin tapering their bond purchases in the FOMC minutes a year ago, the 10 year US T-note was yielding 1.55%. As the pace of the balance sheet reduction has accelerated, the 10 year yield has spiked to over 4.00%, the highest level since 2008.
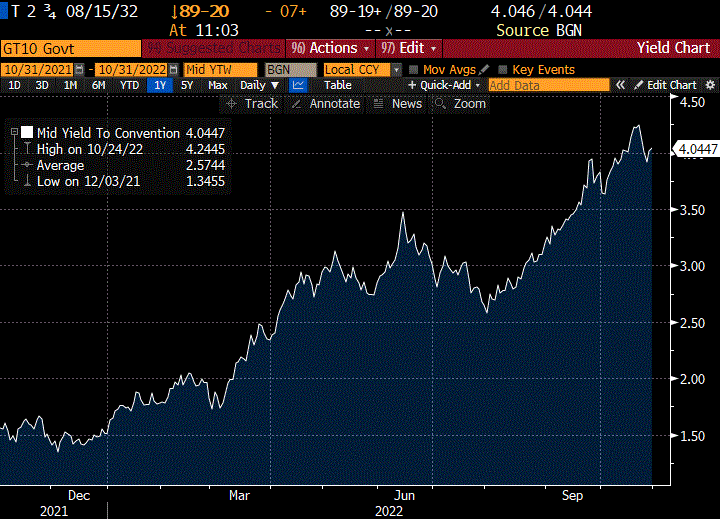
Bloomberg
The asset bubble seems to have burst. The bond market, as measured by the Bloomberg Aggregate Index has declined by -15.72% YTD through 10/31, on track for its worst performance since 1931. Stocks, as measured by the S&P 500 are down -20% from their highs. Housing prices have shown the first two consecutive monthly declines since the GFC. And Bitcoin has lost -55.7% of its value YTD.
The rise in interest rates has also had an adverse effect on the Feds financial strength.
When the Fed began QE they deviated from a historical norm. Traditionally when conducting open market operations the Fed would only buy short term US Treasury securities as they didn’t want to take any risk. However during QE, they began buying longer maturity Treasury securities and mortgage backed securities from banks. They transferred the market risk of owning bonds from the banks to their own balance sheet.
They then committed the cardinal banking sin of funding their fixed rate long term assets with variable rate, short term liabilities, namely bank reserves and reverse repurchase agreements. This created an asset-liability mismatch, exposing the Fed to significant interest rate risk. As interest rates rose the cost on their variable rate liabilities increased, while the interest income earned on their assets remained fixed.
In the third quarter 2022 we estimate that the Fed’s interest expense rose sufficiently to cause their net interest income to drop to $10.8 billion, a 65% decline from the second quarter. With the recent Fed Funds hike we estimate that the Fed will lose money for the first time in 107 years, to the tune of $-15 billion in the current quarter.
And this is not a one-time loss. Based on the forward guidance for Fed Funds, we estimate that the Fed will lose close to $120 billion from operations for the entire year of 2023. Losses are also projected at least through 2025.
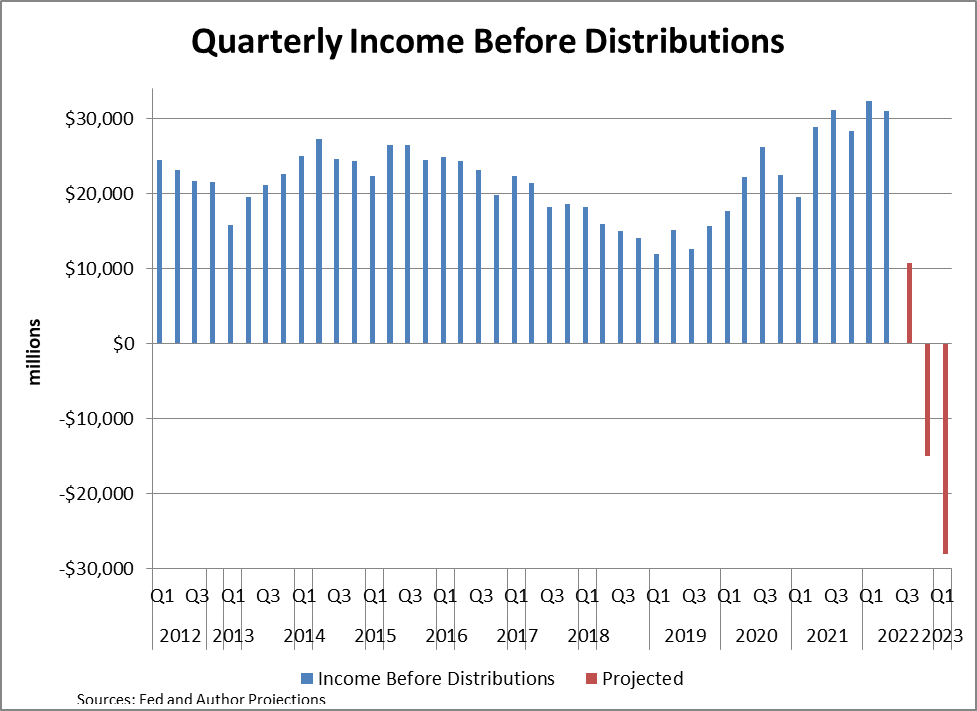
Fed and Author Projections
The losses on their income statement are not the only problem the Fed is facing.
The Fed is now carrying an estimated unrealized loss in their SOMA portfolio of $1.1 trillion. The yield of the 10 year US T-note at the end of the third quarter was 3.83%, the highest level in 14 years. Treasury yields now are greater than at any time since the GFC, meaning that each and every individual security in the entire SOMA portfolio has a market value lower than its cost. To put the magnitude of this unrealized loss in perspective, it is 27 times more than the Fed’s total capital of $41 billion, and greater than the entire Fed balance sheet of $0.9 trillion pre- GFC in 2008!

Federal Reserve
Due to the quirks of the Fed accounting system, these losses will not affect the Fed’s capital. The operating losses instead will go into a deferred asset account on their balance sheet. It is a negative liability.
As for the market losses in the SOMA portfolio, they only show up in a footnote on the financial statements. The Fed carries its bond purchases at amortized cost. This means that the decline in market value will only be recognized if the Fed sells the securities. Then the difference between cost and market value will be recorded as a loss. This is why the Fed is reducing their balance sheet through security roll offs instead of asset sales, because there is no gain or loss to record.
These very favorable and lenient accounting practices, which hide the Fed’s true financial health, do not compensate for the fact that the Fed’s financial position has deteriorated dramatically due the rise in interest rates.
Bank of England
The Bank of England (BOE) began QE early in 2009 in response to the GFC. After cutting their Bank Rate by 500 bps, they created a new entity called the Asset Purchase Facility (APF) to ease corporate credit conditions. Through the APF the BoE implemented their monetary policy by purchasing UK government bonds.
The first year they purchased GBP 200 billion gilts. Over the ensuing 10 years the APF doubled in size, then during the pandemic it doubled again. In total, the APF purchased GBP 850 billion gilts. It now owns nearly 40% of all gilts outstanding.
Inflation began climbing in early 2021. From below the BoE’s target rate of 2%, inflation spiked to the current level of 10.1%.
UK y/y Inflation Rate
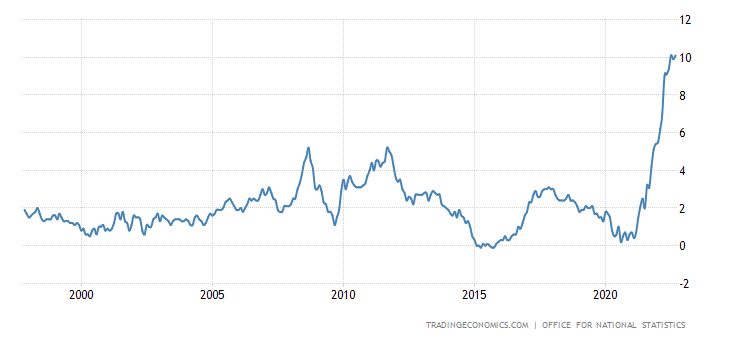
tradingeconomics.com
BoE monetary policy began shifting in 2021 in response to the rising inflation. In August of that year they announced their intention to undertake balance sheet shrinkage as part of the next tightening cycle. The first step was to gradually allow security roll offs.
Their next action in the fight against inflation was to raise their Bank Rate by 15 bps to 0.25% in December 2021. This was followed by 7 subsequent increases totaling 275 basis points to 3.00%, its highest level in 14 years. This includes the single largest increase in 33 years of 75 bps yesterday.
The final step was to fully start their QT program and to reduce their balance sheet through security sales. The BoE became the first central bank to announce a complete reversal of QE by reducing their holdings in this way.
The plan was for asset sales to commence in late September. The day QT sales were to begin, former Prime Minister Liz Truss announced her new fiscal plan of a mini budget which included tax cuts that were to be funded through the issuance of new debt. The financial market panicked and long term interest rates spiked by more than 150 basis points. Pension funds which held long term bonds saw the value of their portfolios cut in half, which triggered margin calls, which forced selling to raise needed cash. The British pound also plummeted to 37 year lows.
10-Year Gilt Yields
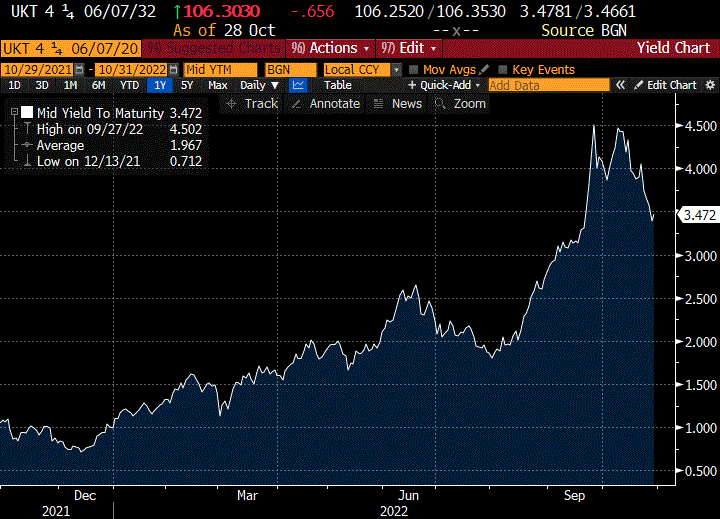
Bloomberg
In response the BoE did a complete 180, and instead of embarking on their first asset sales under QT, they resumed their QE program and announced they would instead buy GBP 65 billion of gilts to stem the carnage. This frenetic action returned some stability to the markets.
The situation was perfectly encapsulated by Bethany Payne, global bonds portfolio manager at Janus Henderson when she said “raising the Bank Rate while also engaging in Quantitative Easing in the short run is an extraordinary policy quagmire to navigate, and potentially speaks to the continuation of currency weakness and continued volatility.”
GBP/USD Exchange Rate
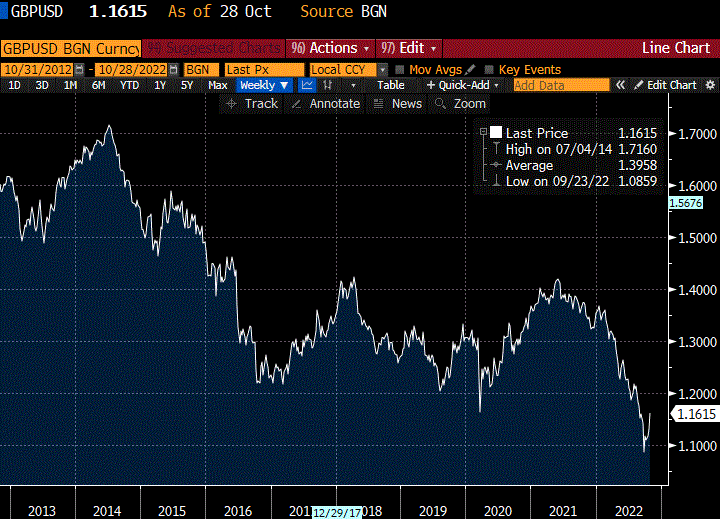
Bloomberg
QT was only deferred, not eliminated, and in early November the balance sheet reduction through asset sales was resumed.
The asset sales created a new problem for the BoE. Since interest rates have risen so much, the gilts were to be sold at a price lower than their cost, incurring a loss on the sales.
Fully 1/3 of the APF was purchased at a yield of less than 1% and another 1/3 of the portfolio was purchased with a yield of less than 1.5%. The average cost of the entire portfolio is just under 2.0%. With the 10 year gilt currently at 3.5%, all security sales will incur a loss. We estimate that the current unrealized loss in the APF is almost GBP 200 billion.
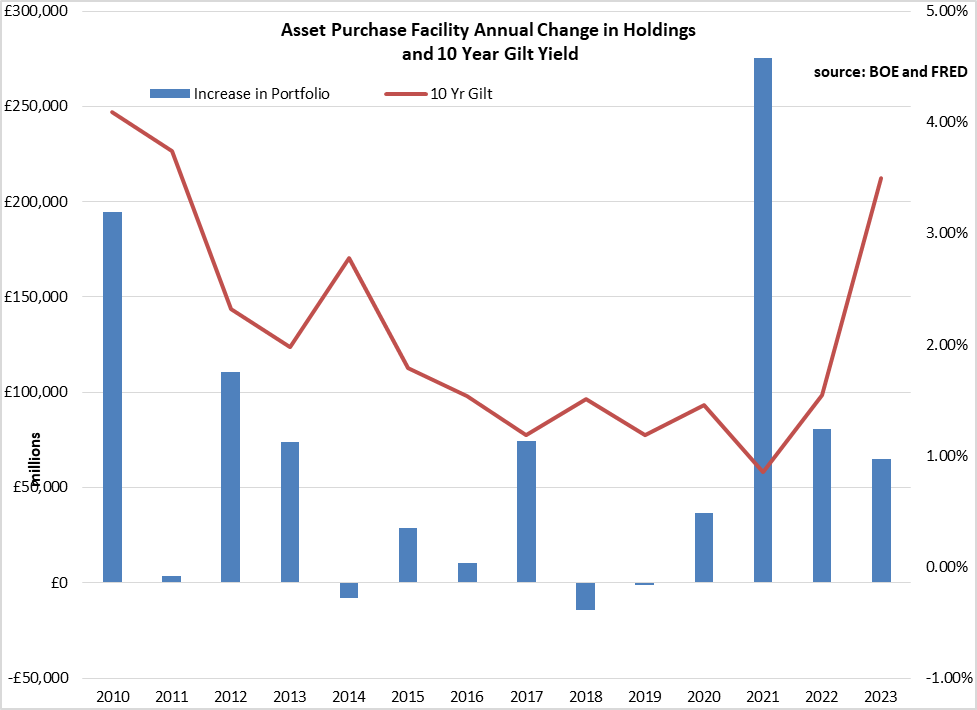
BOE and FRED
The plan is for APF to conduct asset sales totaling GBP 40 billion over the next year.
The BoE however has an indemnity agreement with HM Treasury which requires the Treasury to reimburse APF for any losses. This agreement puts the onus of losses on the public. HM Treasury is set to transfer GBP 11 billion to cover these initial losses due to the QE program.
With the recent increases in the Bank Rate a second problem has emerged. The cost of the BoE’s variable short term liabilities is greater than the interest income earned on their assets, resulting in an operating loss. For the month of September a loss of GBP 156 million was recorded. As the Bank Rate is projected to keep rising these operating losses will continue for some time.
ECB
The ECB began the Securities Market Programme (SMP) in 2010, which was created to deal with the sovereign debt crisis in Europe. Bonds were purchased from the secondary market. Initially Spanish and Italian debt was bought to avoid speculation against those countries and to avoid another Greece. By June 2012 the ECB had purchased 212.1 billion euro of sovereign debt through the SMP.
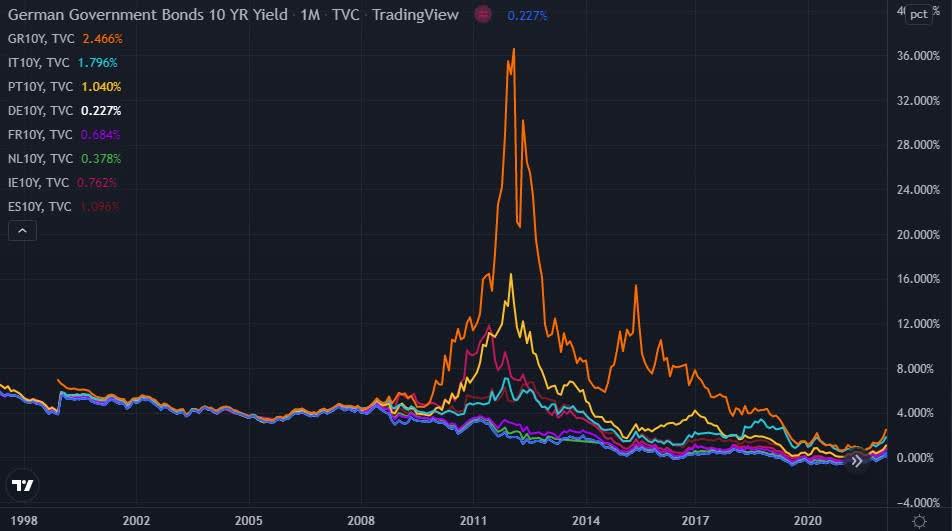
tradingview.com
In 2014, to fend off deflation, the ECB took a dramatic step and implemented a Negative Interest Rate Policy (NIRP) by lowering their Deposit Rate to -0.1%. This was the first time a negative rate had been used. In doing so the ECB was charging banks for overnight deposits.
In 2015 the ECB implemented a new QE plan of buying 60 billion euro per month of Eurozone government bonds. They were hoping to lift inflation closer to their target rate of 2%.
Euro Area Inflation
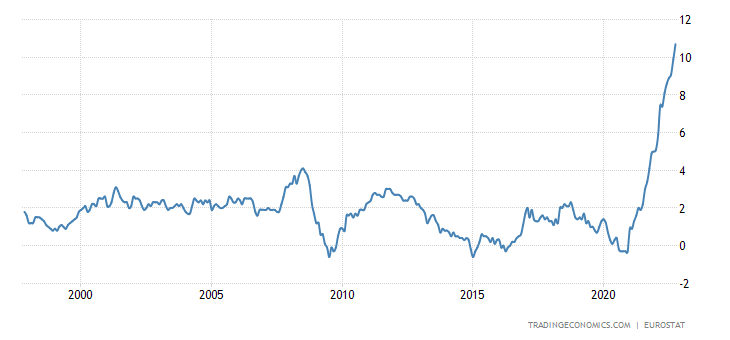
tradingeconomics.com
The NIRP remained in place for 8 years, with 4 additional rate cuts to the low of -0.5%. The ECB benefitted its member countries by continuing to buy securities keeping rates artificially low.
As inflation has spiked over the past year to the current 10.7%, the ECB has been slow to respond with policies to combat it. They first raised their Deposit Rate in July 2022 by 50 bps. There have been two additional increases since, but it now sits only at 1.5%. As the Fed and the BoE have both been implementing balance sheet reductions, the ECB has not given reducing assets much thought.
When ECB president Christine Lagarde was questioned in May 2022 about when the bank would reduce assets, she replied “in due course, it will come.” Now the ECB is thinking about it, but there is no plan to shrink their balance sheet before 2023.
Because of the weakness in the euro area economies and the large interest rate differentials with the US, the euro has depreciated by 15% this year. The euro broke parity with the dollar in August 2022 and currently is trading at 20-year lows.
Euro/USD Exchange Rate
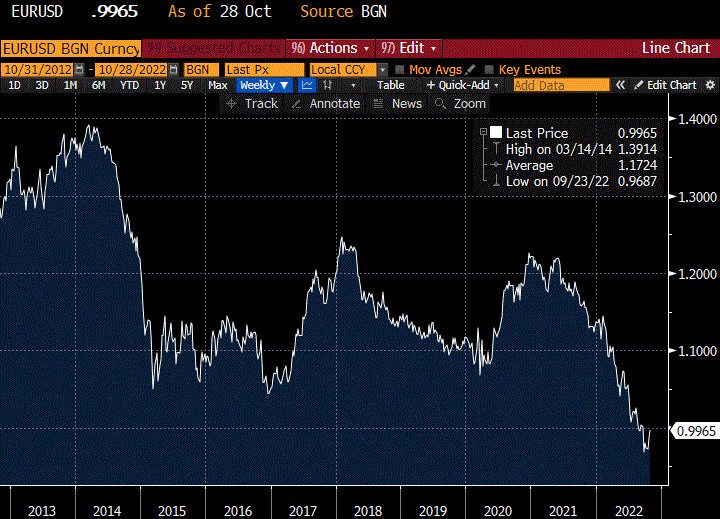
Bloomberg
As rates rise and the value of their portfolio holdings decline, all euro area central banks are exposed to potentially large losses.
Bank of Japan
The Bank of Japan (BOJ) was the first central bank to utilize QT when they began buying securities in 2001 to combat deflation. They have experienced weak economic growth and deflationary pressures for quite some time
Japanese Y/Y Inflation Rate
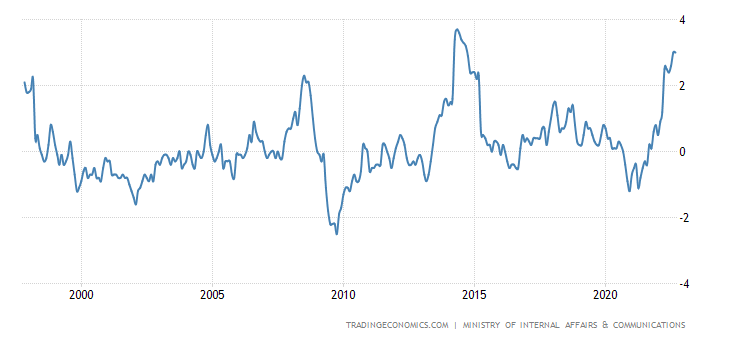
tradingeconomics.com
In 2016 the BOJ adopted a Yield Curve Control (YCC) plan where the Policy Rate was cut to -0.1% and the 10 year Japanese Government Bond (JGB) yield was fixed at 0.0%. The BOJ stated that they would maintain YCC as long as was necessary to achieve its 2% inflation target in a stable manner.
In establishing the 0% 10 year yield target, the BOJ created a +/- 25 bp band around it, to accommodate fluctuations. The BOJ promises to intervene in unlimited amounts to defend it. In the current environment, there has been upward pressure on the band. As can be seen in the JGB 10 year yield chart below, there have been several attempts to breach the 0.25% cap, but the BOJ has aggressively stepped in each time to defend it.
JGB 10-Year Yield
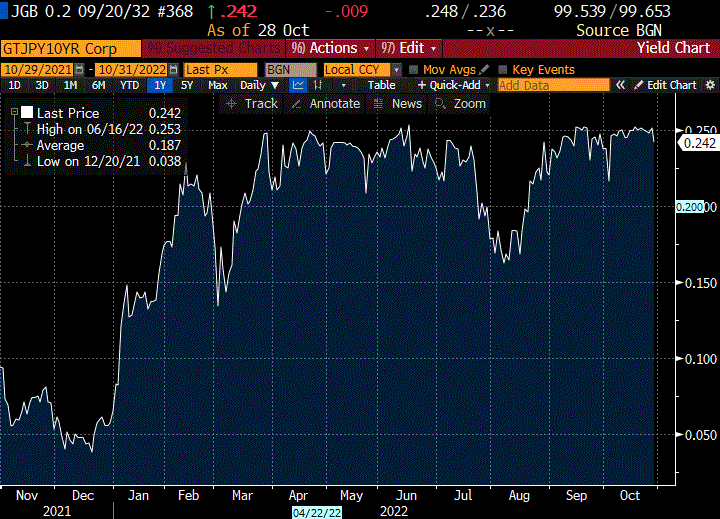
Bloomberg
We can see that the cap is artificial, as market pressures have allowed other parts of the yield curve to rise. The chart below shows the JBG curve at two points, yearend (12/31/21) and quarter end (10/31/22). While the 10 year has increased 20 bps YTD, the YCC has limited its natural growth, creating an artificial kink in the curve. The 8 year yield has risen by 28 bps and the 30 year has risen by 75 bps.
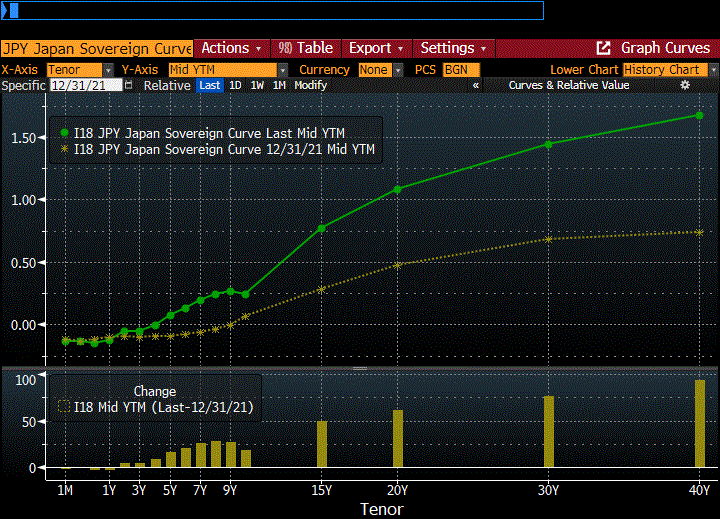
Bloomberg
Without the YCC policy, the 10 year rate would be higher.
The BOJ maintained their interest rate at -0.1% during their monetary policy meeting in September, despite the country’s annual inflation rate coming in at 3%. While lower than inflation in the rest of the world, 3% is still significantly higher than their target of 2%.
Despite this undesirable inflation level, the BOJ refuses to abandon its ultra-low interest rate policy, widening the gap with rates in the United States, as the Fed continues on its aggressive path of monetary tightening.
The artificial cap on interest rates has put pressure on the exchange value of the yen. YTD the yen has depreciated by 22% and is at a 20 year low.
Yen/USD Exchange Rate
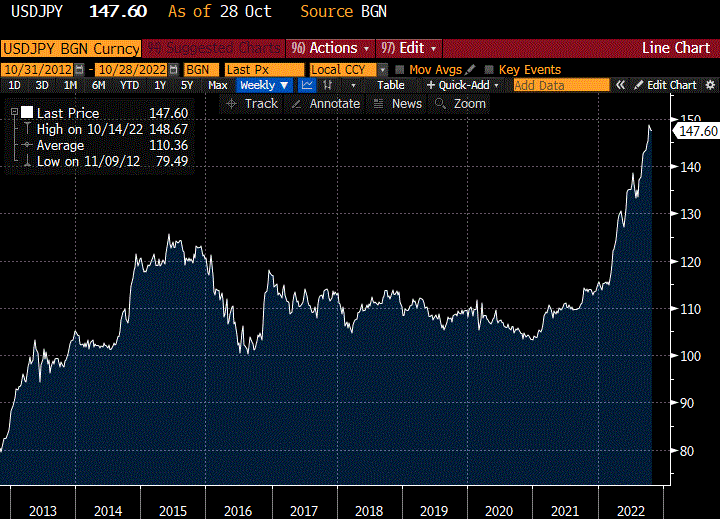
Bloomberg
One of the reasons the BOJ wants to control rates is due to the size of their bond holdings. Because of their QE policy they own 566 trillion yen ($3.8 trillion) of JGBs. If rates were allowed to rise, it would create a massive unrealized loss in their bond holdings, threatening to wipe out their capital.
Additionally, a large rate increase would make it more difficult for Japan to service its own enormous debt. Japan currently has the highest Debt/GDP ratio in the developed world at 266%.
The BOJ currently owns more than 50% of that outstanding government debt.
Putting it all together
Quantitative easing has played a significant role in conducting monetary policy for all of the major central banks in the developed world for over 14 years. It was helpful in bringing the world back from two precarious economic situations, namely the GFC and the pandemic. It is an unconventional tool of monetary policy that is useful for emergency situations.
It was always intended to be used temporarily and when economies recovered, QE would be put back in the central bank tool kit. But that didn’t happen. Economies recovered, and the emergency measure remained. The markets became addicted to the low interest rates of QE.
Economic theory suggested that QE would cause inflation by pumping liquidity into the system. But prices remained tame for quite some time, even after the economy recovered. QE did create inflation in assets like stocks, bonds, housing and the new asset class of digital currency. Investors didn’t mind that kind of inflation.
Many thought, including central bankers, that the world central banks had things under control and price inflation was a problem no more. They forgot that markets and economies move in cycles. Ultimately, price inflation did return and the central bankers were not prepared for it.
The central bankers of the world are performing their duties to achieve their stated mandate of maintaining stable inflation. They are tightening monetary policy by raising interest rates and implementing QT to reduce (slowly) their bloated balance sheets.
But, the central banks of the world are now paying the price for Quantitative Easing.
As interest rates have risen the central banks are carrying massive losses on their balance sheets. The interest income they are earning from their portfolios is being overwhelmed by a higher interest expense they are paying on their liabilities, creating losses on their income statements.
All the central banks say the same thing: “These losses will not impair our ability to conduct monetary policy.”
The losses may be hidden on central bank financial statements, but they are real in that they significantly diminish the financial strength of the central banks.
The central bank response is that “we will always be able to meet our obligations” because “we are a fiat currency and we can create reserves to meet our obligations.” While this is true, creating new reserves to cover losses is inflationary, which exacerbates the problem they are trying to solve.
The situation is more acute because practically every central bank in the developed world is in the same position.
If we experience another financial crisis, this will be a difficult hole to climb out of.
Be the first to comment