


Sezeryadigar/E+ via Getty Images
Investment Thesis
By now, every investor has heard the phrase “past performance doesn’t predict future results.” Yet, the first thing most do is pull up a price chart of a stock or fund and compare it to broad-based index funds like the SPDR S&P 500 Index ETF (SPY) or others in the same category. Some investors may look further by analyzing fundamentals or technicals, but even that won’t entirely erase the bias created by looking at past performance first. It will take something special to convince you that an underperforming fund won’t continue to underperform.
The WisdomTree U.S. High Dividend Fund (NYSEARCA:DHS) is a perfect example of how this thought process is limiting. While DHS was the worst-performing domestic ETF in WisdomTree’s large-cap lineup in the last 15 years, it’s ranked 4th out of 64 dividend ETFs in the last year and 2nd in the last six months. The market currently favors factors DHS has in spades, including an ultra-low 15x forward P/E ratio, double-digit estimated sales and EPS growth, a low five-year beta of 0.89, and some inflation protection with exposure to the oil majors. Though I don’t expect the same degree of outperformance going forward, DHS remains a strong high-dividend ETF and is getting a “cautious buy” rating from me today.
ETF Overview
Strategy And Fund Basics
DHS passively tracks the WisdomTree U.S. High Dividend Index, selecting the top 30% of publicly traded companies by their indicated dividend yields. Quality screens include removing the bottom 10% of stocks that score the worst based on a proprietary scoring system and removing the top 5% of stocks by dividend yield if they fall in the bottom half of the scoring system. We don’t know the exact details, but fund documents indicate it’s quality-focused with metrics like return on equity, gross profits over assets, and risk-adjusted total returns considered. Even after these adjustments, the number of holdings remains large. The Index currently has 300+ constituents, and only the Vanguard High Dividend Yield ETF (VYM) has more in the category.
The Index is dividend-dollar weighted, meaning each security’s weight is determined by the aggregate future dividends. As a result, companies with relatively low yields may earn a high weight should they have a large number of outstanding shares. You may consider this a modified market-cap-weighted method, as it’s a cross between a market-cap and dividend-yield-weighting scheme.
Before we get into the ETF’s current exposure areas, I want to highlight some descriptive statistics for easy referencing.
- Current Price: $89.52
- Assets Under Management: $922 million
- Expense Ratio: 0.38%
- Launch Date: June 16, 2006
- Trailing Dividend Yield: 2.75%
- Five-Year Dividend CAGR: 1.40%
- Ten-Year Dividend CAGR: 5.69%
- Dividend Frequency: Monthly
- Five-Year Beta: 0.91
- Number of Securities: 313
- Portfolio Turnover: 43%
- Assets in Top Ten: 45.43%
- 30-Day Median Bid-Ask Spread: 0.03%
- Tracked Index: WisdomTree U.S. High Dividend Index
- Short-Term Capital Gains Tax Rate: 40%
- Long-Term Capital Gains Tax Rate: 20%
- Tax Form: 1099
A valid criticism is the 0.38% expense ratio, indicating DHS should not be held for long periods. Especially since expenses directly reduce your distributions, it runs counter to the objectives of high-yield investors. I only like DHS as a short-term play until I see signs that growth stocks have bottomed out.
Sector Exposures And Top Holdings
Currently, DHS is pretty well-balanced, with no sector accounting for more than 20% of the total. It’s well-set up to combat inflationary pressures with double-digit exposures to the Energy and Financial sectors. In addition, high allocations to Health Care, Consumer Staples, and Utilities stocks should provide some excellent protection in a correction or recession. The Index caps sector exposures at 25%, except for Real Estate, capped at 5%.
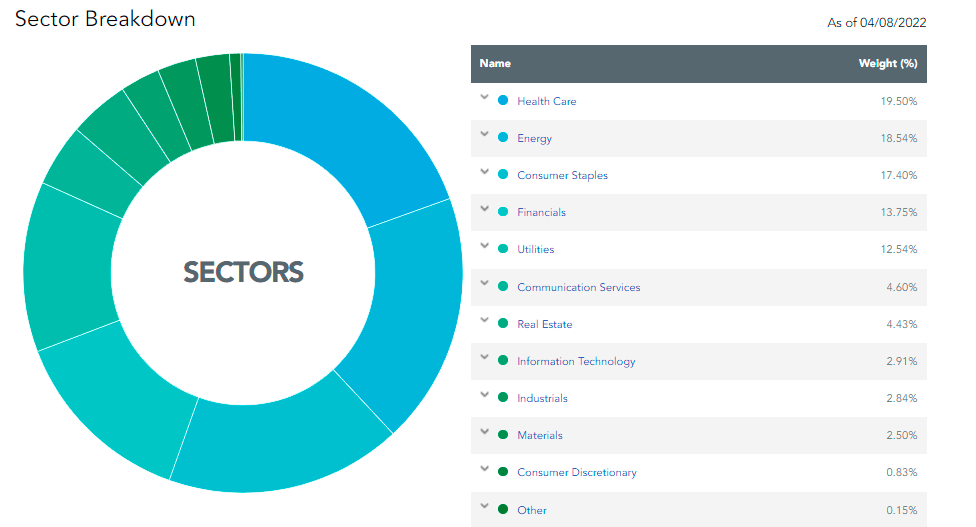
WisdomTree
The maximum weight of any individual security is 5%, though, as shown below, several stocks currently exceed that. They include Exxon Mobil (XOM), Chevron (CVX), AbbVie (ABBV), and Pfizer (PFE). When the index added the two oil majors at last December’s annual reconstitution based on dividend riskiness, it changed my perception of the entire fund. As someone concerned with sky-high inflation, adding these two stocks back in couldn’t have come at a better time. Exxon and Chevron are each up about 45% YTD.
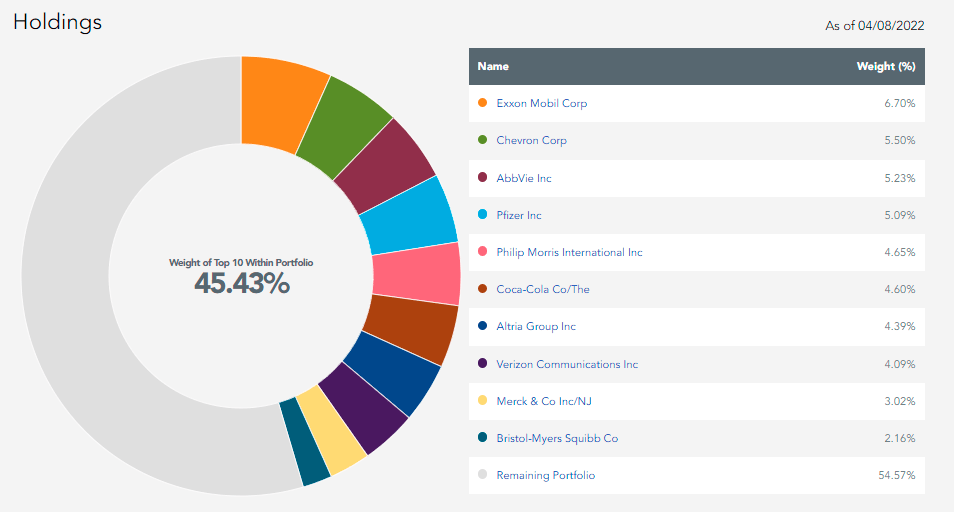
WisdomTree
Performance History
As mentioned before, basing investment decisions on past performance isn’t always wise. For example, DHS has performed the worst out of WisdomTree’s three domestic large-cap funds since its inception in June 2006. It was also the riskiest as measured by standard deviation and maximum drawdowns, so anybody looking at this chart is unlikely to be impressed.
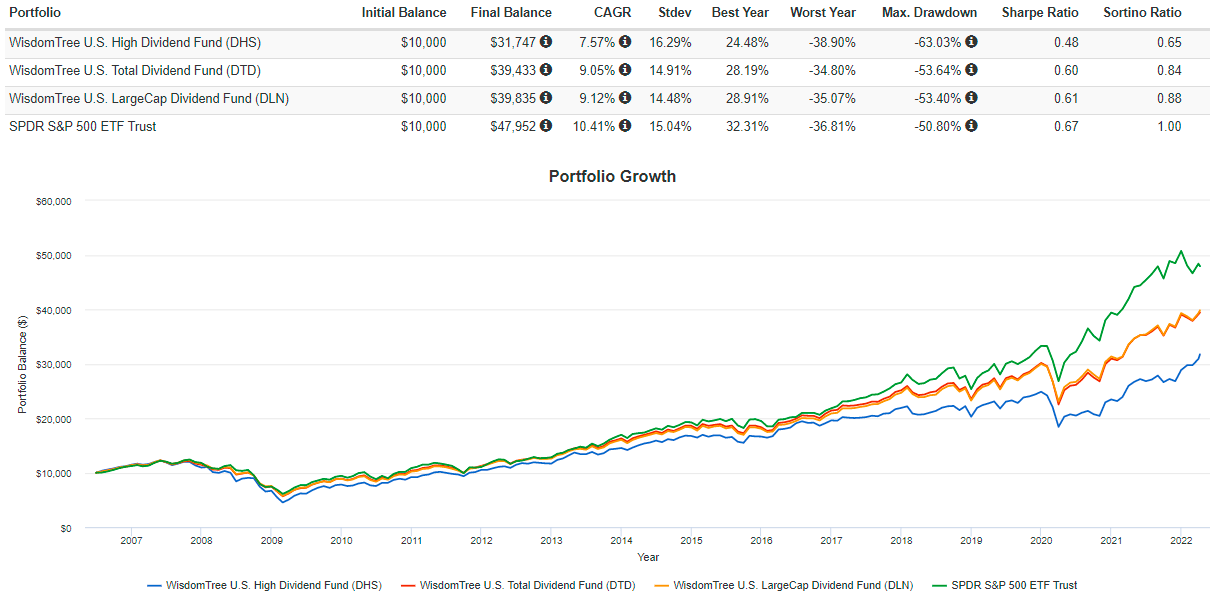
Portfolio Visualizer
Still, we must remember that most of this underperformance occurred in the last five years, including in 2020 when all bets were off, and growth stocks flourished. Interest rates were steadily declining, and since we have a pretty good idea that the opposite will occur going forward, I’m suggesting that past performance means very little. The market seems to agree, at least temporarily, as high-dividend ETFs have significantly outpaced growth ETFs in the last six months. The chart below shows median returns over various periods for multiple categories selected from my database of nearly 850 ETFs. High-dividend ETFs gained 14.37% from October to March compared to a loss of 0.62% for large-cap growth ETFs, marking a striking reversal of the last ten years (219.47% vs. 364.63%). Will this continue? I’m not sure, but I think it’s prudent to plan for it.
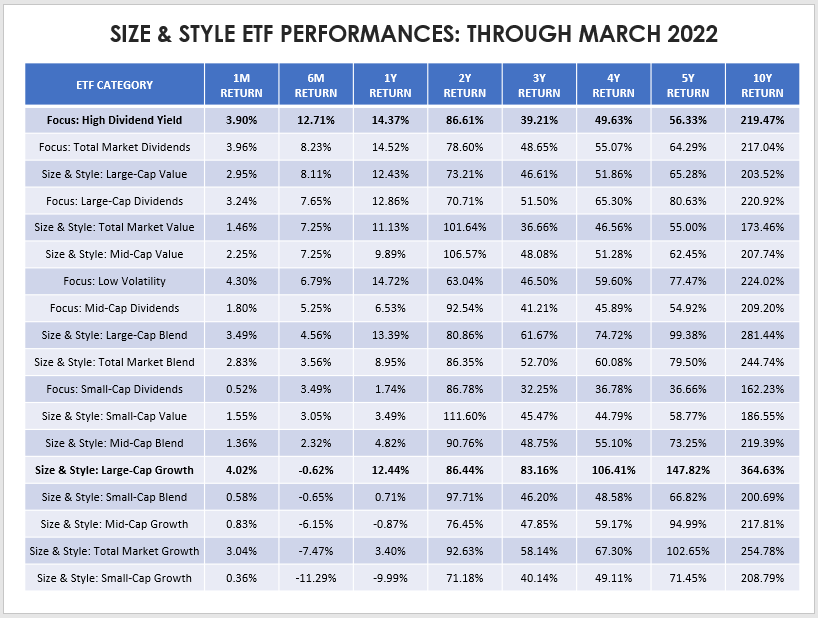
Author
As for DHS and its relative performance, it’s been the second-best-performing high-dividend ETF in the last six months, third-best in the last year, but third-worst over the previous two years. The table below should give you a good idea of how dramatically the market environment has changed recently. For reference, SPY gained 5.94% in the last six months, underperforming every ETF in the high-dividend category.
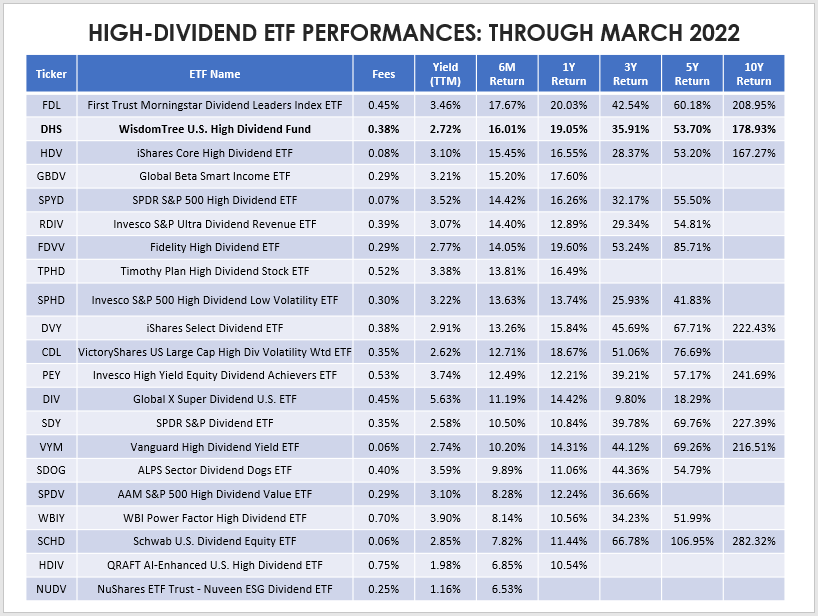
Author
Fundamental Analysis
So what’s driving these changes? It’s hard to pinpoint a single factor, but I think it’s multiple factors, including:
- large size (market capitalization)
- high profitability (return on total capital, return on equity, return on assets)
- low valuations (price-earnings, price-sales, price-cash flow)
- low volatility (beta)
- moderate sales and revenue growth rates (historical and estimated)
- positive analyst sentiment (EPS revisions)
- inflation protection (energy, financials exposure)
Size and profitability are two factors I want to highlight since they tend to go hand in hand. Large-cap, highly profitable stocks will be the first to bounce back in the event of a recession, so this should mitigate any timing risk. DHS scores well in these two areas. In contrast, an ETF like the Invesco High Yield Equity Dividend Achievers ETF (PEY) has a much smaller weighted-average market capitalization ($54 billion vs. $144 billion for DHS) and, as such, has a worse Seeking Alpha Profitability Grade (B vs. A-).
PEY has always included more small-cap stocks, with its exclusive 50-stock portfolio selected primarily by dividend yield and consistency. After the Great Financial Crisis, it took longer to recover from its substantial drawdown compared to DHS. SPY recovered the fastest, as it generally holds the highest-quality stocks.
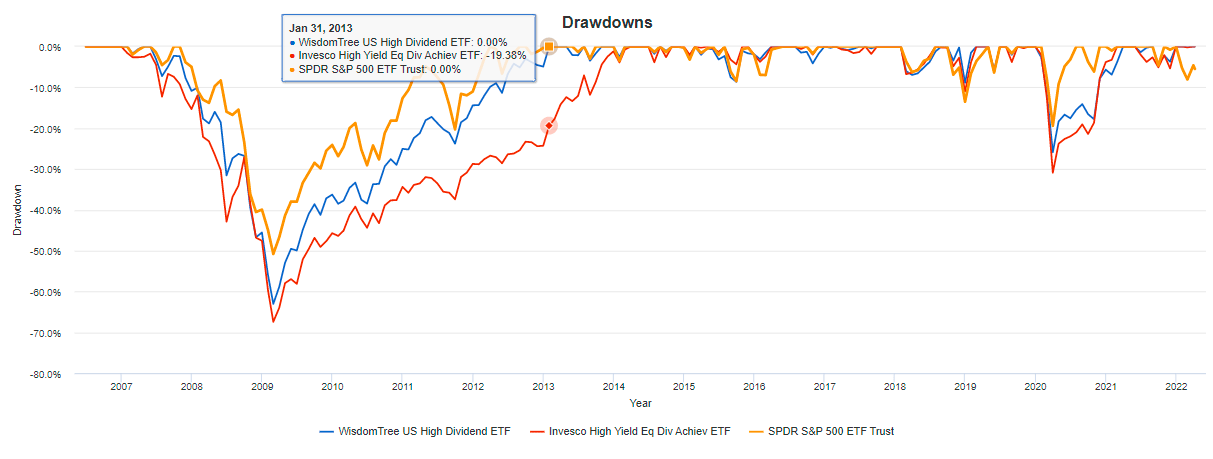
Portfolio Visualizer
Snapshot By Industry
The table below highlights selected metrics for DHS by its top 20 industries. Use this to get a high-level overview of what you’re buying, and then we will go into more specifics by company afterward.
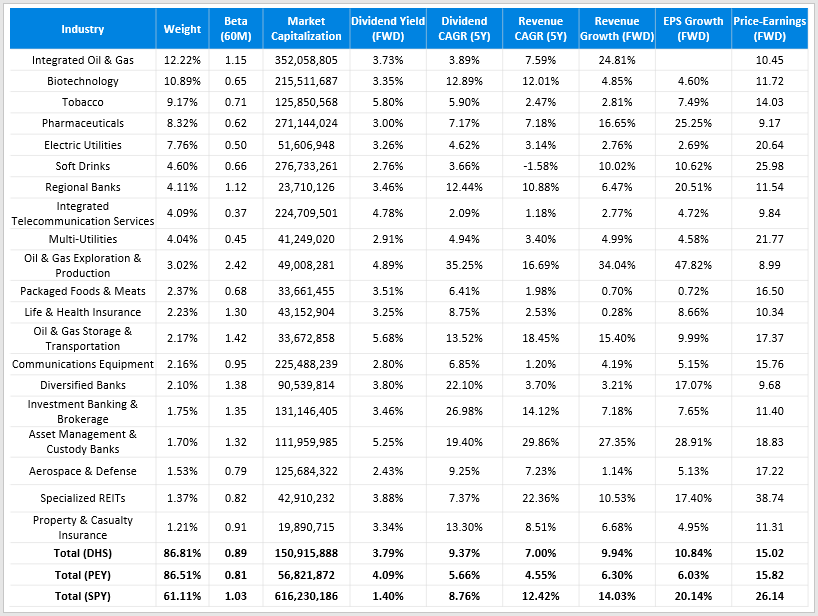
Author
I want to mention that despite having 300+ holdings, DHS has roughly the same concentration by industry as the much smaller PEY. This is a consequence of a weighting scheme that gives preference to the largest companies. Ten years ago, it wasn’t much of an issue. But today, DHS holds 15 stocks with market capitalizations over $100 billion, and they make up over 50% of the ETF. Investors looking to avoid concentration risk aren’t going to find it here and likely won’t going forward. Still, the weighted-average market capitalization of $151 billion is a nice medium between PEY’s $57 billion and SPY’s $616 billion.
DHS also is a nice balance on nearly every other metric shown. Its 0.89 beta suggests less volatility than the market, but more than its high-dividend peer. On dividends, I’ve estimated the gross yield to be 3.79% (3.41% after fees) compared to 4.09% (3.56%) for PEY and 1.40% (1.31%) for SPY. Also, DHS’s revenue and growth rates, both historical and forward-looking, all fall in the middle. Notably, the 10.84% forward EPS growth rate crossed the double-digit threshold I’ve set for dividend funds. I think all ETFs must have some growth potential if a bull market returns.
Finally, DHS is trading at a slightly lower forward P/E than PEY (15.02 vs. 15.82), and its constituents have a better five-year dividend growth rate (9.37% vs. 5.66%). Out of its 20 competitors in the high-dividend category mentioned earlier, DHS is 6th best in valuation and 8th best in dividend growth among current constituents, so it’s a pretty well-rounded fund.
Snapshot By Company
Here is a closer look at DHS’s top 20 companies. It’s worth noting that several companies like Philip Morris International (PM), Coca-Cola (KO), and Altria Group (MO) have high payout ratios and, as a result, will likely continue growing dividends at a slow pace. Not many constituents seem capable of increasing their dividends quicker than before, except for the two oil majors. Exxon recently guided Q1 EPS of $2.39 against consensus estimates of $2.17, so the money is there should Exxon choose to distribute. In the last 39 years, dividends have grown at an annualized 6%, or nearly double their growth rate over the previous five years.
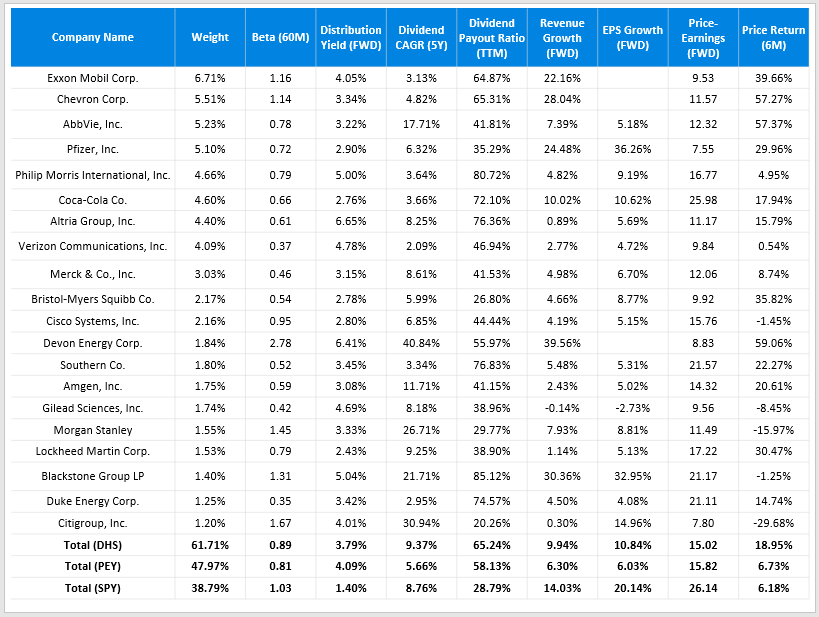
Author
I’m growing uncomfortable with the outsized exposure to energy stocks. Currently, it’s near 19% and above my target range of 10-15%. Energy is a key reason why DHS has performed so well lately, and I want to remind readers how volatile and unpredictable the sector is. I can’t predict where oil prices will be in one week, let alone one year, so I’ve learned it’s prudent to limit exposure to companies where management has limited control over their future. The Fed is trying for a “soft landing,” where it raises interest rates enough to combat inflation while avoiding a recession. If unsuccessful, oil demand could quickly dry up, and DHS’s recent gains could be lost.
The good news is that DHS’s current selections in the sector provided higher returns and less risk and drawdown than the Energy Select Sector SPDR ETF (XLE) over the last ten years. The bad news is that this simulated portfolio’s result is still abysmal. I strongly feel investors need to carefully watch how much exposure to energy stocks DHS has, perhaps even taking some profits.
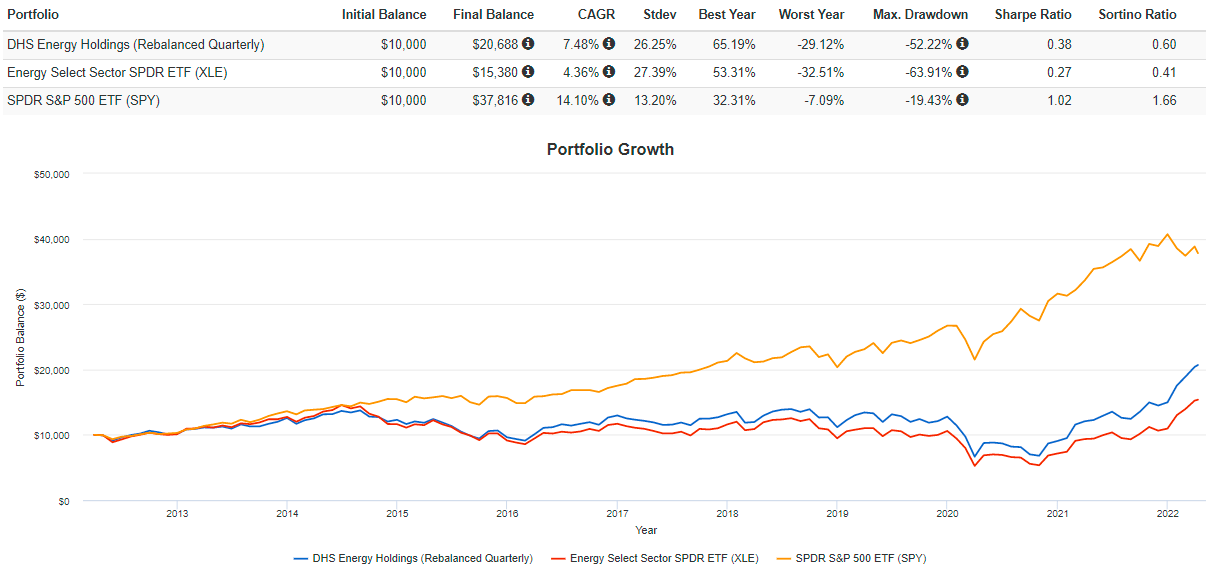
Portfolio Visualizer
Investment Recommendation
The WisdomTree U.S. High Dividend Fund continues to score well on valuation, growth, yield, and volatility. Investors who recognized the need for inflation protection and the market’s switch to favoring value stocks were rewarded, as DHS has been one of the best dividend ETFs to own in the last six months. After updating my fundamental analysis, DHS continues to rank near the top. This quarter, you can expect a yield of around 3.40%, and the 15x forward P/E is a standout feature. Not many ETFs offer this attractive combination.
My rating on DHS today is a buy, but it’s a cautious buy. Readers should understand that much of the recent gains are linked to high oil prices that won’t necessarily continue and may even completely reverse. The Fed has been transparent that fighting inflation is a priority, and total exposure is now at 19%, above my target range. Taking some profits off the table is probably a good move in the event of a correction. We’ll know more after this earnings season concludes, and I look forward to providing more updates as market conditions change. Thank you for reading, and feel free to continue the discussion in the comments section below.
Be the first to comment