

Bilanol
When I first started investing in the late 1980s utilities were considered to be optimum income investments: safe “widows and orphans” income generators that could be relied on to provide income in good times and bad. ETFs indexing the Utility Sector have lived up to their reputation even over the past 10 years, providing a far better return than have bonds while providing gains respectable for stocks, even though they did not participate in the extremes of the long bull market, they did deliver substantial returns.
The chart below shows you the total return of the Vanguard Utilities ETF (NYSEARCA:VPU) which tracks the entire GICS Utility sector, the Vanguard Total Bond Market Index ETF (BND), which tracks the US bond market, and the S&P 500’s total return.
Seeking Alpha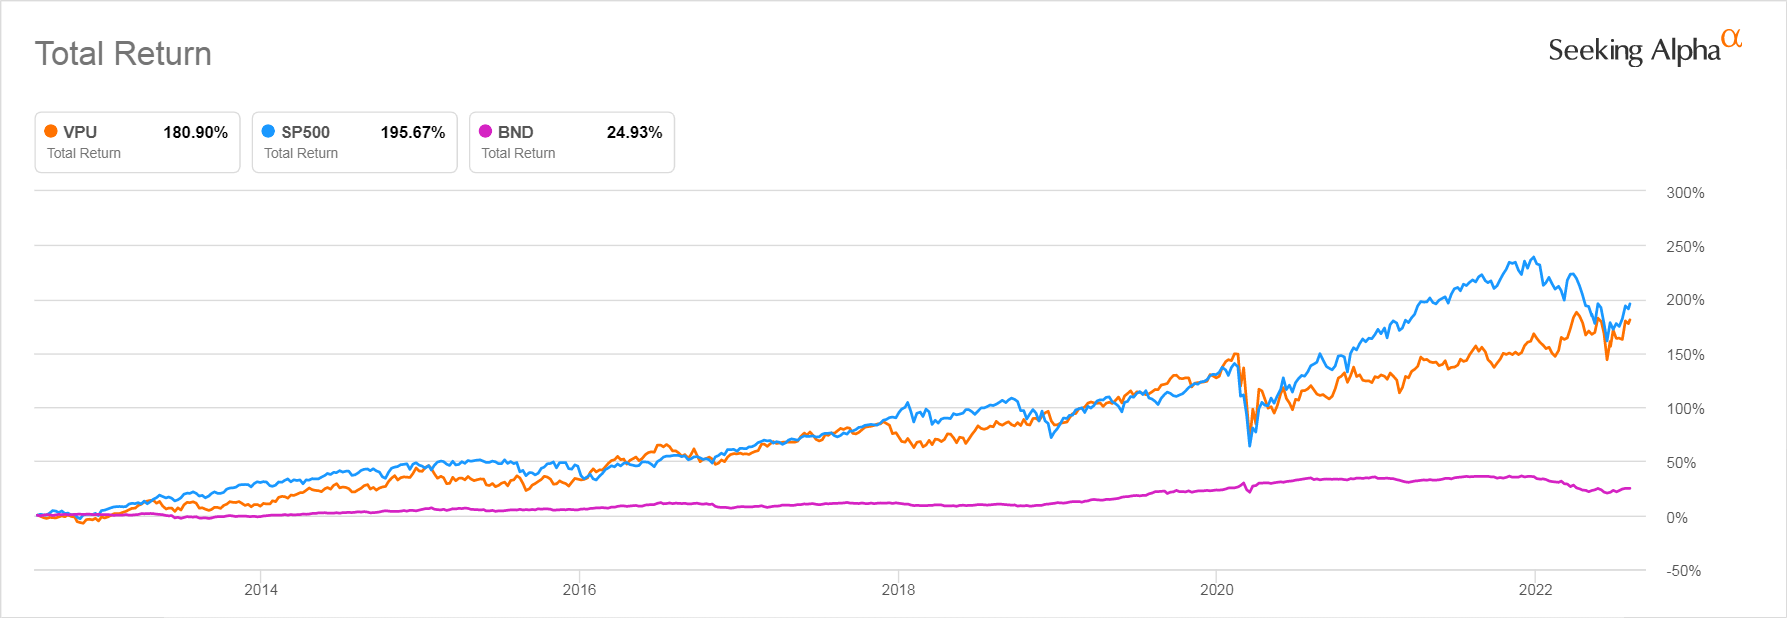
But now, after decades when inflation has not been an issue, we find ourselves facing persistent inflation that is currently over 9% and which shows no signs of abating any time soon. This poses a serious threat to a bull market that has been turbocharged by cheap money made possible by central banks worldwide intervening continually to keep interest rates near zero.
Investors born after 1970 have no personal experience of inflation. Data about the market stretching back to the period of maximum inflation stretching from the Oil Shock of October 1973 to 1981 is hard to find online. Most backtests you will see used to illustrate various investing theories only go back to the mid-1980s, a time when inflation had dropped significantly and the market had woken up from a decade-long period of stagnation.
The strategies that work so well in a cheap money world may fail spectacularly in an inflationary environment. In particular, the concept that a safe portfolio is one that is equally split between stocks and bond funds. Investors have learned the hard way that “safe” bond funds can experience double-digit NAV losses if rates move up only two or three percent. With inflation nearing 10%, the potential of painful losses from bonds should continue to worry any thinking investor.
The Dividend ETFs, which have been extremely popular during the period of cheap money, are also not turning out to be the safe haven many thought them to be. When inflation is at 9%, a stock or ETF paying 3.0% loses its allure when its NAV has lost more than 3% in a continuing bear market.
All this suggests it might be worth having another look at boring old utilities. Because if there is one thing we know, it is that when consumers cut back, the last thing they cut back on is “keeping the lights on.”
Investors who want to invest in the Utility Sector have several choices. The most popular is Utilities Select Sector SPDR Fund (NYSEARCA:XLU). XLU is older and more popular than is VPU, currently holding $16.78B in assets under management, compared to VPU’s $7.78B.
But XLU’s holdings are limited to 31 stocks that are held in the S&P 500. VPU more broadly represents the sector as it holds 68 stocks, more than twice as many as are found in XLU. Thus it gives a slightly better picture of the sector as a whole. Despite their different holdings, the two ETFs track very closely, though as you can see, XLU tends to slightly outperform. This is likely because its stocks have to pass the S&P 500 quality screen.
VPU and XLU Total Return Since VPU Inception
Seeking Alpha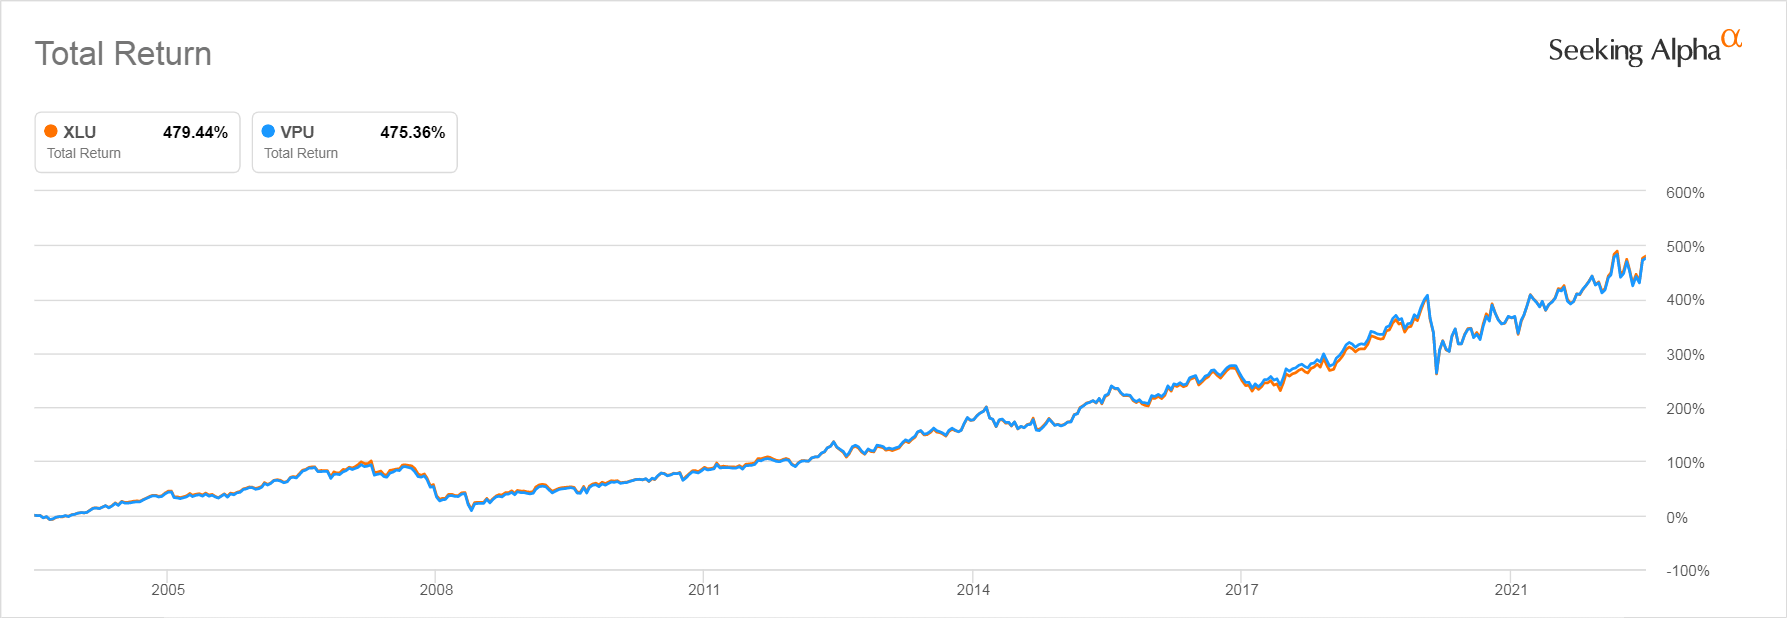
How Have Utilities Performed Since We Entered the Bear Market?
As you can see from the chart below. The gap between the performance of VPU has been impressive since the beginning of 2022. While the S&P 500 saw a double-digit decline, and even the supposedly safer, popular dividend-focused ETFs saw their total return turn negative, VPU delivered a gratifying gain.
YTD Total Return of VPU, SCHD, DGRO, VYM, and the S&P 500
Seeking Alpha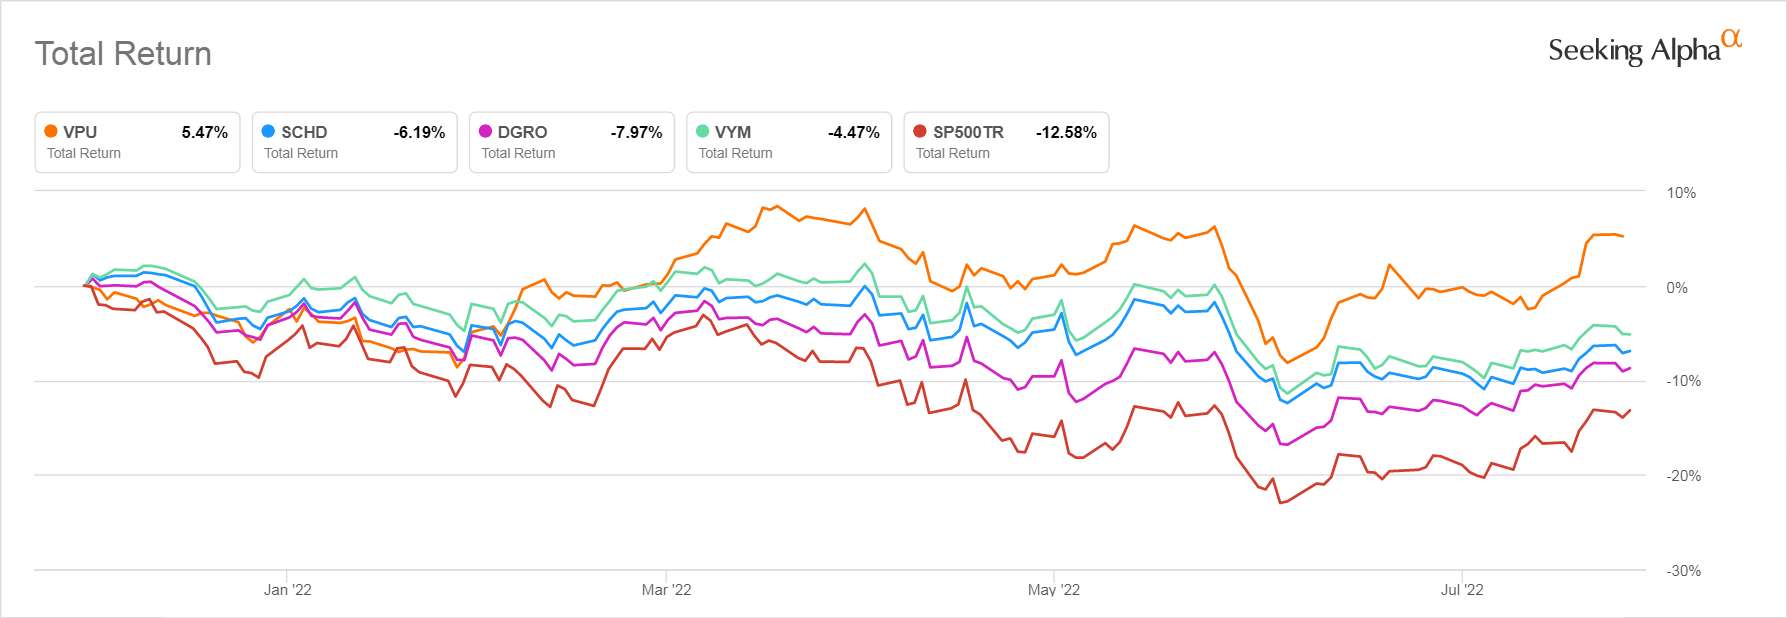
As you can see, the Schwab U.S. Dividend Equity ETF (SCHD), iShares Core Dividend Growth ETF (DGRO), and Vanguard High Dividend Yield ETF (VYM) have all seen their prices drop enough that their losses have eaten up the value of their dividend and more. VPU outperformed even the best-performing of these ETFs, VYM, by a full 10%.
This suggests, strongly, that Utilities may be better protected against the pressure exerted by rising interest rates than are dividend stocks, a topic we will return to.
How Did Utilities Do in the “Lost Decade” of 2001-2011?
The last time that the market hit the doldrums for a prolonged period of time was during the so-called “Lost Decade” of 2001-2011. Utilities also outperformed the S&P 500 throughout that period.
Below you can see the relative total return performance of XLU compared to that of the S&P 500 from the beginning of 2001 to the end of 2011. As you can see, the utilities ETF dramatically outperformed during this period.
XLU and S&P 500 Total Return 1/4/2001 – 1/2/2011
Seeking Alpha
Note that the above chart shows the total return, which includes dividends. But even when dividends are taken out of the picture and we only consider price, XLU still outperformed the S&P 500, though without the reinvestment of the richer utilities dividends XLU still experienced a “lost decade.”
XLU and S&P 500 Price Return 1/4/2001 – 1/2/2011
Seeking Alpha
Utility Stocks May Continue to Outperform Other Dividend Stocks from Other Sectors
The lost decade was disappointing for investors. And it does resemble our current market in that it was a period that followed a prolonged bull market that had entered bubble territory in its last few years. But the lost decade differs from the situation we find ourselves in now because inflation was a non-issue through most of that decade. That made the relatively modest returns of blue chip dividend stocks very attractive to income-seeking investors, especially after 2008 when the Federal Reserve began Quantitative Easing to keep interest rates near zero.
But now that inflation has ramped up again, companies are facing threats that investors haven’t seen since the late 1970s. The dividend stocks that have been most popular among income seekers, which are the stocks that make up large portions of the popular dividend income ETFs we looked at earlier, SCHD, VYM, and DGRO – concentrate in several sectors that will be under increasing pressure if our current high rate of inflation lasts more than a few more months, which it is almost certain to do.
Below you can see a table laying out what sectors the stocks of the more popular dividend ETFs concentrate in.
SCHD, VYM, and DGRO Sector Allocations
Schwab Asset Management, Vanguard, iShares websites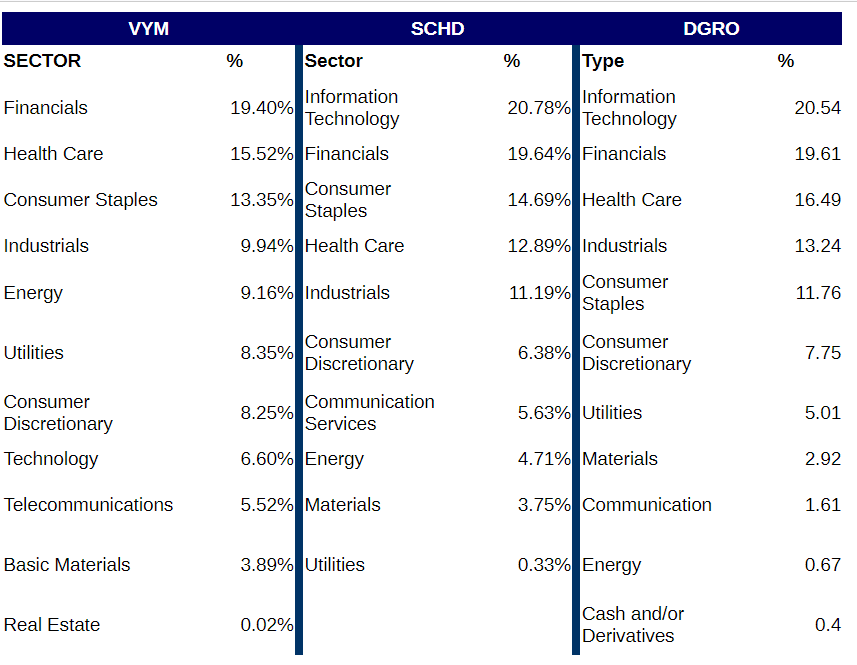
As you can see, stocks in the Technology, Financials, and Health Care sectors dominate these Dividend ETFs, along with the two Consumer-facing sectors, Consumer Discretionary and Consumer Staples, which in practice hold very similar stocks. Though each ETF pursues a different methodology for selecting stocks, with DGRO concentrating on a long history of dividend growth, VYM crudely selecting for higher than average dividends, and SCHD applying a weak value screen, these sectors dominate all three ETFs.
How High Inflation Challenges Technology, Health Care, Financials, and Consumer-Facing Companies’ Profits
Stocks in the Technology sector are under attack from several angles, some unrelated to inflation, and some which are causing inflation – most notably COVID-19-related supply line constraints. But even without those challenges, Technology companies are affected by inflation for several reasons.
One is that Tech companies generally need to borrow a lot of money to pursue R&D, and the cost of that money soars as rates rise to combat inflation. The other is that rampant inflation limits consumers’ buying power. Finally, companies whose overhead is rising due to rising prices for their raw materials, overhead, and transportation are likely to cut back on workers, which means they also cut back on the technology infrastructure needed to support those workers. They also are more likely to postpone bringing in new systems and software.
Health Care sector stocks also suffer in an environment where the employers providing highly paid white collar jobs cut back on the number of their employees, which they have already begun to do. That’s because only employees with generous health insurance plans found only at premium companies are able to afford the newest patented drugs and devices that lead to outsized health care sector profits. The uninsured and those covered by ACA plans or Medicare can theoretically access those drugs, but the copays are ruinous, so most are forced to use generic drugs and endure draining battles with benefit managers for access to medical services that middle-class professional employees take for granted.
Obviously, Consumer discretionary companies face issues. When prices rise faster than wages, consumers put off purchasing expensive new cars, jewelry, furniture and appliances. But even Consumer Staples companies are likely to come under pressure in an environment of sustained inflation.
Those of us who lived through the inflation of the late ’70s and ’80s remember those black and white cans of the ultra-generic brands that emerged when food prices surged out of control.
wikimedia.org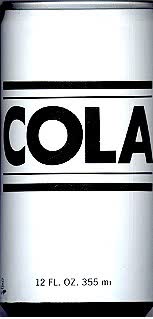
When prices for every item in the grocery store are rising by $0.25 or $0.50 a month, consumers look for the cheapest alternative, even as food companies are facing surging costs for raw materials, transportation, and wage hikes necessary to keep employees from leaving which force them to raise their prices even higher.
These cheaper generic products are produced by the likes of Coca-Cola (KO) and PepsiCo (PEP). Their quality might not be as good. But shoppers will go for the cheapest alternative when they have barely enough money left to buy groceries after paying rents that have risen far faster than their wages as is happening now, and after commuting costs and energy bills may be double what they usually pay this winter due to the surge in oil and gas prices.
Financial companies, too, will suffer too during a prolonged downturn. In states where it is permitted, many consumers will drop their car and home insurance as they can’t afford to pay for it. We are already seeing far fewer home buyers applying for mortgages. More consumers are already starting to fall behind on their credit card payments, too.
Regulated Utilities Can Pass On Their Inflation-Related Costs to Ratepayers
Like all companies, Utilities are facing higher costs for materials, transportation, and employee wages. But because in the United States Utility companies are largely regulated at the state level where lawmakers usually cave into their demands for higher rates, they are able to recover those costs by passing them on to customers in the form of higher rates. Anecdotally, my Eversource (ES) electric bill has been rising relentlessly each year, before inflation became a factor. It is going to be horrendous this winter. Not so coincidentally, Eversource stock is still in positive territory YTD, up 1.66% this past year according to Seeking Alpha.
How Did Utilities Perform in the 1970s Inflationary Period?
Given that the last period when the U.S. experienced runaway inflation was the period after the 1973 Oil Shock, a look at how utilities performed during that period should help us answer the question of whether utilities are a safer investment than other kinds of dividend-paying stocks.
The problem I ran into when trying to study this is that it is very difficult to find performance data online for stocks and mutual funds older than 1985. Most easily accessible information dates back, at best, to 1985. But we have to work with what we have, understanding that there are serious limitations in how relevant it might be to understanding how stocks will perform going forward.
Utilities Appear to Have Matched the S&P 500 During 1970s Inflation
Below you see a chart tracking the Total Return of the Franklin Utilities Fund (FKUTX) from the beginning of the Oil Crisis in October of 1973 through the end of 1980, when inflation had reached an annual rate of 13.5%. This was the first Utilities mutual fund, which began trading in 1948. Though you should keep in mind that it is an active mutual fund that had a very high expense ratio and upfront investment loads, which would have diminished its returns compared to what you could have gotten from an index fund like VPU or XLU had one been available at the time, which it wasn’t.
The Franklin Utilities Fund Total Return in the Inflationary Period
October 1973 – December 1980
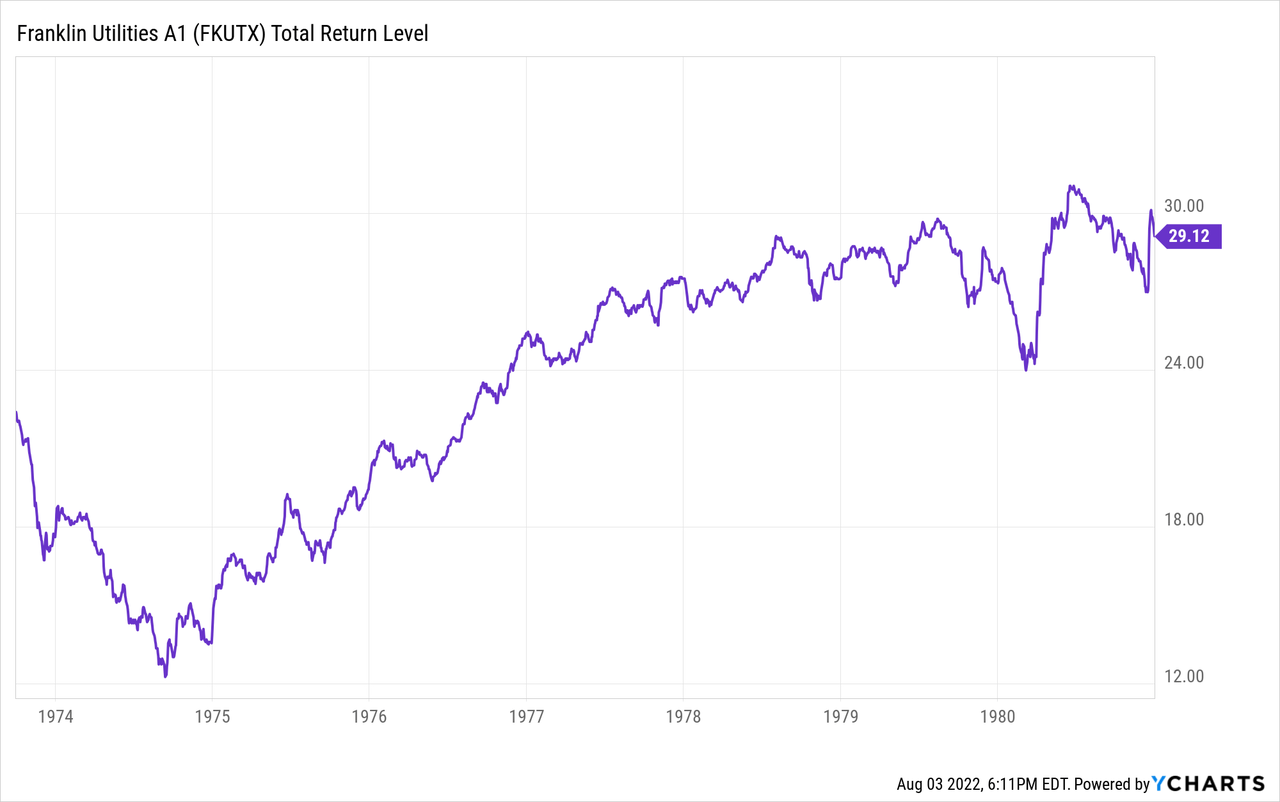
The S&P 500 total return series only become available for a period after the period I am mapping, so I can only show you a price chart for the S&P 500 over the same period without its dividends.

You can see that the Utility fund appears to have significantly outperformed the S&P 500 during the years between 1976 and 1980 when the S&P 500’s price mostly traded in a range. But the S&P 500 chart is a price chart, while the average dividend of the S&P 500 throughout this period was 4.63%. So the total return of the S&P 500 would likely have been as good if not better than that of the utility fund during this time. That said, stock investments in this period were not keeping up with the ravages of inflation.
And of course, even if there was a small benefit to investing in Utility stocks at that time, we must remember that after a decade of stagnation, the economy took off in 1982 and kept going, with a few short breaks until 2000, so those who had bought the S&P 500 at its most stagnant period in the 1970s still ended up with returns that far exceeded those of investors in the Utility Fund.
Franklin Utilities Fund and S&P 500 – 1980s Bull Market Returns
Seeking Alpha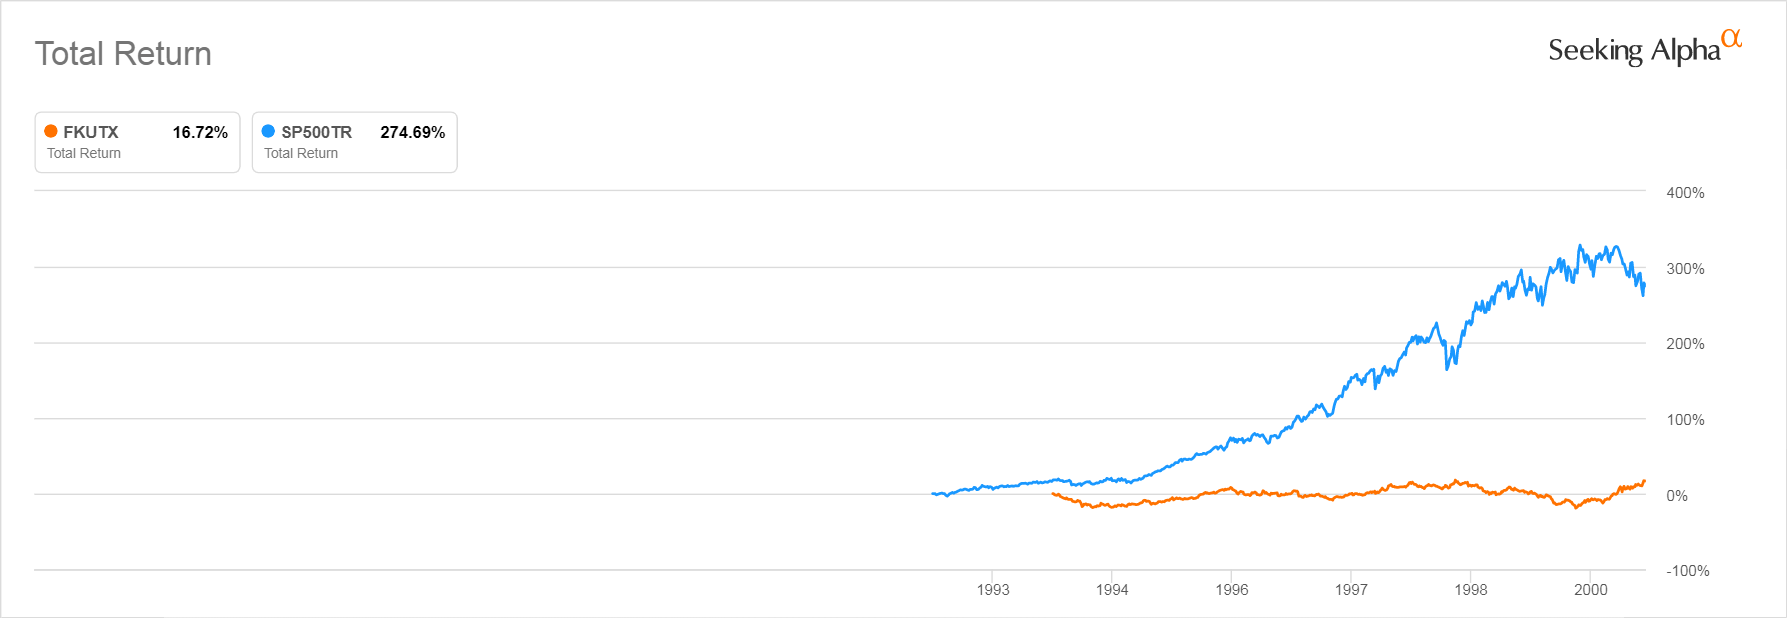
Comparisons With the 1970s May Be Misleading as Investing is So Different Now
Past performance suggests that there was no significant advantage in investing in Utilities in the 1970s. But investing was extremely different in that period from what it is now.
Brokerage commissions were high enough that in 1974 a transaction typically cost 0.90% of the value of the stock traded. This discouraged small investors from buying stock. So most stocks were bought by institutions, including the pension funds that provided for the retirements of all employees eligible for pensions. Mutual funds had high investment minimums, expense ratios of as much as 3%, and upfront investment fees. There was no programmed trading. There was no retail day trading. Retail investors looked up their stock’s price in the daily newspaper every morning unless they were customers of a broker who would look up a ticker price for them, but who was much more likely to call them with a hot tip than help them invest sensibly.
More importantly, that was a period when bad news was still bad news. Interest rates were far higher throughout that period than they are now even before the 1973 Oil Shock. Most importantly, back then the Federal Reserve always kept rates above the inflation rate.
In 1972, before the oil crisis ramped up inflation, the US annual inflation rate was 3.27% while the Federal Funds rate averaged 4.44%. Today with inflation running at an annualized rate of 9.1%, the Federal Funds rate is a pathetic 2.25%, even though the thought that the Fed might raise its rate by another 0.75% in September sends shivers through the market.
If the Fed Rate Crosses Over 4%, the Slow Growing Utility Sector Will Have No Appeal to Investors Until its Price Crashes
My own memories of investing in the early 1980s were that of the best available investment was a money market fund, a form of investment that just became available sometime around 1981. The money market fund was an excellent hedge against inflation as it featured high double-digit yields that closely tracked the Federal funds rate.
Before money market funds were available, investors could have invested in very short treasury bills. The average annual Federal Funds rate over this period is shown in the table below.
macrotrends.net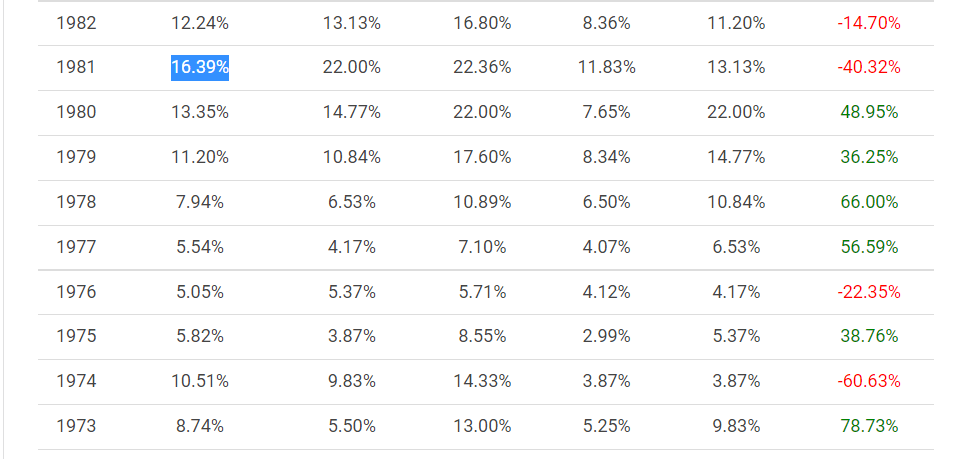
Treasury bills will become more and more compelling of an alternative to stocks of all kinds if Treasury rates reach 4% and go higher. A look at the rates that prevailed through the 1970s -1980s period of inflation makes it clear just how much further rates might have to go to keep inflation from destroying our economy.
With this in mind, I return to looking at XLU and VPU. XLU’s yield for the year is currently forecast to be 2.77%. VPU is even lower at only 2.70%. It makes little sense to invest new money in these stock ETFs for income when you can get a highly liquid 1-year Treasury bill paying around 3%.
Only if the ETF prices crash to where their yield is far more competitive with Treasuries would buying them make more sense. And then only because of the hope that the earnings of the companies they hold will swell with inflation and push up stock share prices over time, which would make them a better investment than Treasuries. But there is no guarantee that will happen.
Utility Sector Yields are the Lowest They Have Ever Been
But those low yields point to a huge problem and one that probably makes all our backtesting moot. The cash dividends paid by XLU and VPU have been steadily rising, with only occasional blips as you can see from the charts below.
XLU Dividend Payment From Inception in 1998
Seeking Alpha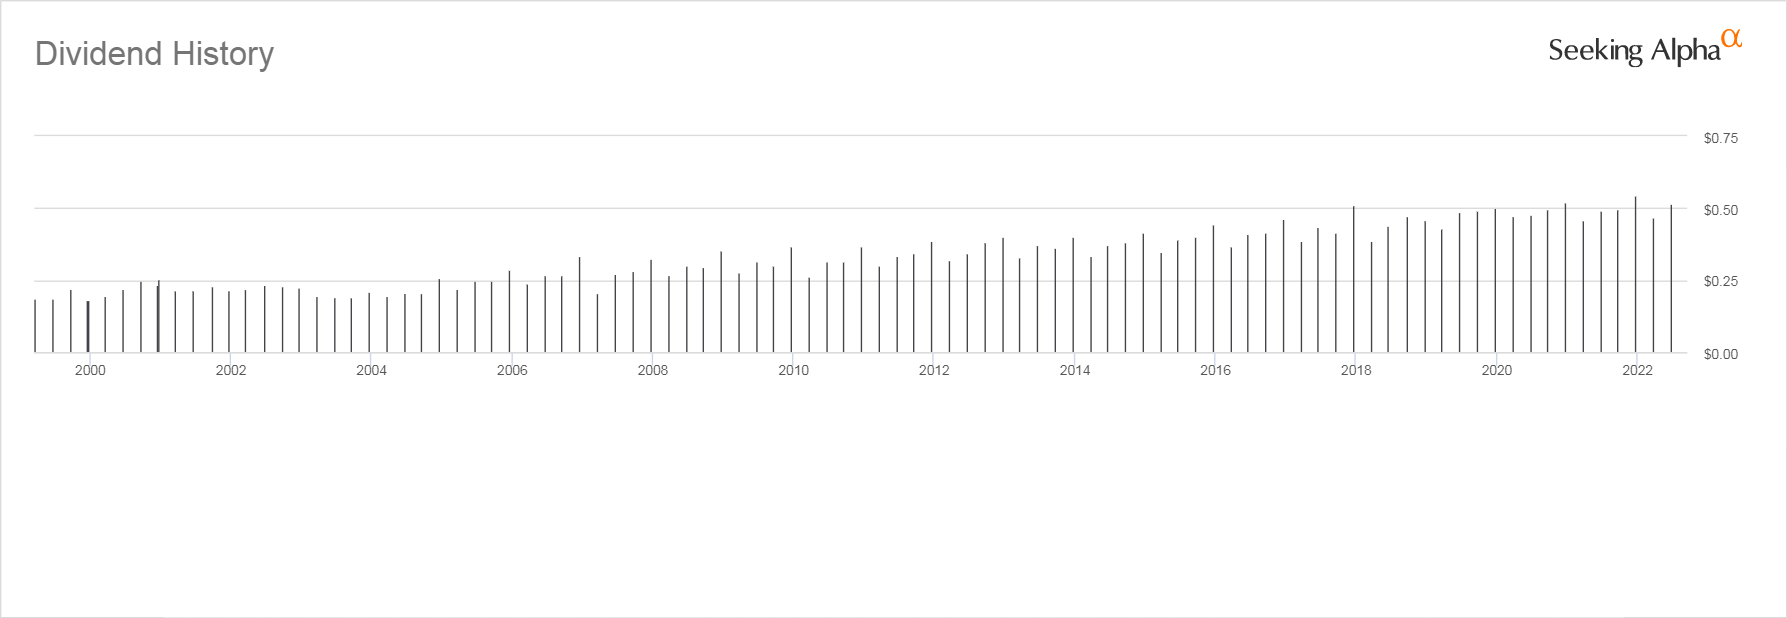
VPU Dividend Payments From Inception in 2004
Seeking Alpha
But the dividend yield of XLU and VPU is another story. Data is only available online for its past 10 years of dividend yield, but as you can see, VPU’s yield has been trending down for years.
VPU Dividend Yield 2012 – 2022
Seeking Alpha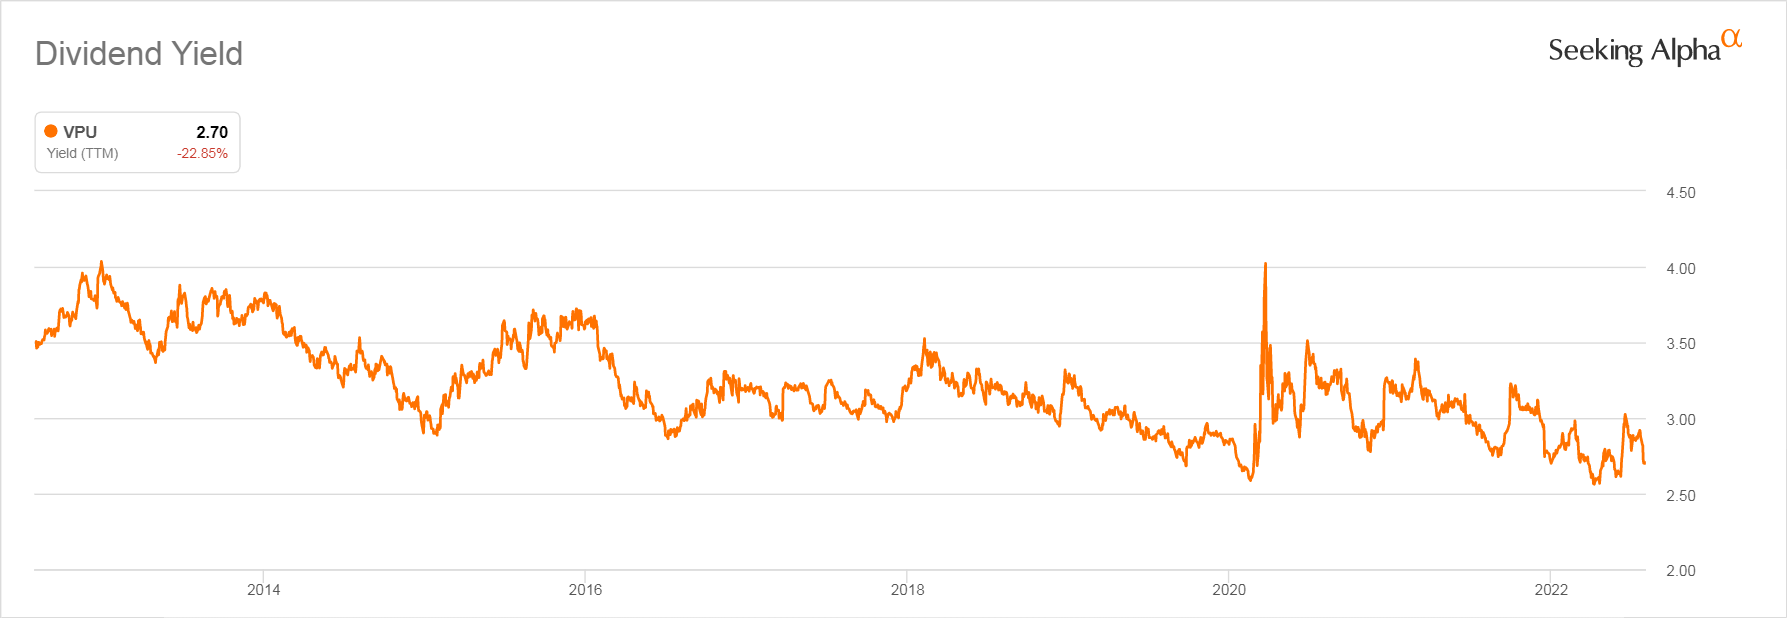
XLU Dividend Yield
Seeking Alpha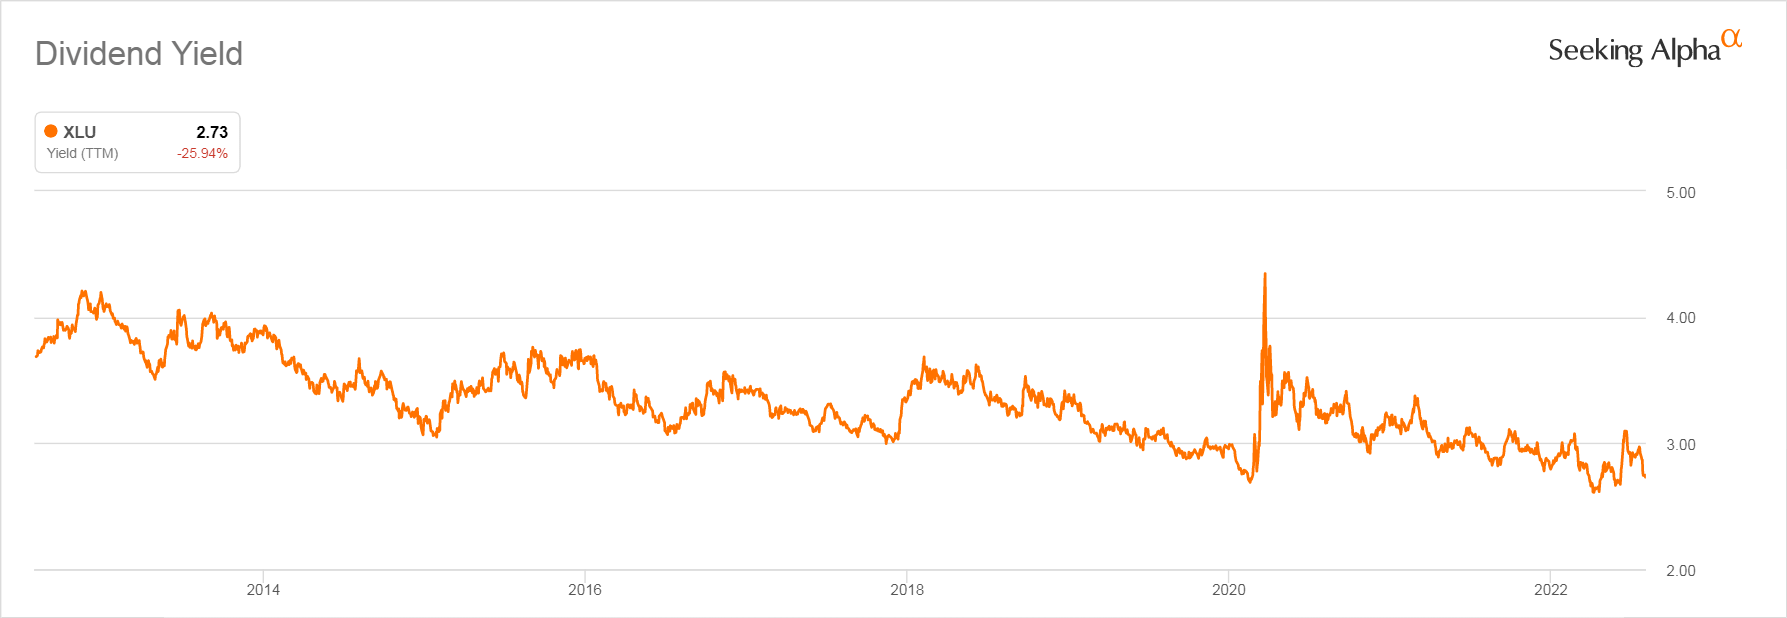
Given that these ETFs’ cash payments have been rising, the steady decline in yield reflects the extent to which the valuations of utility stocks have risen over the period when investors have been desperate for yield and thus willing to pay too much for income-producing stocks.
While utility regulators will allow utilities to raise their rates, they are less likely to allow them to boost their dividends at a time when the economy is under serious pressure.
Stocks were not overvalued like that in the 1970s, when the P/E ratio of the S&P 500 was often in single digits. With those lower stock valuations, stock yields were much higher. This makes conclusions about future performance based on performance of stocks in earlier periods of questionable use.
Bottom Line: Buy Utility Sector ETFs Only When Priced for a Better Yield
Though Utilities have held value and are likely to do so, their yield is too low to attract income-seeking investors and the only way their yields will rise to become more competitive with resurgent fixed income offerings like Treasuries or CDs will be if their prices fall.
Be the first to comment