

littleclie/iStock via Getty Images
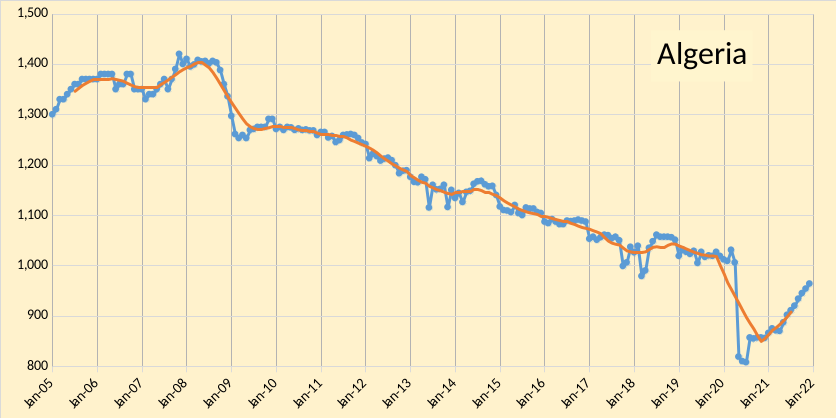
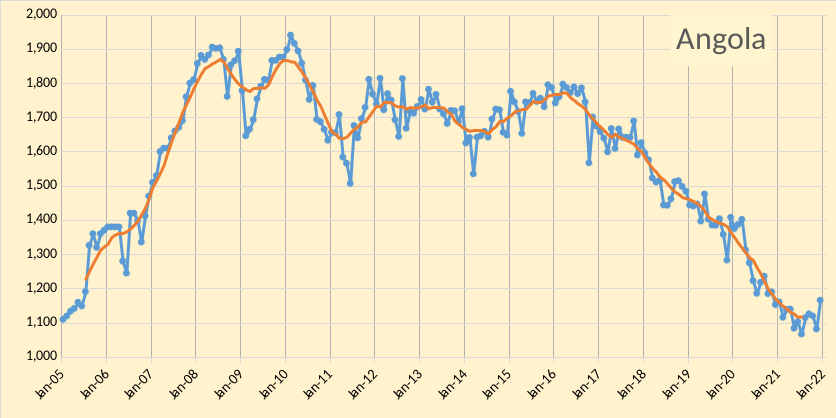
The OPEC Monthly Oil Market Report (MOMR) for January 2022 was published this past week. The last month reported in each of the charts that follow is December 2021 and output reported for OPEC nations is crude oil output in thousands of barrels per day (kb/d). In the charts that follow the blue line is monthly output and the red line is the centered twelve-month average (CTMA) output.
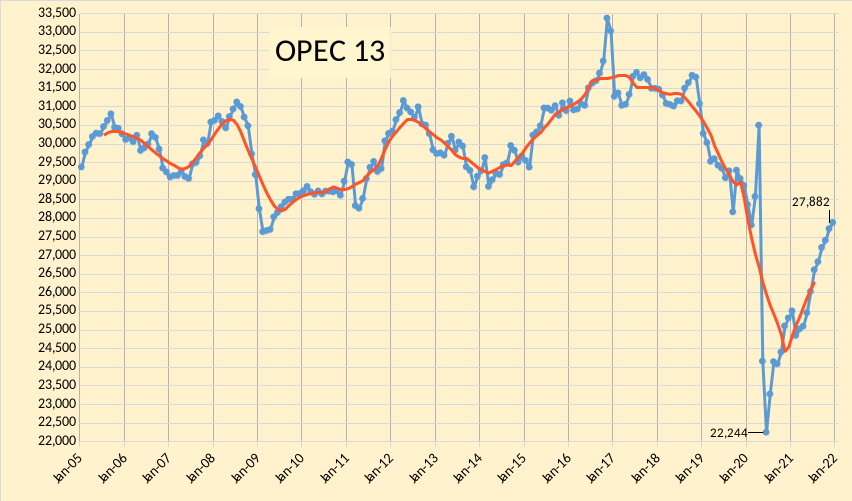
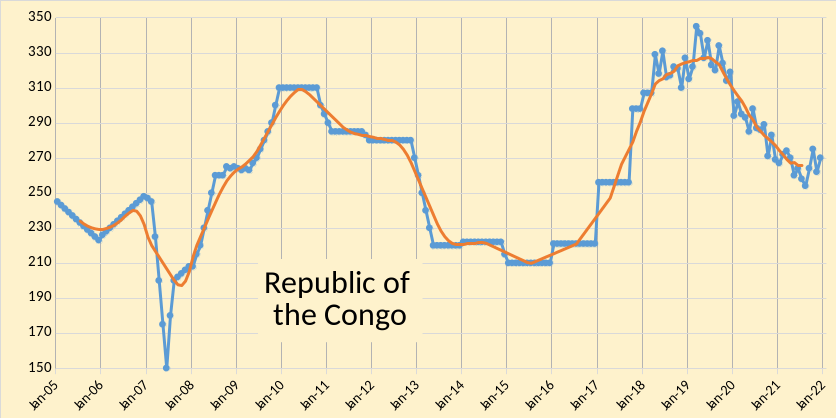
Figure 1
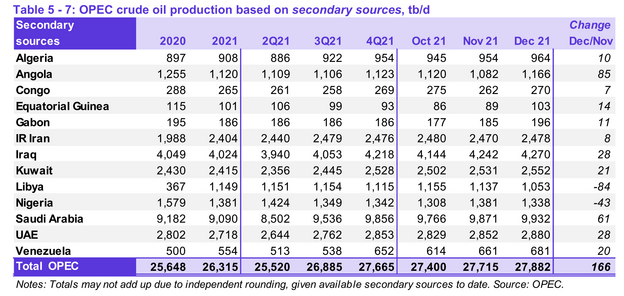
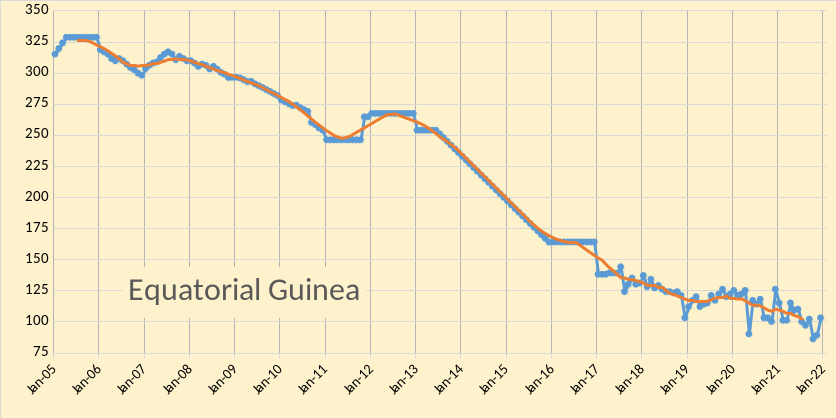
Figure 2
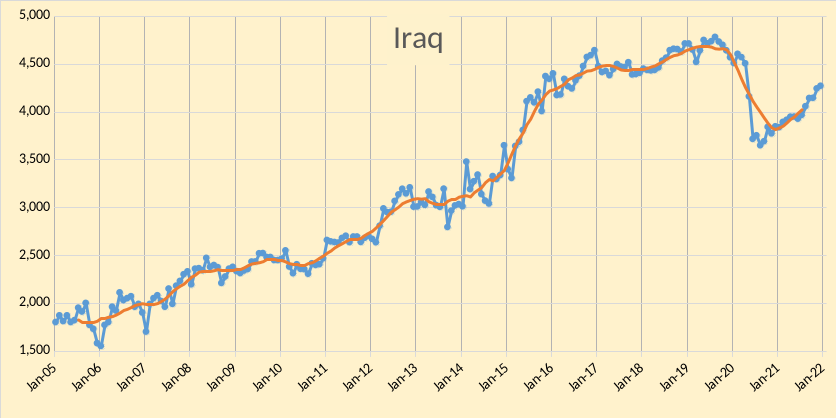
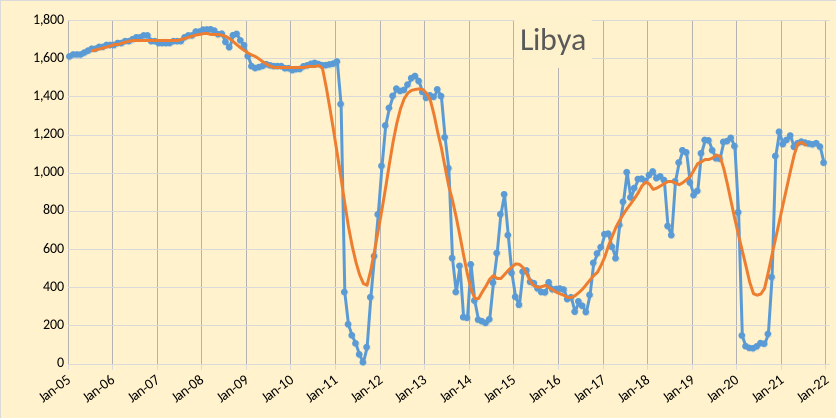
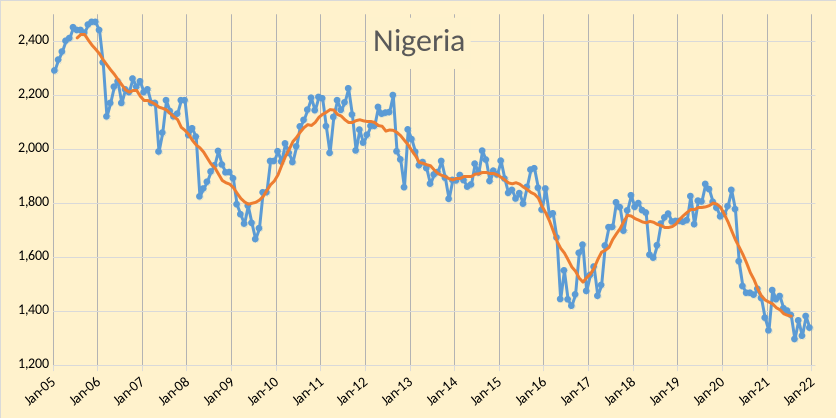
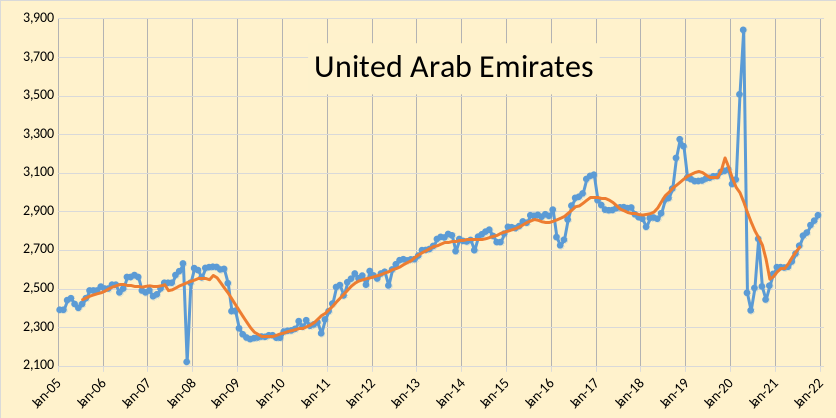
OPEC produced 27882 kb/d of crude oil in December 2021 based on secondary sources, an increase of 166 kb/d from November 2021. October 2021 output was revised lower by 32 kb/d from what was reported last month and November 2021 output was revised down by 2 kb/d compared to the December MOMR. Most of the increase in OPEC output was from Angola(85 kb/d) and Saudi Arabia(61 kb/d) followed by Iraq (28 kb/d), and UAE (28 kb/d). Seven other OPEC members saw increases of less than 22 kb/d in December 2021. Decreased output from Libya (84 kb/d), and Nigeria(43 kb/d).
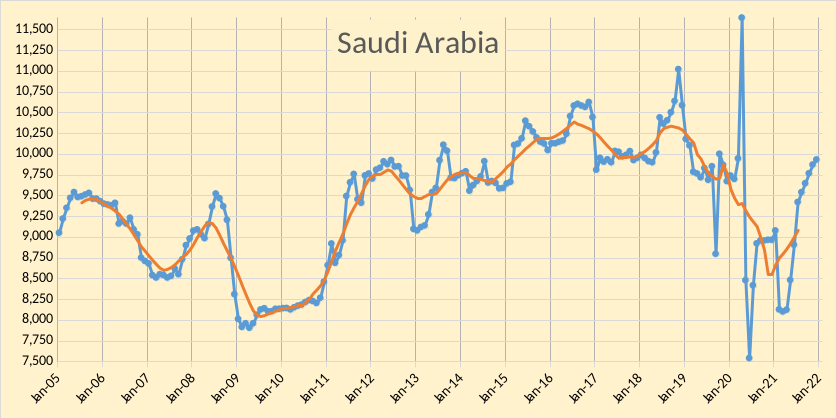
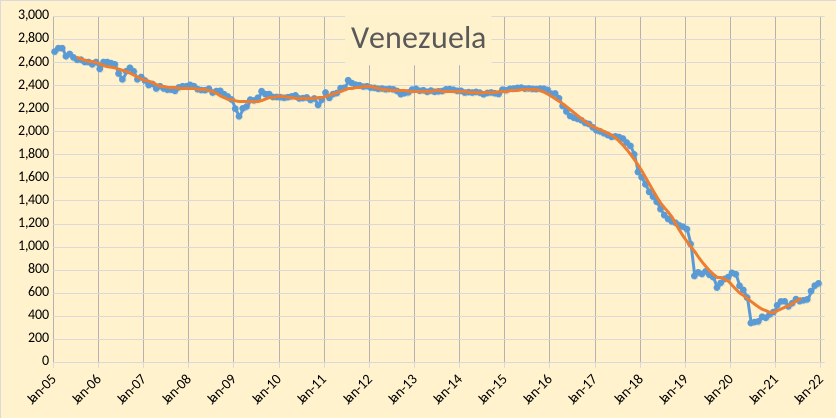
In the chart below OPEC 13 crude and Russian C+C are shown, I expect that OPEC 13 will struggle to get to 29000 kb/d and Russia will likely top out at about 11000 kb/d, where I assume there will be no near term sanctions relief for Iran and Venezuela (together they might add 1800 kb/d in the medium term if sanctions were removed.) Over the next 6 to 12 months we might see 1215 kb/d added from Russia and OPEC 13. I doubt they will be able to increase by 350 kb/d each month as suggested by the DOC.
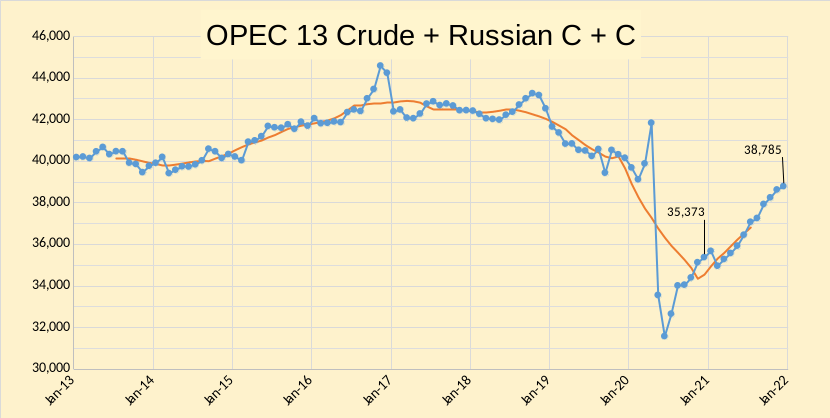
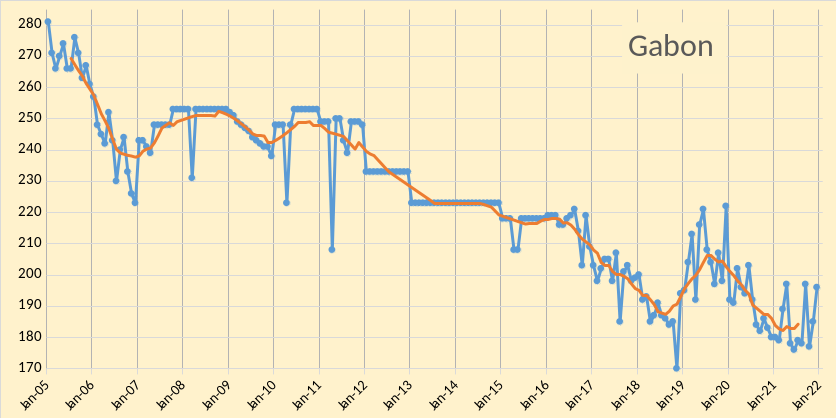
Figure 3
World liquids output increased by 0.65 Mb/d in December 2021 to reach 98.51 Mb/d, this is about 2.2 Mb/d less than liquids output in January 2020.
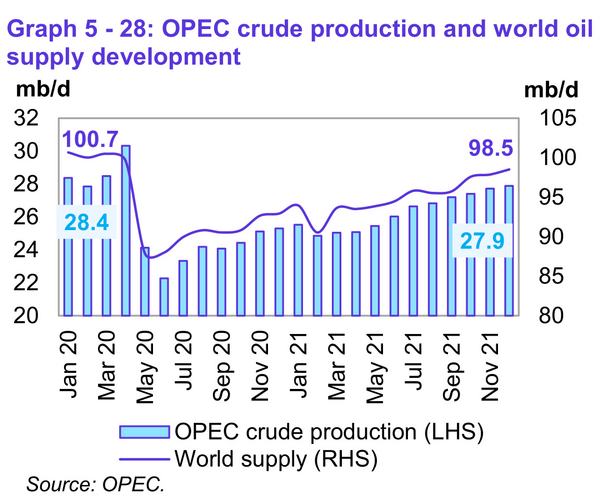
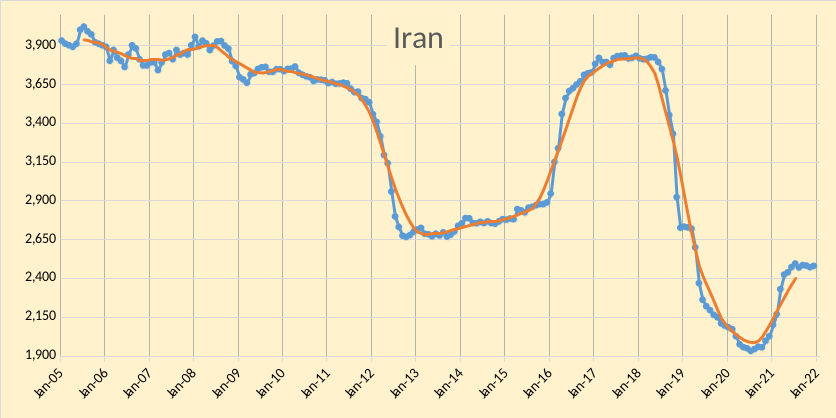
Figure 4
OPEC
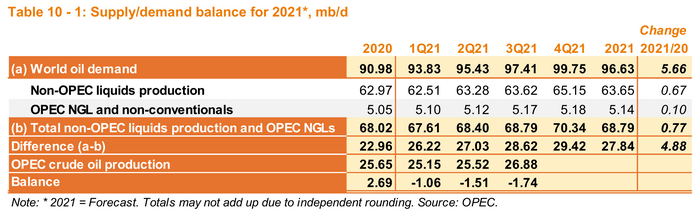
Figure 5
OPEC
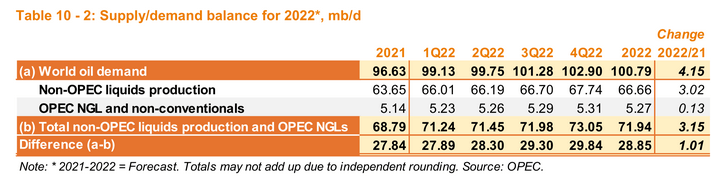
Figure 6
OPEC
There will be a significant stock draw in 2021Q4 if OPEC’s demand estimate is correct, about 1.75 Mb/d (or 159 million barrels). If OPEC meets its 250 kb/d quota increase each month from Jan to March, there might be a surplus of 492 kb/d in 2022Q1, but note the large increase in output assumed for non-OPEC in 2022Q1 (900 kb/d). It is unlikely this estimate will be accurate in my opinion. Also, consider figure 7 below that shows non-OPEC liquids output increasing by 3 Mb/d in 2022 with two-thirds of this coming from US and Russia. A better guess is about 1 Mb/d from Russia and the US combined in 2022. Note that this might increase the call on OPEC to 30.84 Mb/d in 2022Q4 and OPEC is likely to fall about 1.84 Mb/d short. If sanctions on Iran and Venezuela are removed by mid-2022, perhaps leaving adequate time for them to ramp up output (roughly 1.6 Mb/d has been taken off the market by the sanctions on these two nations) the supply crunch might be less severe.
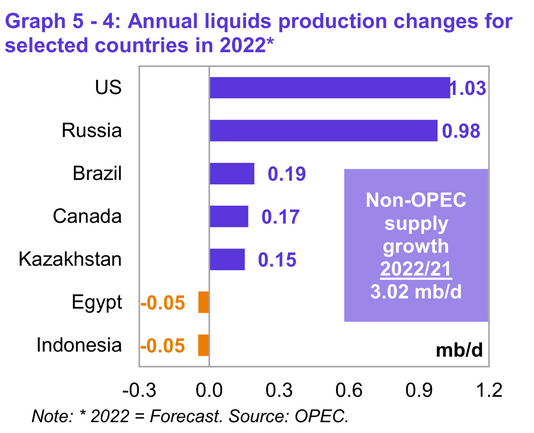
Figure 7
OPEC
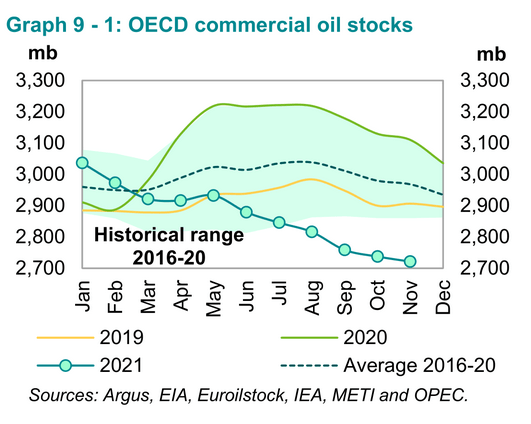
Figure 8
Argus, EIA, Euroilstock, IEA, METI, OPEC
From MOMR (page 65):
Preliminary November data sees total OECD commercial oil stocks down by 16.0 mb m-o-m. At 2,721 mb, they were 389 mb lower than the sametime one year ago, 247 mb lower than the latest five-year average and 221 mb below the 2015-2019 average.
My expectation is that OECD commercial stocks will continue to fall through the end of 2022.
Editor’s Note: The summary bullets for this article were chosen by Seeking Alpha editors.
Be the first to comment