


AlbertPego
This article will explore mortgage REITs, historically a popular income generating asset class, and why investors (and particularly retirees) should steer clear of them altogether. First of all, as a group, they are horrible performers, with the VanEck Mortgage REIT Income ETF (NYSEARCA:MORT) down 36% year to date, down 33% on a 5-year cumulative basis, and flat on a 10-year cumulative basis. That includes all dividends assuming they are reinvested into shares.
By comparison, High Yield (HYG), perhaps the best income-oriented comp, is down 14% year to date, up 4.2% cumulatively over five years (0.82% annually), and up 30.6% cumulatively over a decade (2.7% annually). While these are not great returns either, they mean that $10,000 in HYG would be worth $13,624 over a decade.
A $10,000 investment in MORT a decade ago would today be worth $10,142 even with all of those juicy dividends. What a disaster.
What we’ll demonstrate is that Mortgage REITs have been and likely will continue to be doomed asset classes (unless we reach a state of a steep and unflinching yield curve). These vehicles borrow short (they “repo” or enter into repurchase agreements, often a mix of Agency and non-Agency bonds), levering them 2-9x depending on the name, and attempt to manage convexity and duration as best as they can. But fees are extremely high, dividends are almost always in excess of real economic earnings, with management teams demonstrating little ability to navigate the inherent negative convexity associated with a mortgage REIT (i.e. manage changes in duration).
Today in particular, an inverted yield curve will continue to bash book values.
The bull case surrounding mortgage REITs is that they are trading at big discounts to NAV, earnings multiples appear cheap, with enticingly high dividend yields. The reality is that these are borderline designed to fail investments, often preying on unsophisticated retail investors looking for yields that across the board are too good to be true.
Quick Background
Most probably are aware of many mortgage REITs, with Annaly (NLY) the biggest name in the space. Often bigger is better. Scale benefits mean fees are lower and a successful strategy can lead to capital inflows and growth. Still, NLY is down 18% cumulatively in a decade, and only up 3.7% annually had an investor timed a purchase well in 2007.
Below are 10-year return figures with Annaly down 18% cumulatively in a decade.
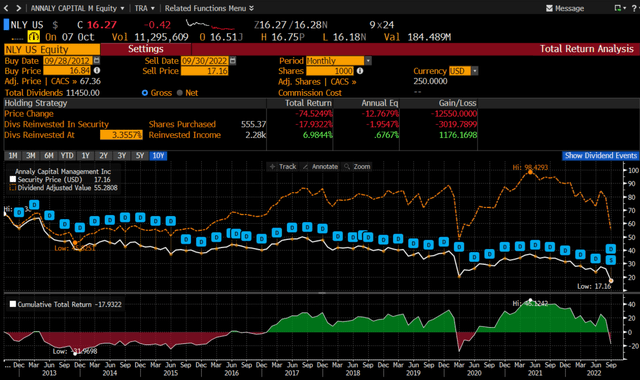
NLY returns (Bloomberg)
The typical mREIT portfolio is let’s say 5x levered, using REPOs to fund the purchase of a variety of mortgage bonds. Mortgage bonds are mostly comprised of 30-year fixed mortgages, 15 years as well as a mix of adjustable rate mortgages (or ARMs). Most are implicitly guaranteed by the US government via one of the Agencies (Fannie Mae/Freddie Mac). Those not guaranteed (often jumbos) are non-Agency bonds. MFA is the main player in the non-Agency arena.
In the event of a default on a FNMA bond for example, Fannie will backstop the bond and cover interest and principal. So, while there is no credit risk per se, there is duration risk. Indeed, homeowners can prepay a mortgage, and by extension RMBS (residential mortgage-backed securities) can be prepaid without penalty at any time.
So, when rates are low, attractive bonds at higher coupons get pre-paid early. When rates spike as they do now, RMBS investors (and mortgage REITs) get left holding the bag so to speak. It’s lose-lose for the mortgage investor (and the mortgage REITs) and win-win for homeowners with mortgages.
Put differently, mortgage REITs rarely benefit from lower yields (and higher prices/asset values) on long duration paper (as bonds typically get called away). But they always get stuck owning mortgage paper that trades down when rates rise.
Digging In
Annaly, for example, owns $59 billion in mortgage securities (mostly 30-year fixed Agencies), funded with $51 billion in Repos. They have $850 million in cash and $1.5 billion in preferreds. That leaves them roughly $10.5 billion in equity. With a market cap of $7.6 billion and a dividend yield of 21%, a lot of investors may get pretty excited. At a 30% discount to book value, the stock optically appears cheap. Not to mention the fat yield: 21% seems amazing (but yes, too good to be true).
Here is what a very simplified, sample income statement may look like for NLY.
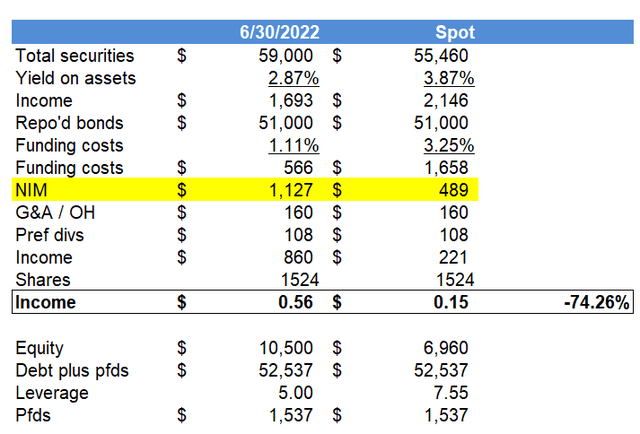
Sample Income Statement (Author spreadsheet)
These are simply illustrative figures, but note how much net interest margins (NIM) would get hit when asset yields rise less than funding costs.
Funding costs (Repo rates) have moved significantly higher with Fed fund rate increases. That means their 1.1% funding costs will soon roll into 3.25% funding costs. The average maturity of their liabilities is only 30 days give or take (80% of Annaly’s Repos are under 30 days). That means their costs reset within a month. But the value of long duration assets like Agencies can get clobbered.
Below is a graph of an on the run 30-year 3% FNMA mortgage bond. Yields at a CPR (constant prepay rate) of 4% are up 100 basis points (1%) to 4.66%. Prices have plunged 8% since August 1st.
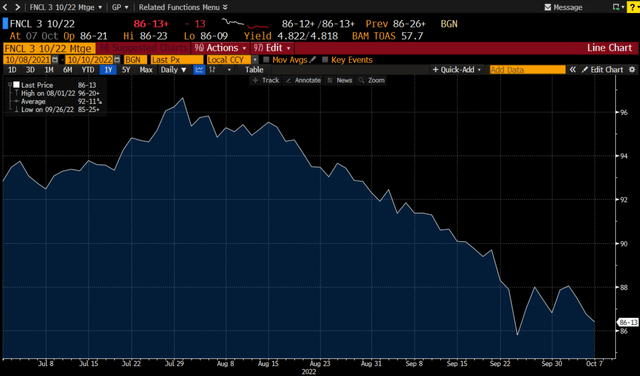
Fannie 3 Years (Bloomberg)
When we plugged in new costs (they do hedge some of their Repos with long dated swaps to lock in some of the costs), earnings are down from 74% sequentially. It may not be that bad with some hedges in place, but those will eventually roll off. Since quarter end, these asset values are down 6%. That takes equity down 30% when 5x levered. So much for the discount to NAV.
That also takes leverage from 5.0x to 7.6x. In a single quarter.
That means NLY either has to 1) sell some of their bonds in their portfolio to keep leverage levels intact or 2) raise equity. Unless they want to simply take the risk on higher leverage. That could mean margin calls on their Repo facilities too. No surprise then that Annaly has raised equity twice just since May. There will likely be more raises.
Usually when you see a stock trading at 3x earnings and yielding 21%, you would want management to buy back shares, not dilute themselves further.
We only modeled Repos heading to 3.25% (today’s level). Rates will likely continue northward until they hit 4.5% (per dot plots and Fed guidance).
In the example above, $0.56 of income evaporates to $0.15. Not only that, but Annaly should they choose to de-lever via selling bonds, will recognize losses on the portfolio.
And this is the crux of the problem with these vehicles. They constantly are realizing losses, but paying out dividends excluding these losses!
Below are the company’s non-GAAP adjustments to arrive at their “adjusted” earnings figure. We could not even fit all the adjustments on one page, but I think you get the idea.
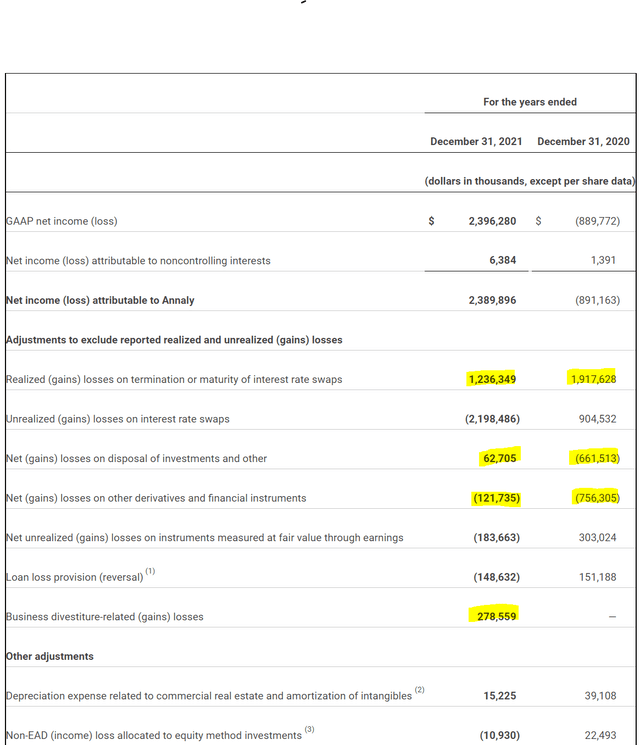
Non-GAAP adjustments (NLY investor relations)
Above we highlighted in yellow the realized losses (these are cash losses too) that were excluded in order to derive their adjusted earnings.
Just for fun, I dug through the last nine years of audited financials and added up the realized losses on the income statement. We ignored the unrealized gains and losses (because eventually they become realized). Here they are.
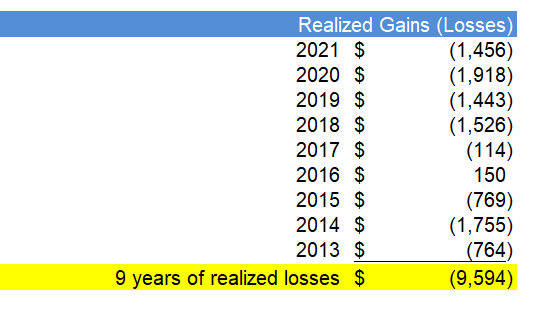
NLY Realized Losses (NLY financials/author spreadsheet)
For a company with a $7.6 billion market cap, there are almost $10 billion in realized losses that Annaly has suffered over the past nine years. That is $1.1 billion in average annual (recurring) losses that adds up to $0.70 in EPS annual headwinds.
There was only one year where the company realized capital gains out of nine.
Naturally this leads to NAV per share falling dramatically each year.
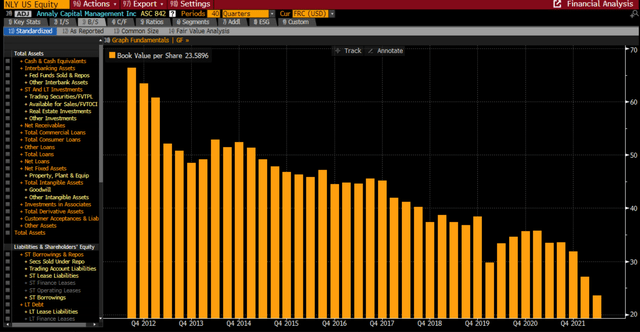
NLY NAV per share (Bloomberg)
Book value per share has dropped from $66 to $24 as of Q2 2022 (these are pre-split figures). Split adjusted and book per share has fallen from $15.85 to $5.90. That is a 63% decline in book value per share over a decade.
We’ve been picking on Annaly, but virtually all of the others operate in the same way.
Considered one of the safest mortgage REITs, AGNC Investment (AGNC), which only owns Agency paper, has also been a book value decliner.
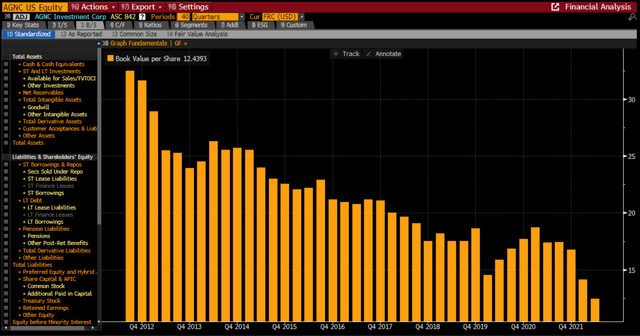
AGNC NAV per share (Bloomberg)
Chimera (CIM) was a darling for a while from 2010 to 2018, despite its tanking during the Great Recession by 80%. But its book has taken a beating too. From its IPO price in 2007 of $75, today CIM trades at $5.26.
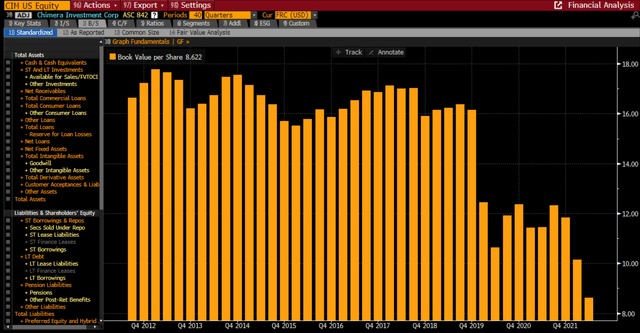
CIM NAV per share (Bloomberg)
Importantly, these realized losses are derived from poor buying/selling decisions, but will likely remain recurring as companies fight the negative convexity inherent in mortgage paper. To hedge negative convexity, that is to hedge the risk of durations increasing when rates increase, Annaly and others enter into interest rate swaps (and sometimes they buy swaptions). These can increase in value when rates move up (as they lock in lower priced liabilities), which in theory offsets the capital losses on an RMBS.
But nobody in the space has seemingly figured out how to manage convexity. Ellington Financial (EFC) might be the best at it, with a track record of earning 4.7% for investors over the past decade. But EFC is not a mortgage REIT. And their returns are still suboptimal.
Tax Inefficiency
One interesting side note to mortgage REITs is that income is taxed as ordinary income, not qualified dividends. So, investors get large quarterly payments in which they immediately owe taxes. If you hold a mortgage REIT for more than a year, then you will pay the piper on your dividends, but won’t be able to offset that with inevitable capital losses until you sell your equity.
In summary, these are high risk, highly leveraged instruments that seem to generate capital losses every year. The immediate outlook is as bad for mortgage REITs as I have ever seen. Annaly has cut the dividend from $2.20 a decade ago to $0.88 last quarter. We would be shocked to see the company maintain this level, especially in light of the inverted yield curve and cost pressures they will face as the Fed raises rates.
The only win scenario we can think of for mortgage REITs is that 1) yield curves steepen dramatically and 2) said yield curve remains stable. History doesn’t offer this goldilocks scenario very often. And the Fed’s mantra to keep rates higher for longer doesn’t bode well either.
Alternatives
We’d rather see investors purchase real companies, with real assets. Finco’s like this with massive leverage and high management fees have a slim chance of generating real returns. Property REITs like W.P. Carey (WPC), our favorite one yielding 6.0%, has generated 9.8% annual returns for shareholders over the past decade (even after its 16% decline in the past month).
A simple investment in the Consumer Staples ETF (XLP) has also generated 9.3% annual returns for shareholders. Our favorite, and in our view one of the highest quality staples is Mondelez (NASDAQ:MDLZ), with a 6-9% targeted EPS growth rate (and a history of growing EPS by 7.5% a year for the past decade). The stock yields 2.8% and its total returns have been 9.4% over the past decade.
Dividends are qualified and you can defer capital gains for years (as long as you don’t sell your shares). We consider it a solid compounder. Typically, MDLZ is a 20x stock, but today its trading 10% cheap to history. We peg $50 to $70 as our range of outcomes in 1-2 years, from $55 today. We were buyers on Friday.
Below is a 10-year chart of Mondelez stock, with its forward P/E ratio in blue (left axis) and its stock price in white (right axis).
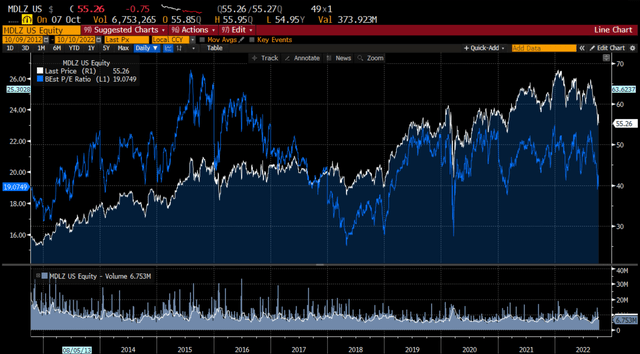
Mondelez price vs P/E (Bloomberg)
In our downside case, in a year, if MDLZ hits its 2023 $3.10 EPS estimates (from $2.90 in 2022), then at a trough multiple (16x) plus dividends, the stock would fall to $51. That is down 7%.
In our upside case, at its typical 20x multiple, MDLZ is up 16%. In 2 years, 20x implies a $71 stock or upside of 29%.
Conclusion
In a market where all stocks are falling, we get a glimpse of what names are riskier and what names are high quality. Mortgage REITs clearly fit into the highest risk category, with misleading yields, huge leverage and abysmal returns over the long term. They are down 36% this year with little hope for book value gains or perhaps even profits given the inverted yield curve.
We simply fail to understand their popularity and ability to raise capital. At some point, a brave soul may make money in a mortgage REIT via a well-timed trade, but it is exceedingly difficult, and often the names that did well in prior bad cycles, end up being the ones that get destroyed in the next bad cycle.
Editor’s Note: This article was submitted as part of Seeking Alpha’s best contrarian investment competition which runs through October 10. With cash prizes and a chance to chat with the CEO, this competition – open to all contributors – is not one you want to miss. Click here to find out more and submit your article today!
Be the first to comment