

Drazen_
The economy might not be conducive for real estate assets to perform in the short term. However, if we’re to be successful in the financial markets, we need to follow the golden rule of commerce, which is “buy low, sell high”. Furthermore, I’m aware that many investors are searching for high dividend yields due to risk aversion. Thus, I’ve decided to cover CTO Realty Growth (CTO) in today’s article, as I believe it ticks the necessary boxes for “best-in-class” total returns.
Factor Analysis
Starting off, I want to run through CTO Realty’s factor grades. These grades allow us to classify the REIT into a market category. Based on Seeking Alpha’s grades, CTO can be classified as a value asset, a growth asset, and a momentum asset. Additionally, Seeking Alpha’s factor grades suggest the REIT tends to outperform initial EPS targets, which could result in a growth trajectory.
So, how do these factor grades affect the REIT’s traded price?
They communicate that this REIT is likely to outperform the broader market whenever the majority of investors seek value, growth, momentum, and strong earnings-per-share securities.
Seeking Alpha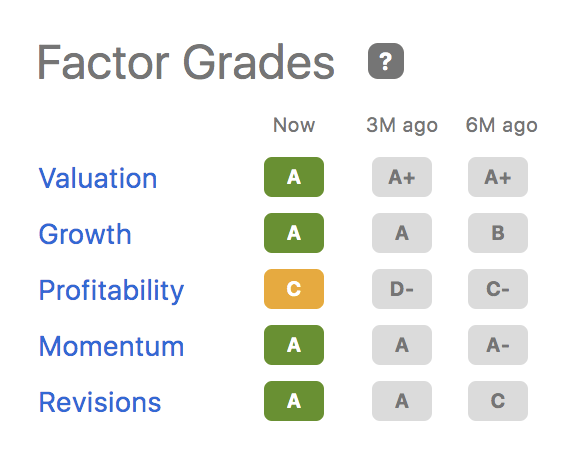
Let’s take things a step further by contextualizing the REIT’s factor grades in relation to today’s market.
We’re in a bear market and likely on the cusp of a global recession. Accordingly, market participants have drifted into a risk-off climate, subsequently shifting capital into assets classified by high dividend yield, low volatility, and value (see the diagram below). In my opinion, today’s investor sentiment aligns with those of previous bear markets, and I could see the trajectory resume for the foreseeable future.
CTO Realty fits the bill when it comes to current risk-off market sentiment. I say this because of CTO’s forward dividend yield of 8.51%, its low-volatility beta of 0.6x, and its price-to-funds from operations valuation ratio, which is currently at a 45.85% sector discount.
KoyFin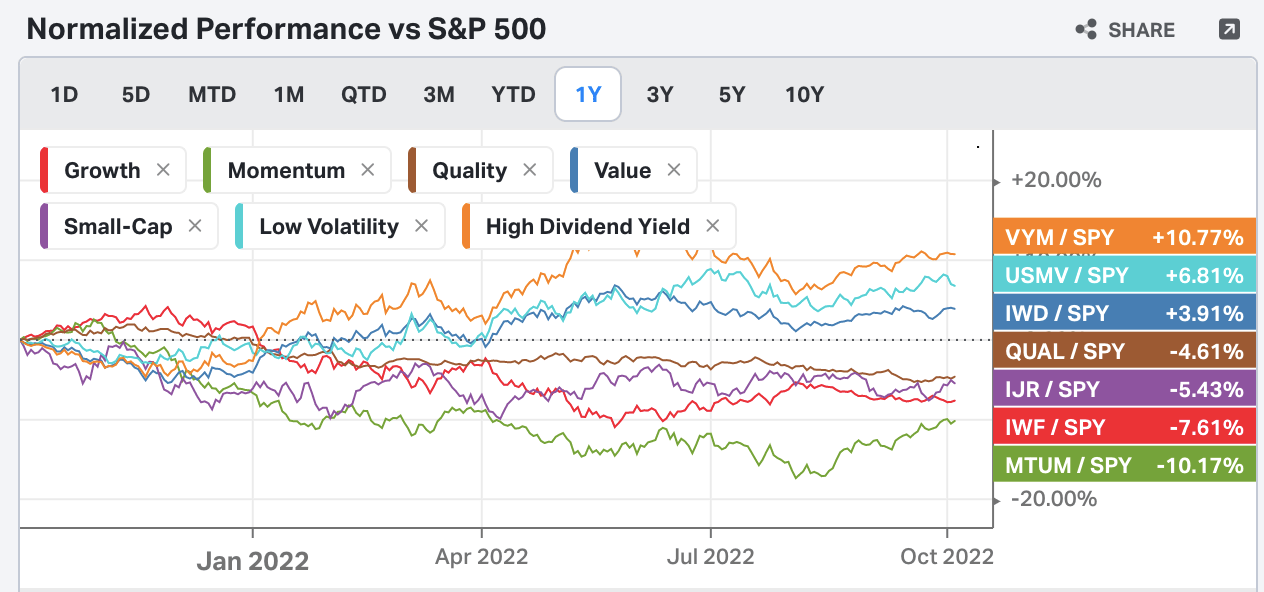
Systemic Interlinkages
This section juxtaposes the factor analysis by adding in a few macroeconomic variables. According to Seeking Alpha, U.S. REIT’s suffered further losses last week, adding to extended year-to-date drawdowns. CTO Realty’s exposure to the retail sector means its primary influence is the consumer goods space, while its secondary influence is the broader property market.
Seeking Alpha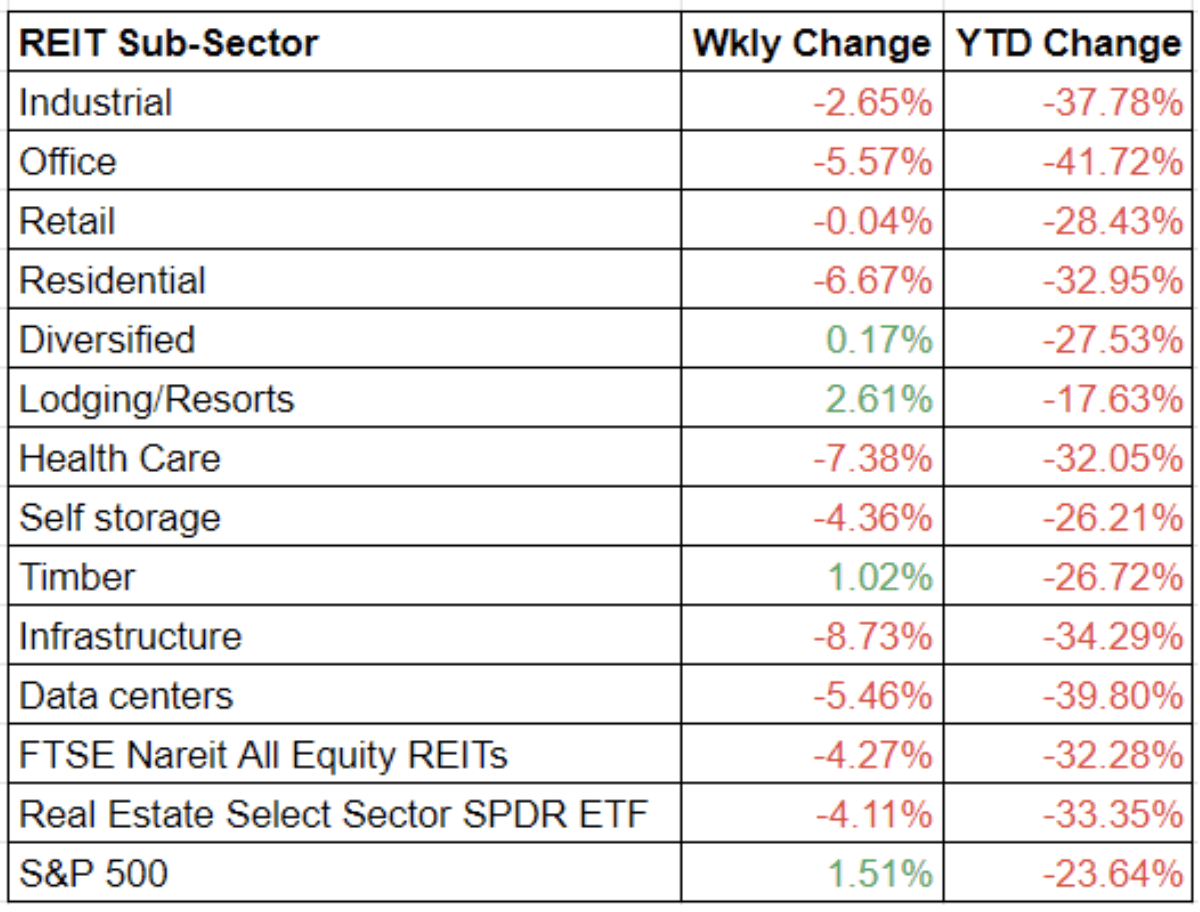
I bet many of you are confused why REITs haven’t performed well this year, especially since inflation’s been at record levels.
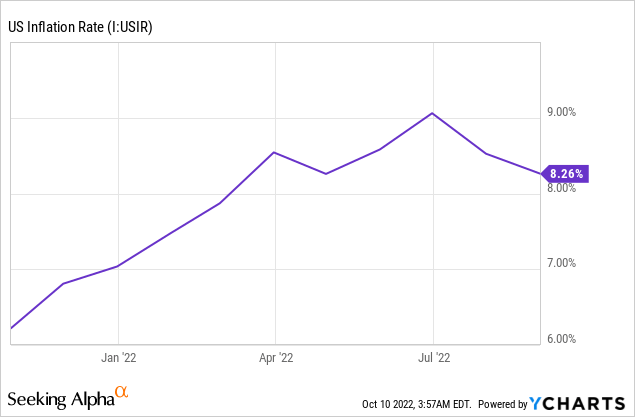
Well, the answer to this relates to macroeconomic features. Investors tend to believe inflation is uniform; therefore, they make the mistake of investing in REITs whenever inflation is above historical averages. However, the nature of inflation needs to be assessed.
The current inflationary level is due to a range of non-organic reasons likely caused by supply-side issues such as pandemic lockdowns, the Russia-Ukraine war, and civil unrest in various emerging markets. Furthermore, goods and services demand rose sharply during the latter stages of 2020 and for the entire of 2021 due to stimulus checks and expansionary monetary policy. As such, accruals built up in the economy, and the fault lines are starting to show as inflation has exacerbated and policymakers have shifted towards contractionary policies.
Real Estate is a cyclical business, and the variables mentioned above are the likely culprits for 2022’s REIT crash. That’s why I believe much of CTO Realty’s poor year-to-date performance is due to systemic reasons.
Operational Review
CTO Realty Growth’s operational analysis needs to be dissected as it owns its own operations as well as 15% of Alpine Income Property Trust’s (PINE) operations.
Let’s start off by examining CTO’s Realty’s core operations.
The company has two segments. The first is its property income segment, which accounts for approximately 84% of its operating revenue. And the second is its commercial property loan and investments division, generating roughly 16% of the REIT’s core revenue.
CTO Realty Growth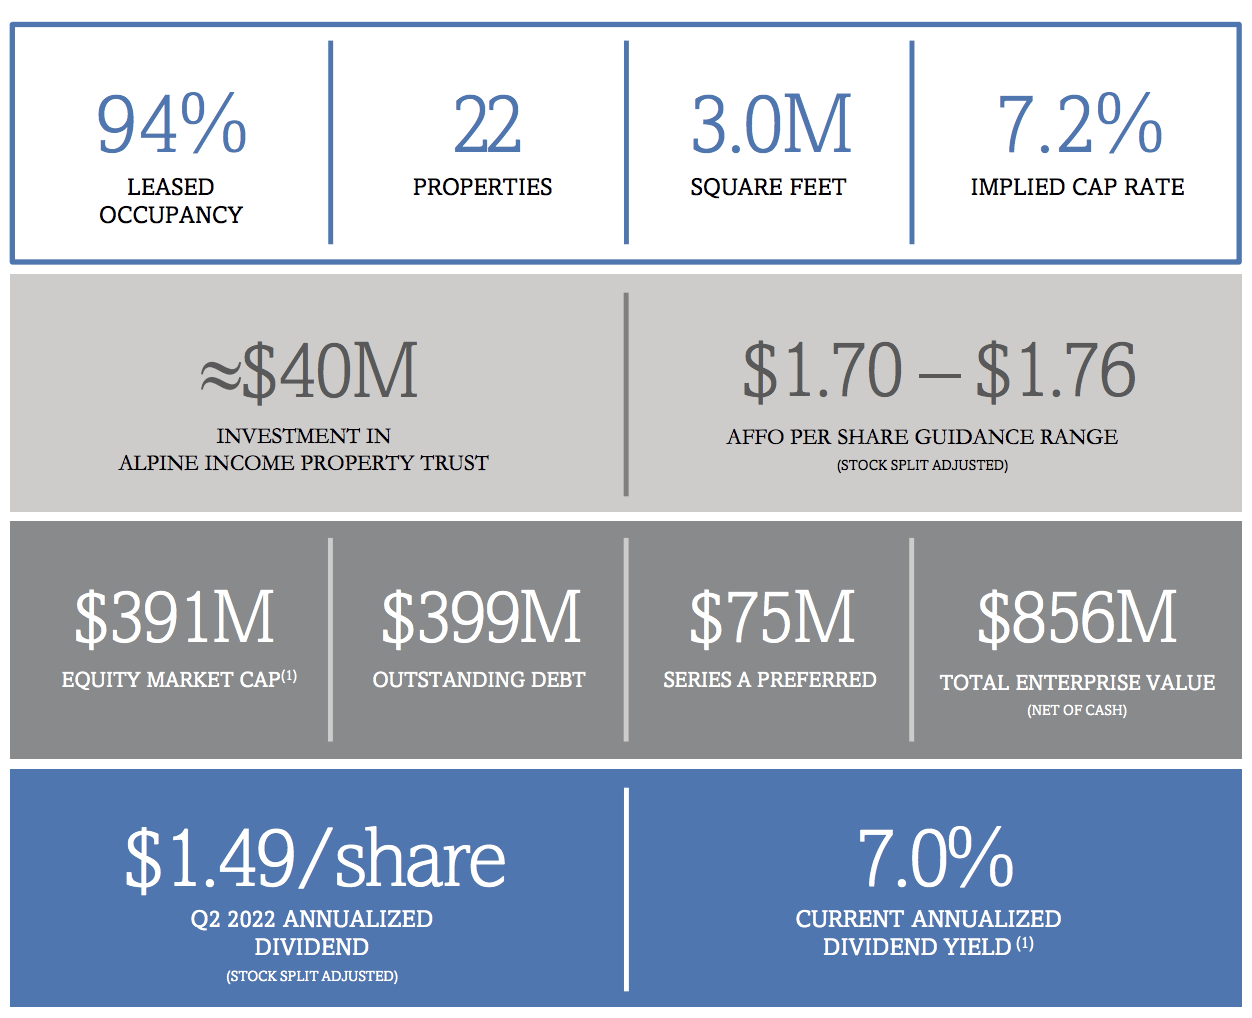
The trust’s property income section exhibits sound leased occupancy from its 22 properties. The REIT owns and operates most of its properties on a net lease basis; however, based on the fund’s leasing summary, it covers certain maintenance and ancillary costs for its tenants, leaving it susceptible to inflation.
CTO Realty Growth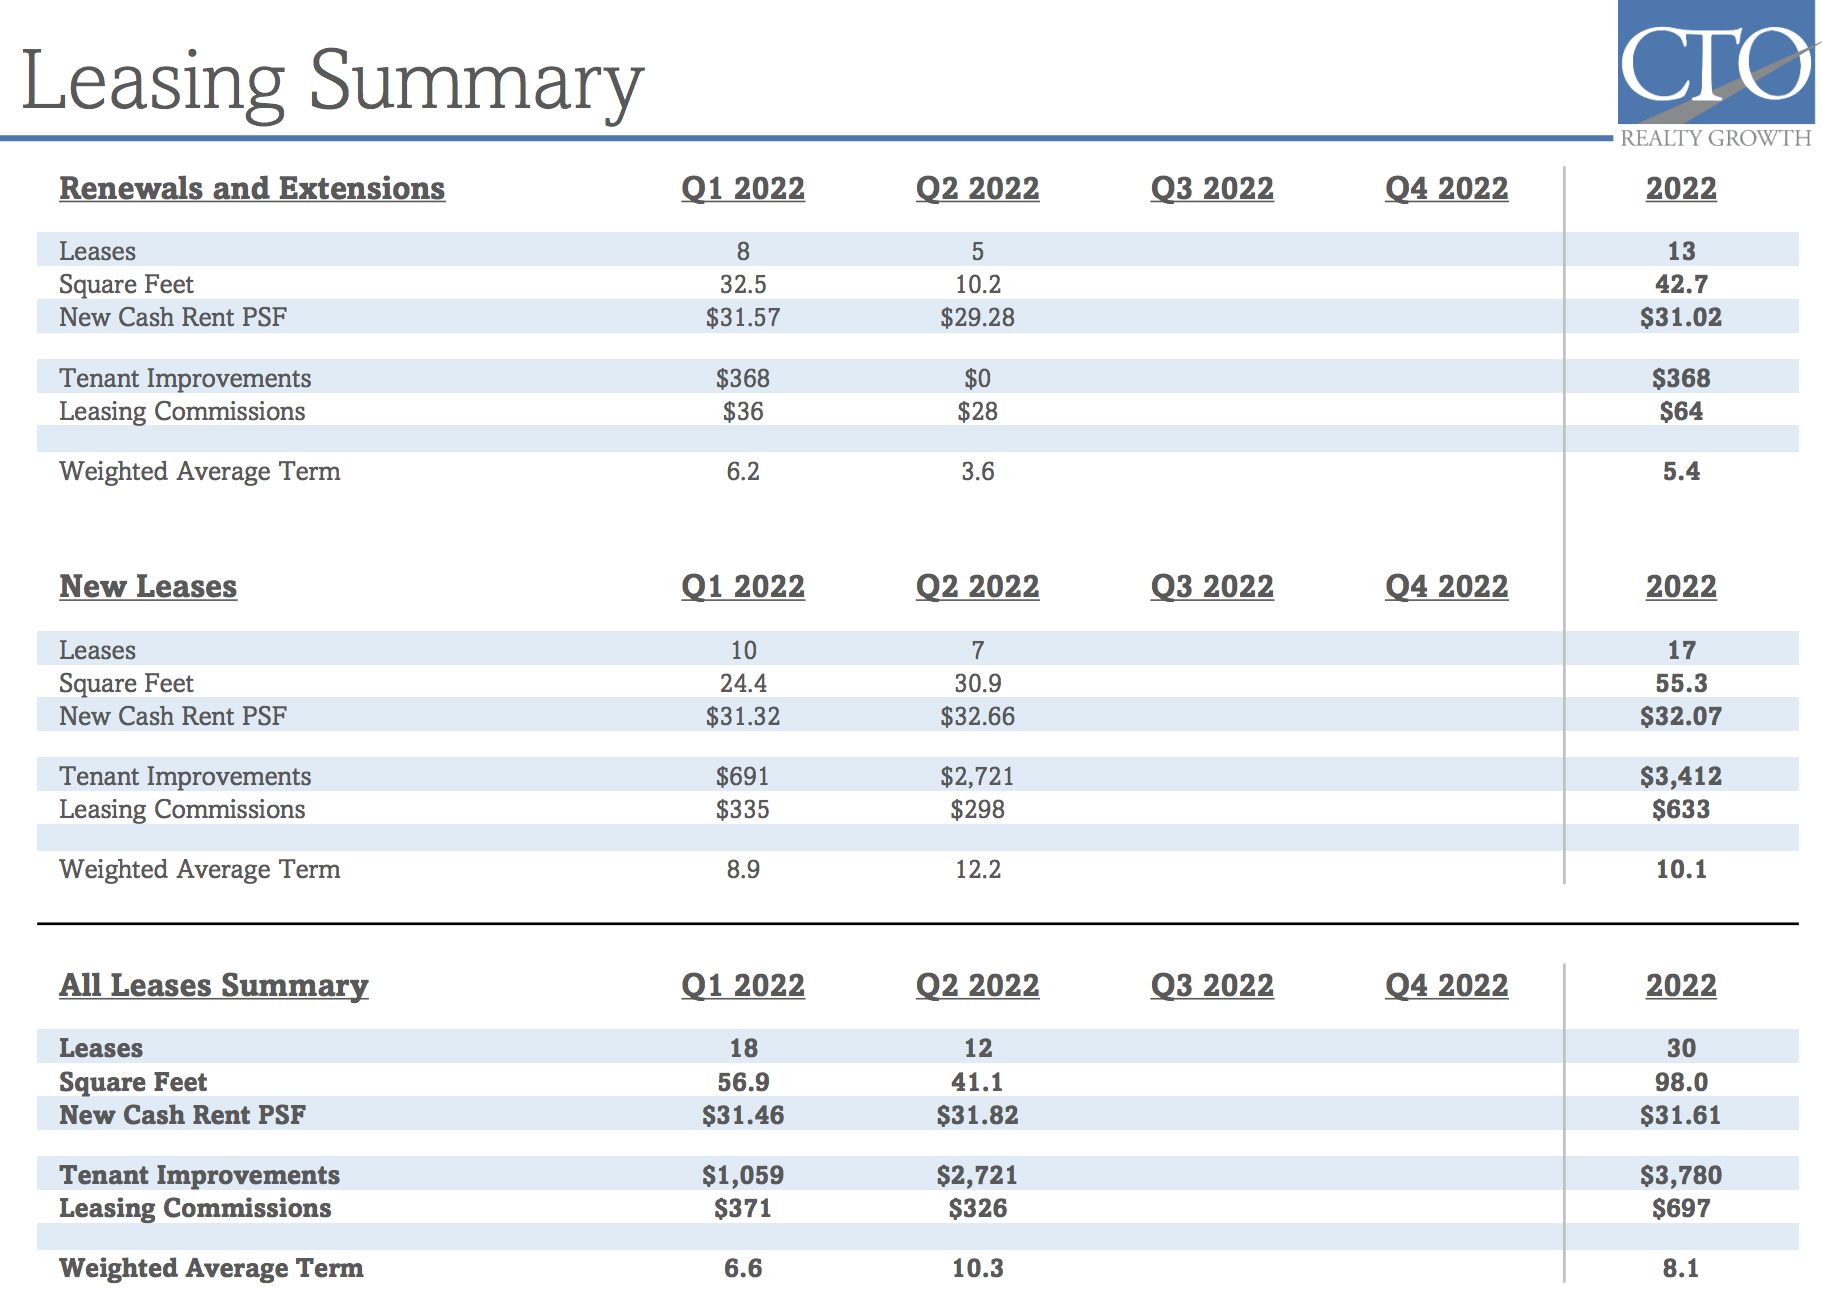
Furthermore, the fund’s retail vested strategy produces a broad-based cap rate of 7.2%, meaning its return on market value is slightly above the current total U.S. average of 6.14%.
Statista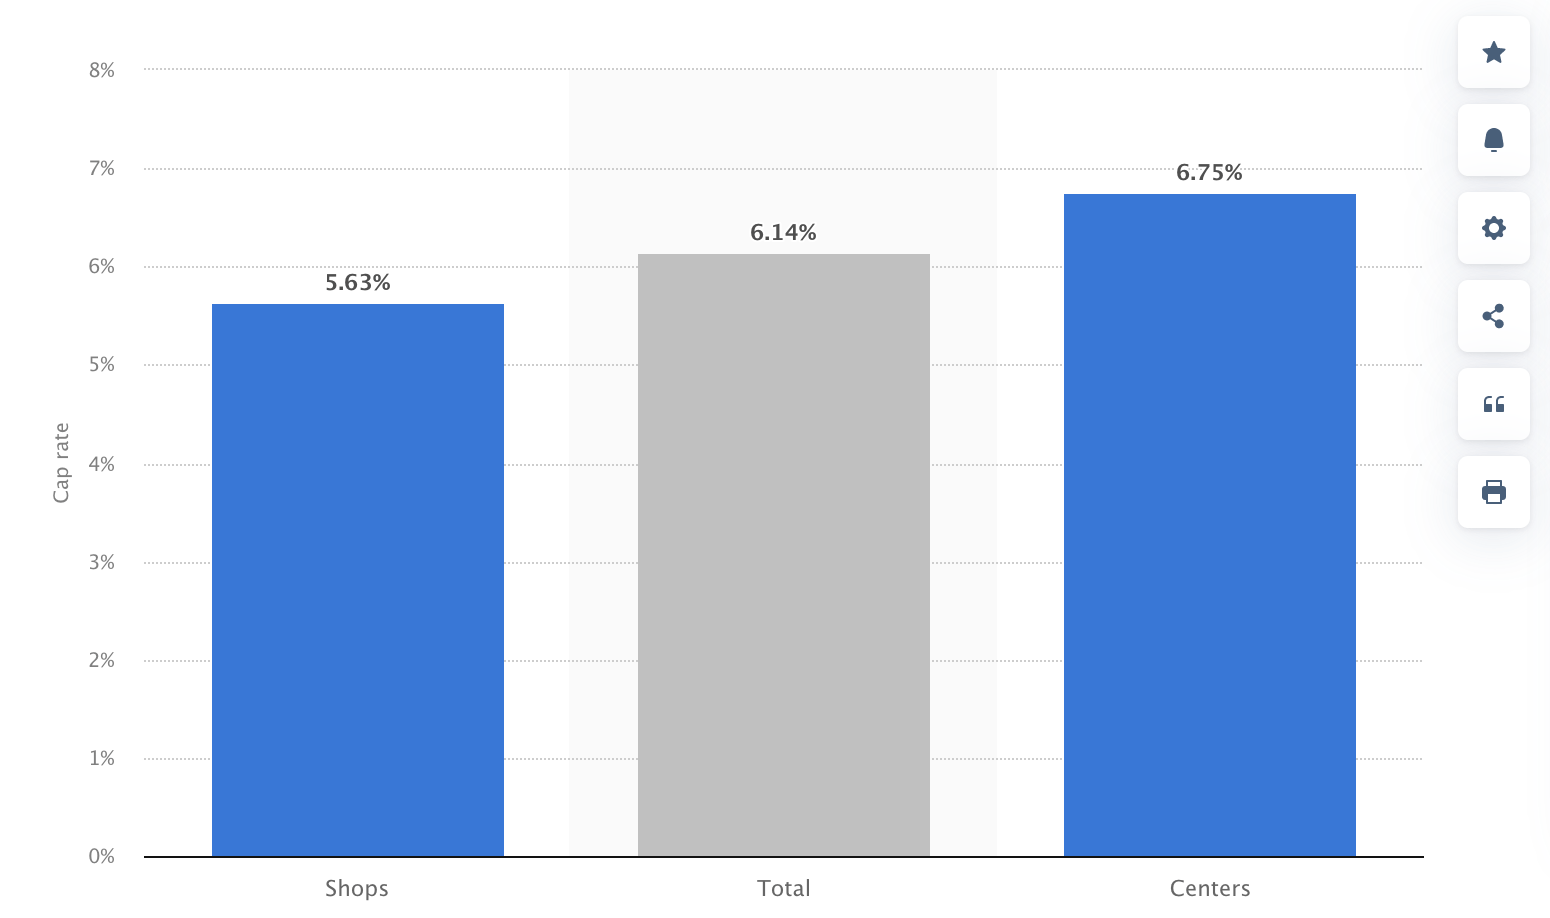
Is CTO Realty’s cap rate sustainable?
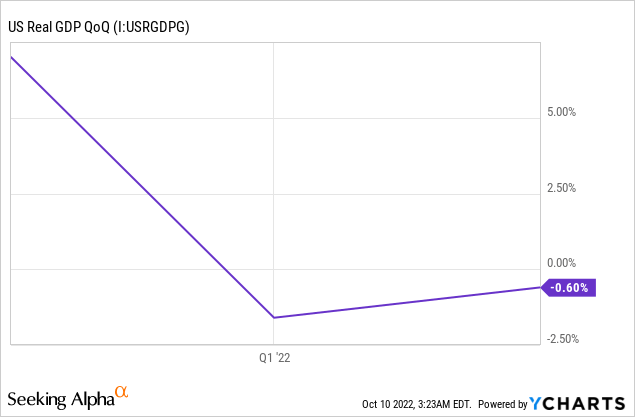
I’d say it’s in the balance. The REIT sports a growing lease rollover schedule; however, it’s heavily exposed to consumer discretionary goods, which is a sector that tends to exhibit economic sensitivity. Considering the U.S. is in a period of negative GDP growth, I see the REIT’s cyclical industry exposure as a moderate risk.
CTO Realty Growth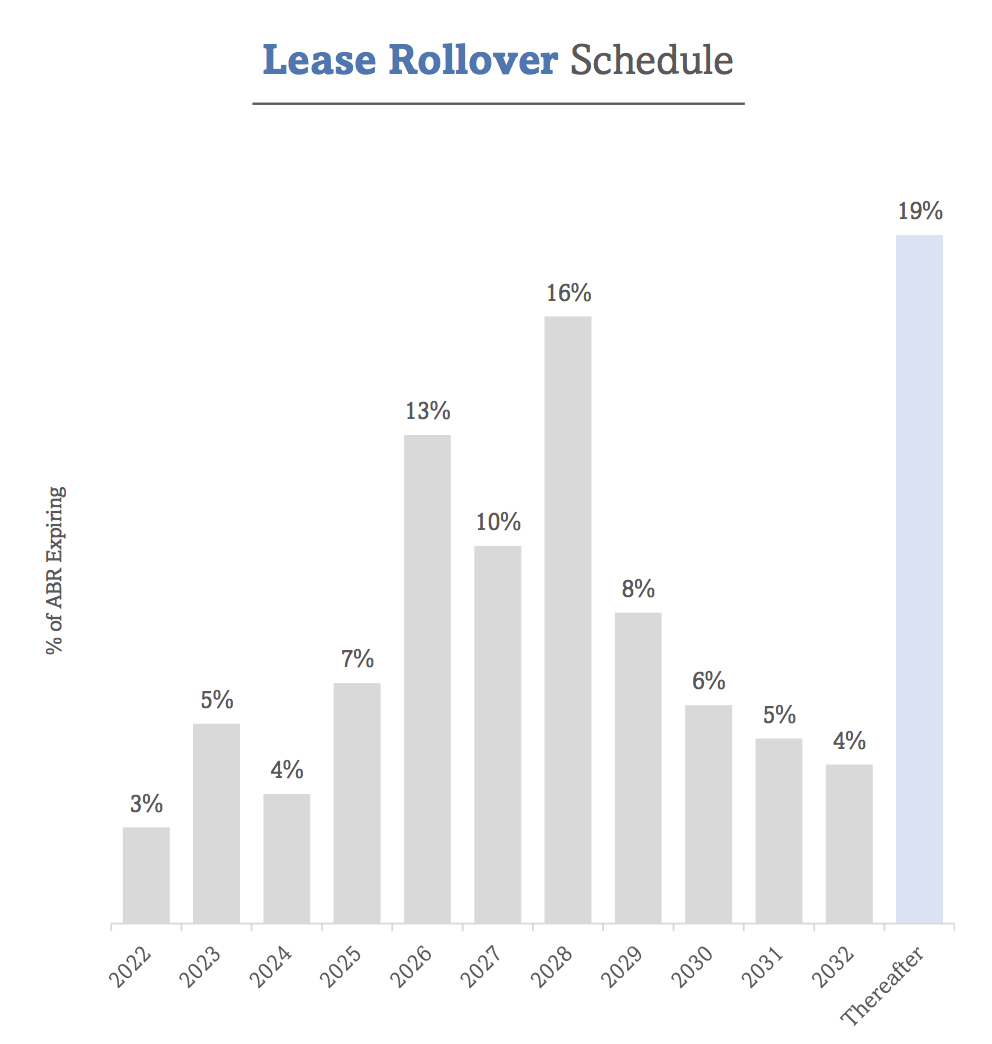
CTO Realty’s commercial investment and lending business could benefit from the current rising interest rates as loan origination is an appealing business to be in whenever interest rates are on the up. This is because they’re able to charge higher interest rates on loans and ramp up the spreads on credit due to excess volatility in the debt markets. However, this could be offset by a slowing economy as increasing credit risk in the lending space and CTO’s investment exposure in a bear market will likely be dented.
CTO Realty Growth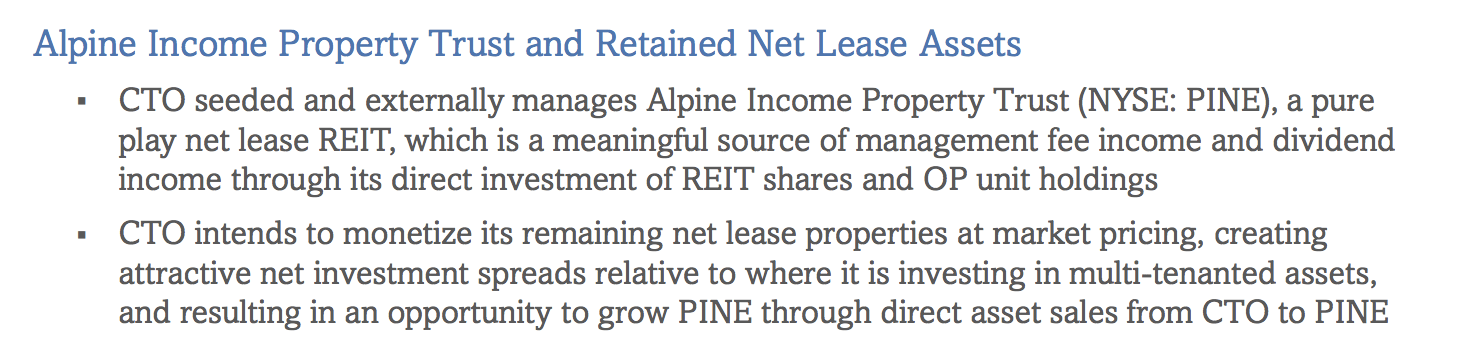
CTO Realty’s Alpine stake could be a smart move as it’s an integrated relationship, allowing CTO Realty to yield significant operational influence. In addition, the investment is structured so that CTO Realty will receive management fees and dividend income. Therefore, the company generates lucrative active income and limits its balance sheet exposure.
| Alpine Stats | |
| 3-year CAGR | 48.53% |
| Dividend Yield (fwd) | 6.97% |
| FAD Payout Ratio | 59.60% |
Source: Seeking Alpha
Alpine looks in good shape at a 3-year compound annual growth rate of 48.53%. Moreover, its dividends are highly lucrative and covered by an abundance of funds available for distribution.
Valuation
The price-to-funds from operations ratio is probably the most broadly used relative valuation ratio in the REIT space. According to the ratio, CTO Realty is undervalued by 29.64% relative to the broader sector.
The price-to-adjusted funds from operations metric provides a more economic explanation of REIT returns as it backs out additional non-cash costs. According to the ratio, the REIT’s undervalued by 35.91% relative to the sector.
| Price/Funds from Operations | 6.94x |
| Price/Adjusted Funds from Operations | 6.51x |
| Total Debt/Capital | 44.31% |
Source: Seeking Alpha
Concluding Thoughts
CTO Realty Growth provides a “best-in-class” solution for those interested in REITs. The economy isn’t well-aligned for real estate to blossom. Nonetheless, the financial markets are forward-looking. As such, macroeconomic headwinds are likely priced in. This REIT’s portfolio seems robust, and its diversified income model could set it apart from its peers. Lastly, the REIT’s undervalued on a relative basis, communicating its superior sector stance.
Be the first to comment