

matdesign24/iStock via Getty Images
Introduction
Illinois Tool Works (NYSE:ITW) is one of the best dividend growth stocks on the market as I discussed in an article earlier this year. ITW isn’t a fast-growing company, yet it has mastered the art of boosting margins used to generate consistently rising shareholder returns without sacrificing the quality of its business. In this article, we’re going to discuss the company’s just-released earnings, which show tremendous resilience given the impact of inflation and weaker economic growth expectations. ITW’s outlook was strong and shares have rallied roughly 15% since my June article.
Given everything we are about to discuss, I believe that ITW continues to be a good investment on weakness for long-term investors.
So, let’s look at the details!
The Economic Cycle
Economic cycles are fascinating. The graph below displays the economic cycles of the past 20 years using forward-looking economic data from the New York and Philadelphia Fed. These indicators are extremely handy when it comes to predicting where coincident and lagging economic numbers like industrial production and GDP growth are headed. But even more important, they tell us what we can expect when dealing with stocks that depend on economic growth expectations.
That’s where ITW comes in. The chart below also shows how well ITW is following cycles. It’s even leading some cycles, but stocks are always starting to lose momentum as soon as economic expectations are in the process of peaking. After all, that’s where the risk/reward starts to quickly deteriorate. The opposite occurs when economic expectations are bottoming.
Author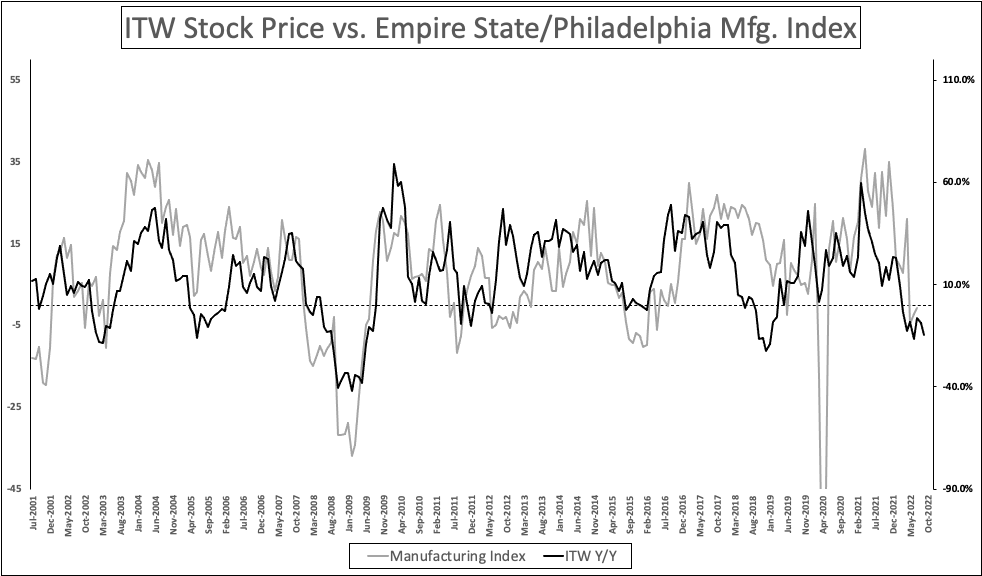
Moreover, even the most recent ISM report shows that manufacturing new orders are now below 50, indicating contraction.
Institute for Supply Management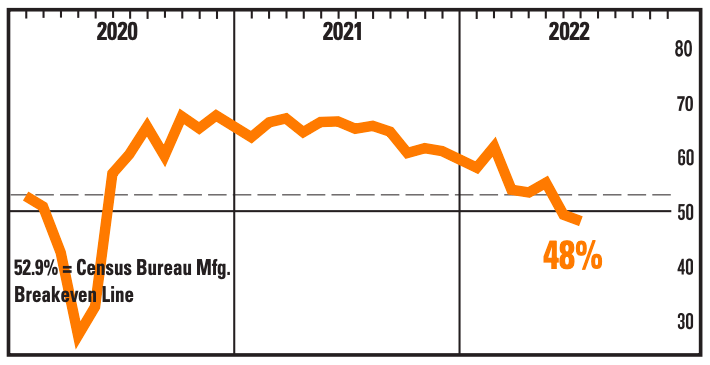
While I am writing this, the stock is down 15% from its all-time high. It used to be close to 30%, which is why I wrote a bullish article in June.
ITW’s Profitable Business
It makes a lot of sense that ITW follows economic cycles so well. With a market cap of $66 billion, this company from Glenview, Illinois, is one of the largest producers of all kinds of equipment that usually do well when companies boost investments in their business (hence the relationship with economic expectations). According to the company:
The Company’s operations are organized and managed based on similar product offerings and end markets, and are reported to senior management as the following seven segments: Automotive OEM; Food Equipment; Test & Measurement and Electronics; Welding; Polymers & Fluids; Construction Products; and Specialty Products.
With this in mind, the chart below shows ITW in a nutshell. If revenues were the main driver of shareholder returns, investors would be in trouble. In 2013, the company did $14.1 billion in revenue. This year, revenues are expected to be $15.8 billion. That’s just 1.1% average annual compounding growth. Less than inflation.
TIKR.com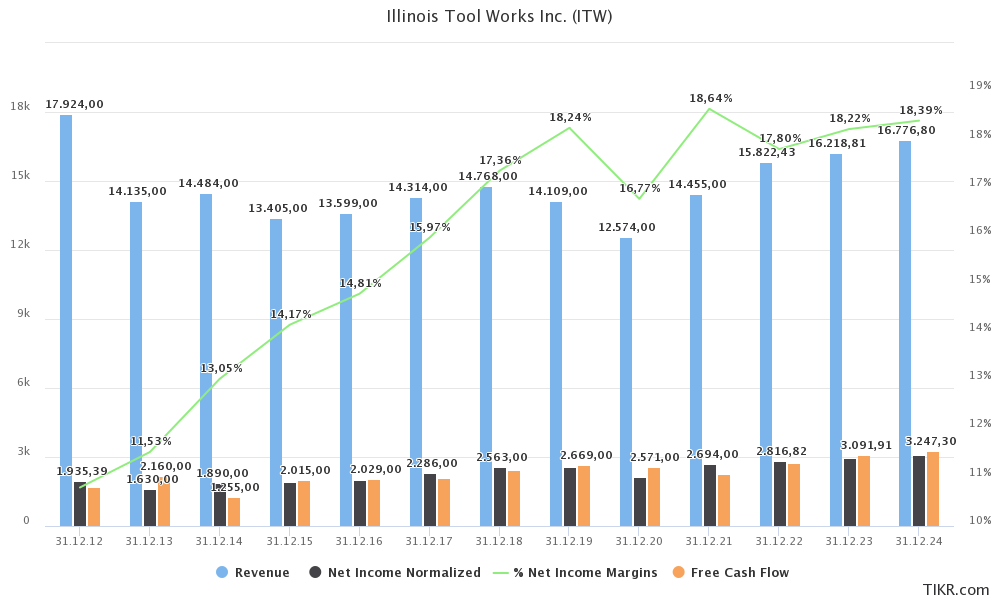
However, ITW has improved its business a lot in the past 10 years. For example, net income margins are now expected to grow above 18.0% and remain there. That’s up from less than 12% ten years ago.
Moreover, the company is consistently reporting higher free cash flow than net income, which is a great indicator of quality earnings. After all, free cash flow is net income adjusted for non-cash operating items and capital expenditures. It is cash a company can use to buy back shares, distribute a dividend, and improve its balance sheet for future purposes.
ITW is achieving this based on three elements.
First, its 80/20 front-to-back process, which is an operating system applied in every ITW business since its introduction in the 1980s. This system has consistently been improved to generate more value for the corporate business and its owners, the shareholders. To quote the company:
Through the application of data driven insights generated by 80/20 practice, ITW focuses on its largest and best opportunities (the “80”) and eliminates cost, complexity and distractions associated with the less profitable opportunities (the “20”). 80/20 enables ITW businesses to consistently achieve world-class operational excellence in product availability, quality, and innovation, while generating superior financial performance
Element number two is customer-back innovation. This is based on the 80/20 approach and it uses insights gained from that to work closely with its 80% best customers together. This helps innovation purposes as it involves customer insights and margin enhancement, and it creates customer loyalty.
Element number three is the decentralized, entrepreneurial culture at ITW. This basically means that the company helps all of its businesses to achieve their goals and become more profitable and flexible. However, the company is providing all companies it owns with the ability to remain flexible. This keeps the organizational structure simple and supports innovation and efficiencies.
In its just-released 2Q22 earnings, the company reported stellar results. Revenue rose by 9%, while organic revenue growth was 10%. Operating margins fell from 24.3% to 23.1%. Adjusted for the MTS acquisition, operating margins would have been 24.1%.
According to the company:
In the second quarter, we saw continued strong demand across our portfolio, supported by our 80/20 front-to-back driven operational capabilities.
Moreover, the company reported the smallest impact of inflation since 2Q21 and the first quarter-on-quarter decline since the start of high inflation in 2021.
Illinois Tool Works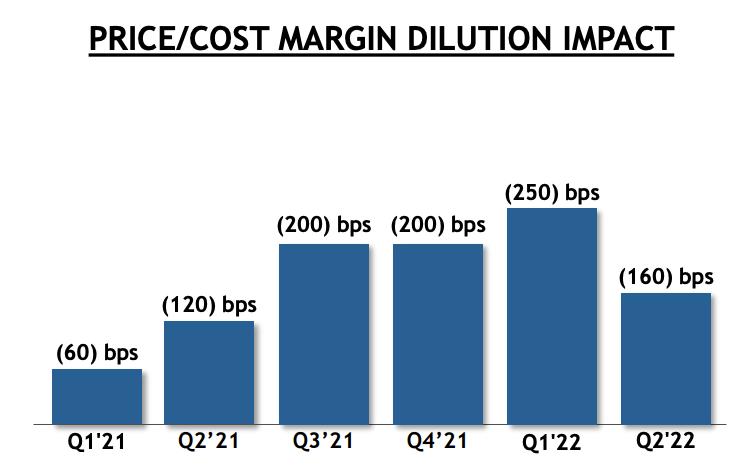
Hence, the company believes that it can continue the uptrend in margins. As it sees a margin recovery to the 24.0% to 25.0% range.
So far, the company was able to stay on top of inflation as it adapted pricing to higher input costs – “dollar-per-dollar”.
Moreover, the company is maintaining its full-year GAAP EPS guidance of $9.00 to $9.49, which includes a one-time favorable tax benefit of $0.16 in Q2, which was offset by headwinds caused by unfavorable currency developments.
Bear in mind that ITW generates roughly half of its sales outside of the United States. This means a strong dollar becomes a headwind.
The dollar index is currently at 106, which is up more than 6% since April. This impacted sales by 4%, which is a huge deal. For most companies, it is impossible to hedge these risks as sales aren’t always predictable cash flow. When it comes to big-ticket contracts, hedging may be possible, but hedging quarterly sales is hard and a lot of treasuries refrain from doing so – at least from my experience.
TradingView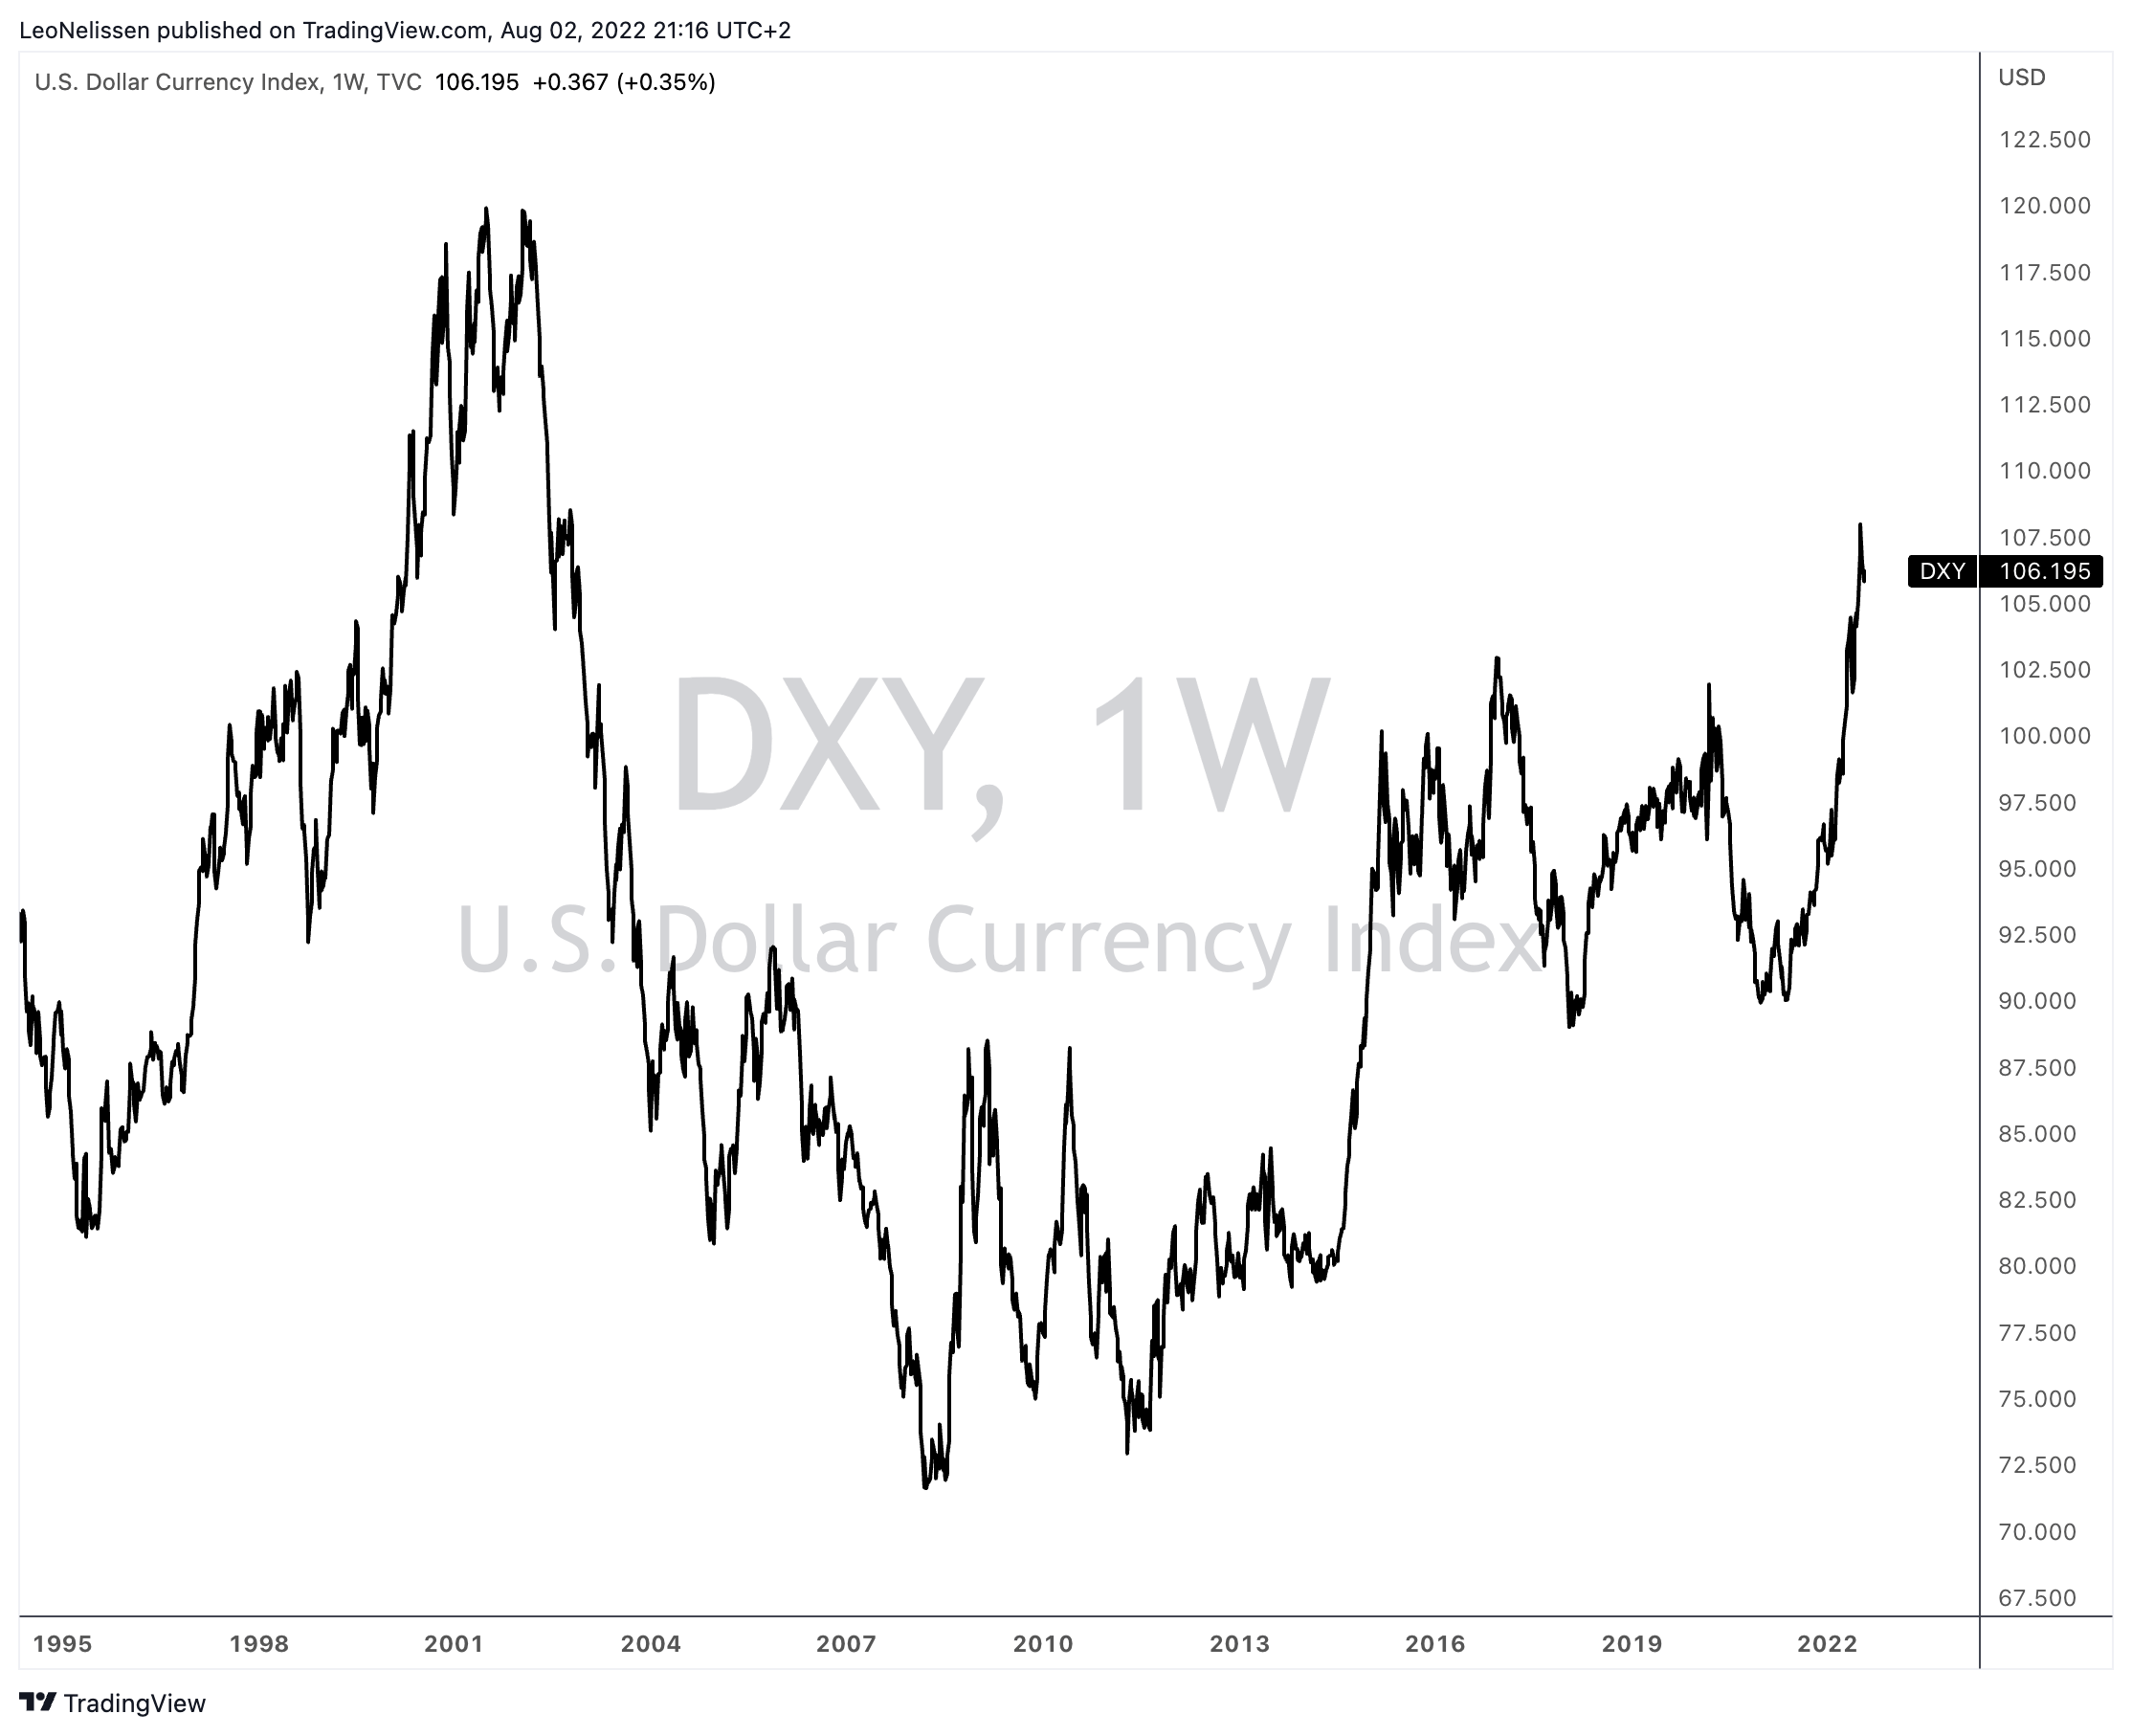
Now, with that said, ITW is weakening a bit. The market is losing momentum as investors are taking some profits after an impressive performance in July.
StockCharts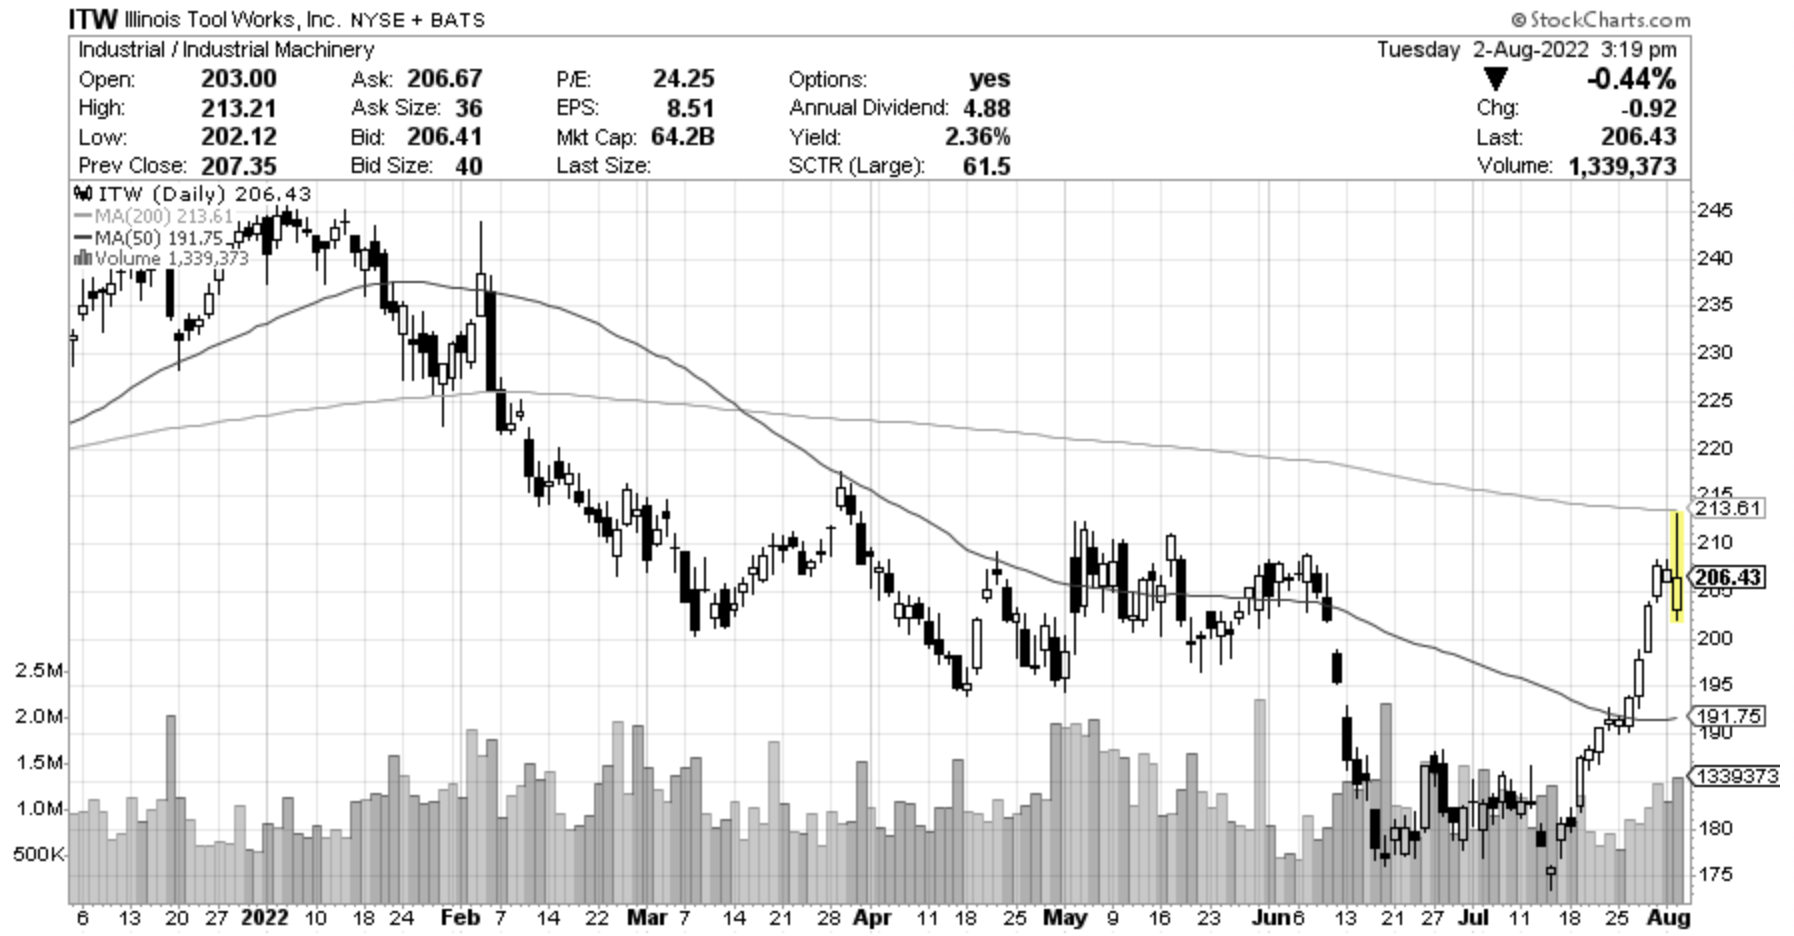
I’m perfectly fine with that, even though I expect my long-only dividend (growth) portfolio to suffer a bit.
Why? Because it makes sense that traders/investors take some money off the table given the macro environment. Moreover, nothing beats buying high-quality dividends at better prices.
The ITW Dividend & Outperformance
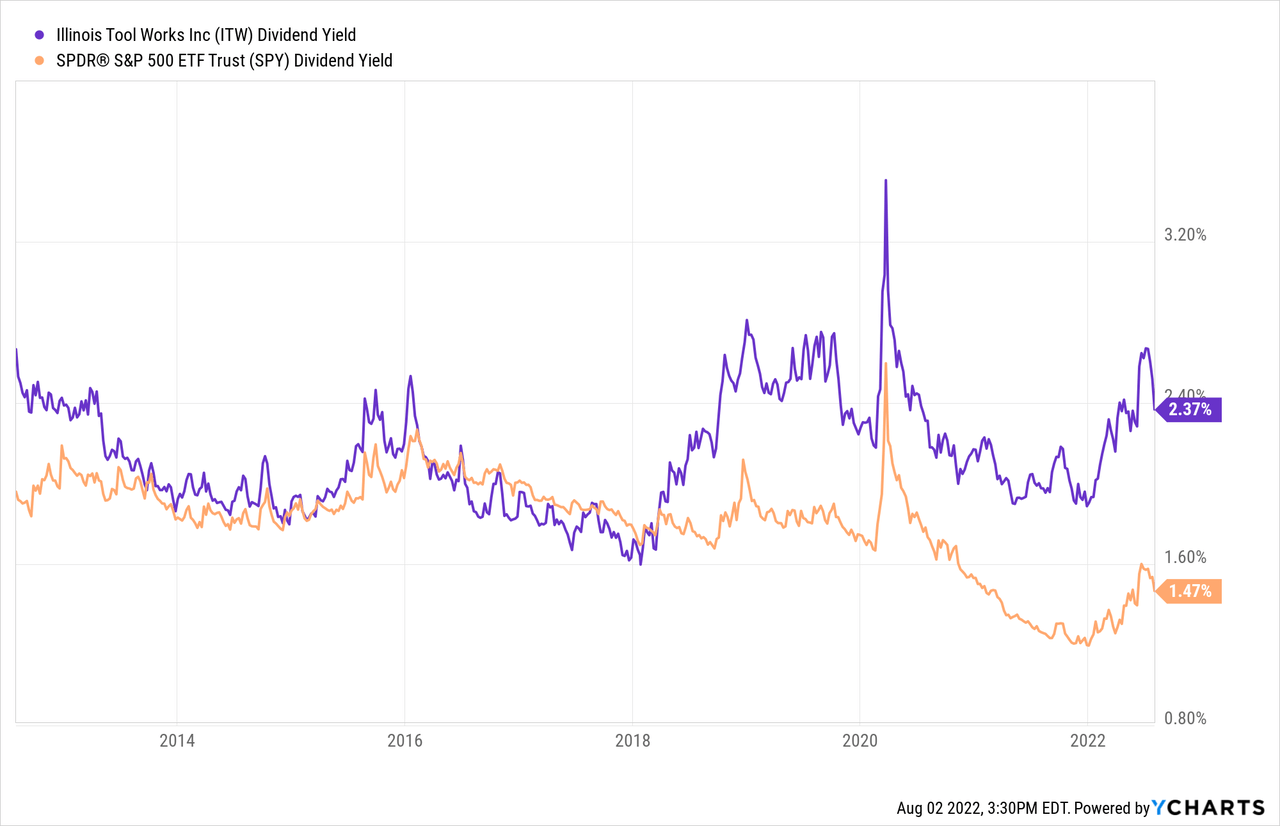
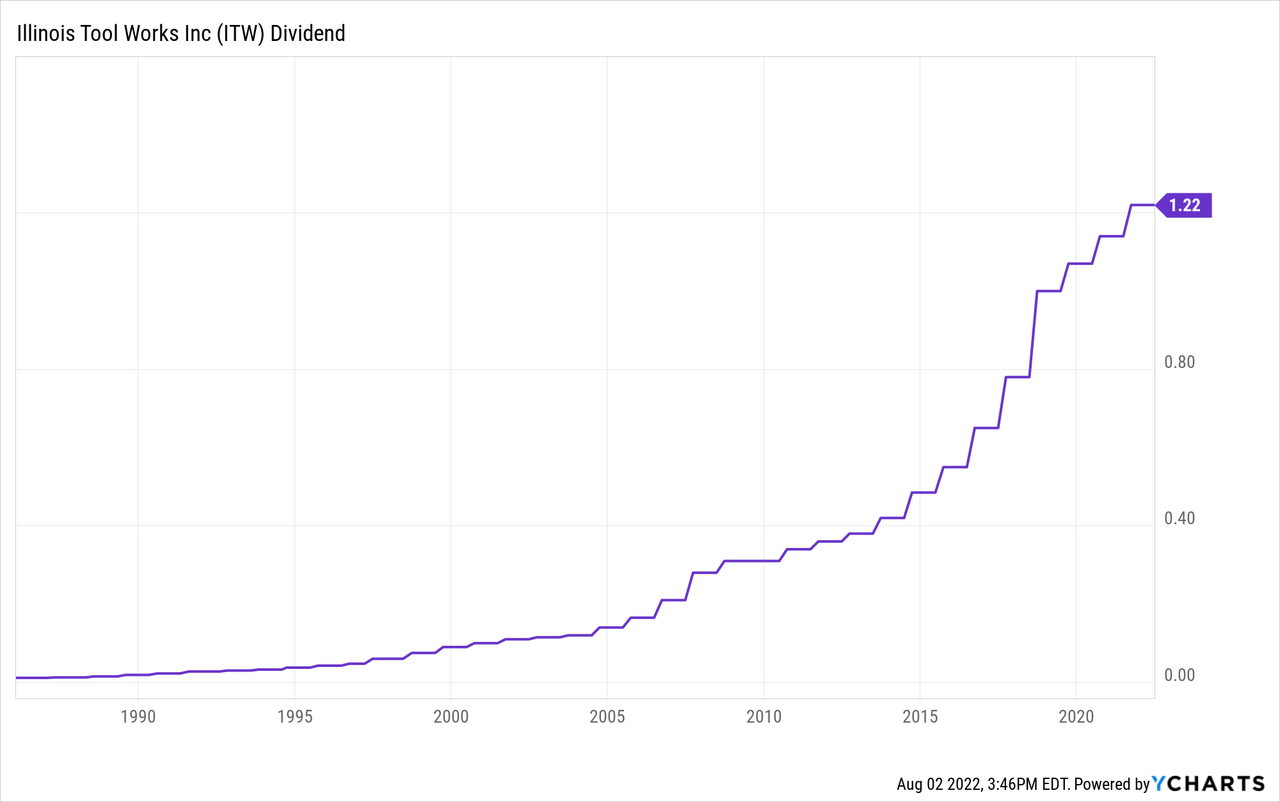
ITW is paying a $1.22 dividend per quarter per share. That’s $4.88 per year and translates to a dividend yield of 2.4%.
This yield is 90 basis points above the S&P 500 yield. Prior to 2018, ITW and the market had the same yield. That changed in 2018 due to weaker economic growth (underperforming ITW shares), and the post-pandemic surge in stocks that was mainly fueled by tech stocks. As the S&P 500 is tech-heavy, ITW’s yield started to improve versus the S&P 500 yield.
Not only that, but ITW is scoring relatively high when compared to its industrial sector peers. The company scores a B on its yield, an A on safety, and A+ in the dividend growth and consistency categories.
Seeking Alpha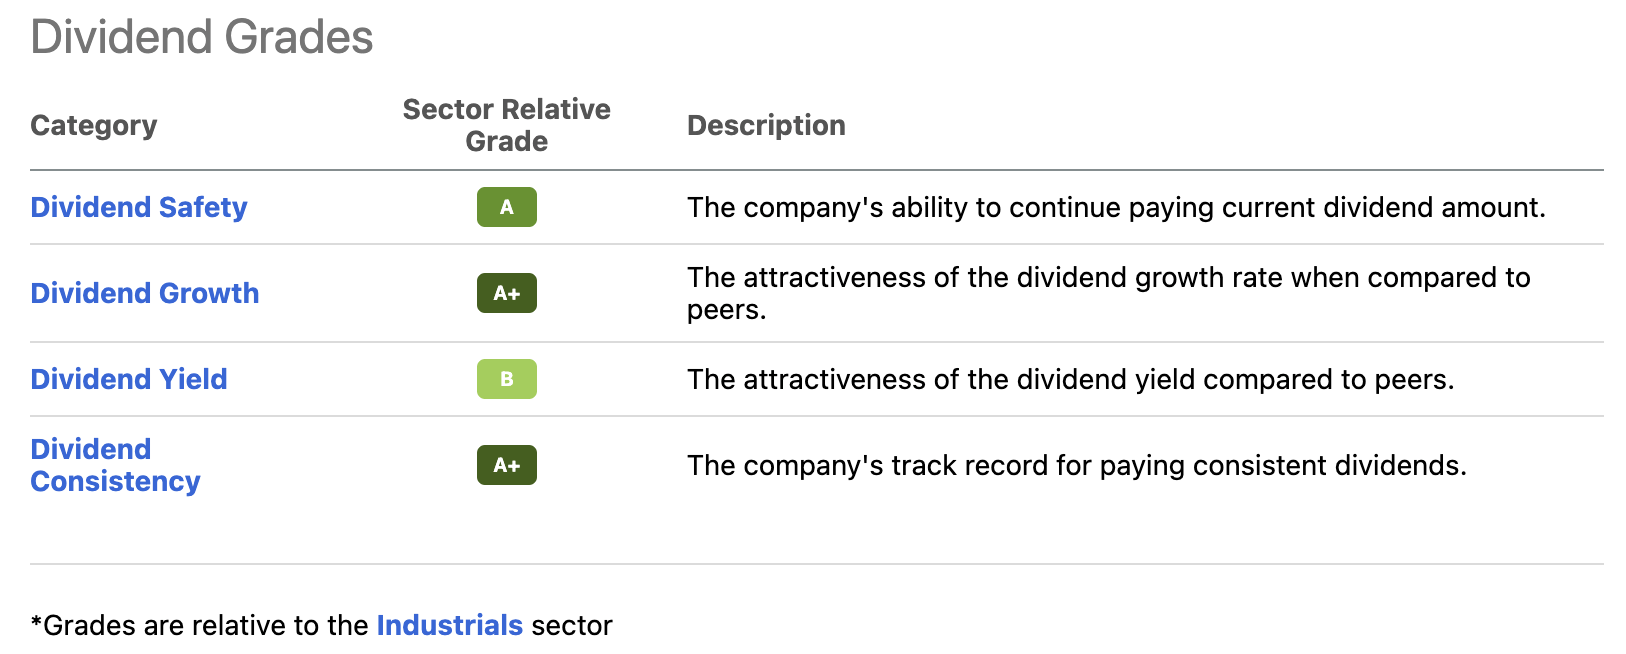
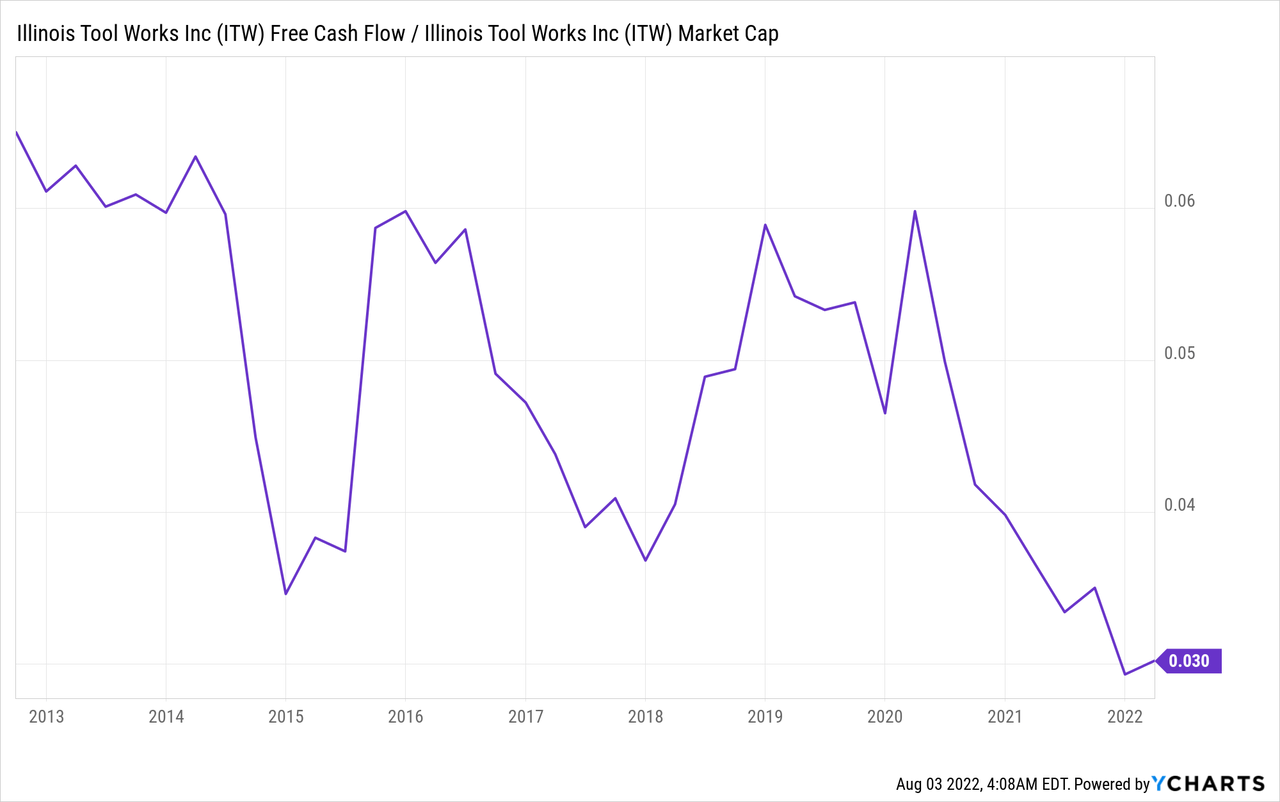
This has everything to do with its free cash flow. As I mentioned earlier, while revenue growth is more or less flat-ish, higher margins have propelled free cash flow. In the 2012-2024E period, free cash flow is growing by 5.2% per year.
Moreover, free cash flow is expected to come in at $2.8 billion this year. This implies a 4.2% free cash flow yield using the aforementioned $66 billion market cap. Next year that number is set to reach 4.5%, which means not only is the 2.4% dividend safe but there’s also room for improvement.
This brings me to dividend growth.
The company has raised its dividend by 13.0% per year over the past 10 years – on average, of course. The 3-year average is lower at 6.9%.
These are the most “recent” hikes:
- August 2021: 7.0%
- August 2020: 6.5%
- September 2019: 7.0%
The good thing is that these numbers also translate to outperformance on the stock market. Since 1988, ITW has returned 14.0% per year, which beats the S&P 500 by 330 basis points per year. The company did this without exposing its investors to exorbitant volatility (standard deviation), which means that the stock is also keeping up nicely on a volatility-adjusted basis (Sharpe, Sortino ratio).
Portfolio Visualizer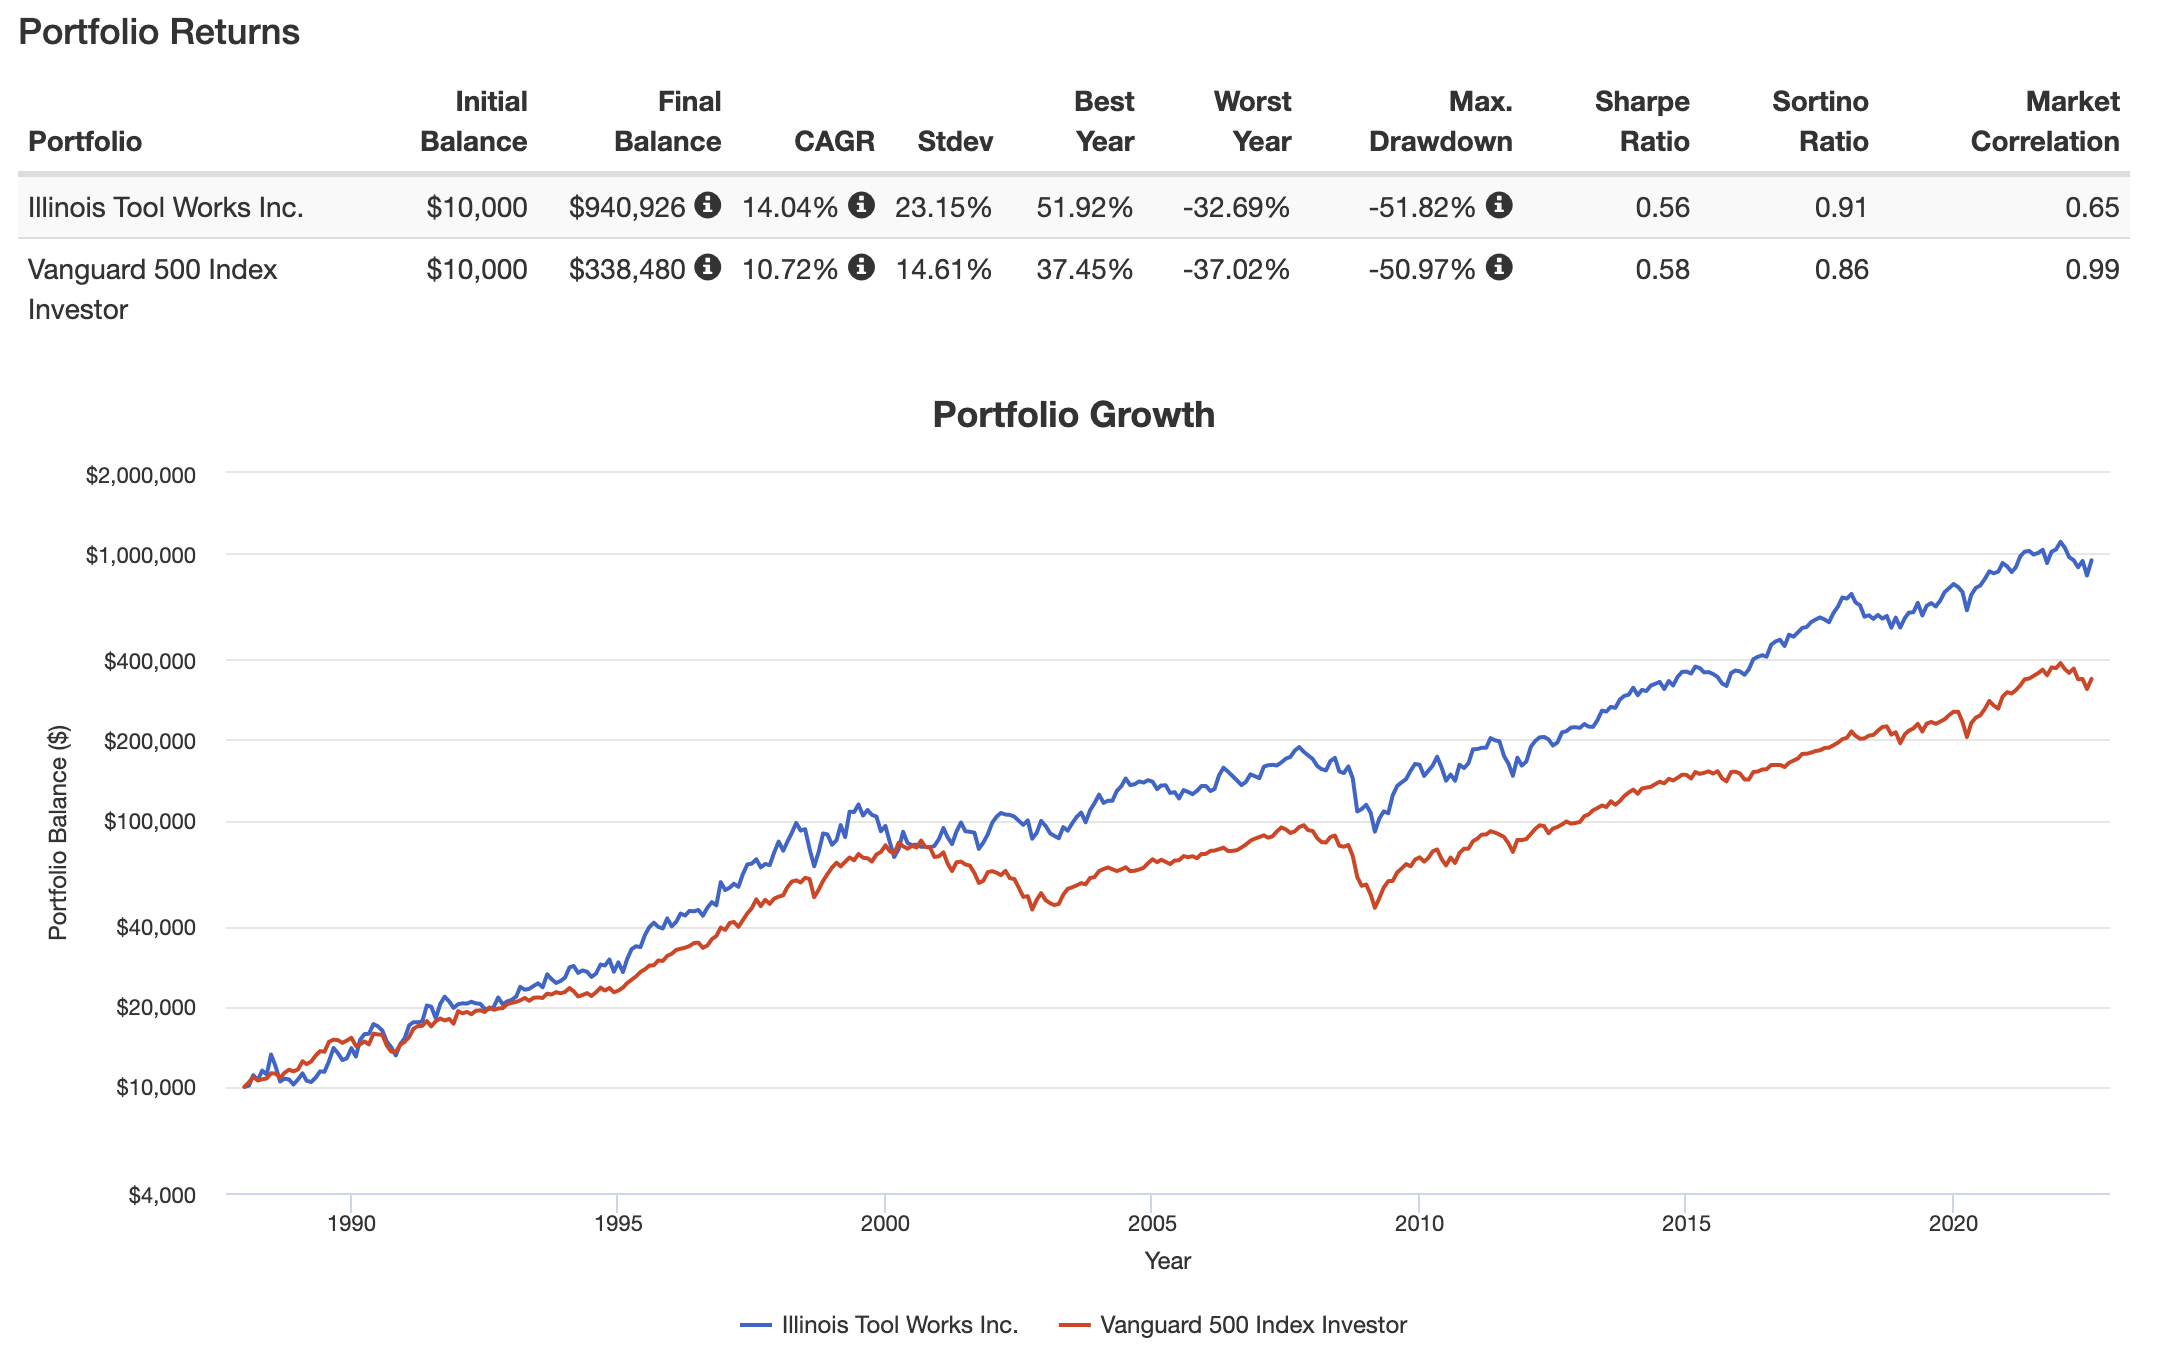
Despite slowing sales growth, the performance hasn’t weakened a lot. On a 5-year average, the stock has returned 10.7%. This is below the S&P 500’s 12.7%, but that’s mainly because we had more years of growth slowing since 2017 than years with strong economic growth. On a 3-year basis, both ITW and the S&P 500 have returned 13.1% per year.
In this case, it helps that the company has bought back 8.4% of its shares outstanding between 2017 and 2021, which enhances the value per share and it’s a way to distribute additional cash.
ITW Stock Valuation
In this article, I already discussed a part of the company’s valuation. Using free cash flow expectations, we’re dealing with an implied 4.5% 2023 FCF yield. Normally people use price/free cash flow. I like to do it the other way around as it gives people a number they (tend to) understand a bit better. It also makes more sense as it shows how “powerful” free cash flow is compared to the market cap.
I believe the implied FCF yield is good, but it’s the minimum I would accept at this price. It’s roughly the 10-year median, which isn’t that much given that I’m using 2023 numbers and because we’re in a manufacturing sell-off.
Free cash flow is so important because investors have shifted their focus to cash because growth is low in other areas.
Using the $66 billion market cap, $6.0 billion in expected 2023 net debt (just 1.3x EBITDA), and $380 million in pension-related liabilities give the company an enterprise value of $72.4 billion. That’s 16.1x expected 2023 EBITDA of $4.5 billion.
This means the valuation is back to pre-pandemic levels, which isn’t cheap, but it also isn’t overvalued.
TIKR.com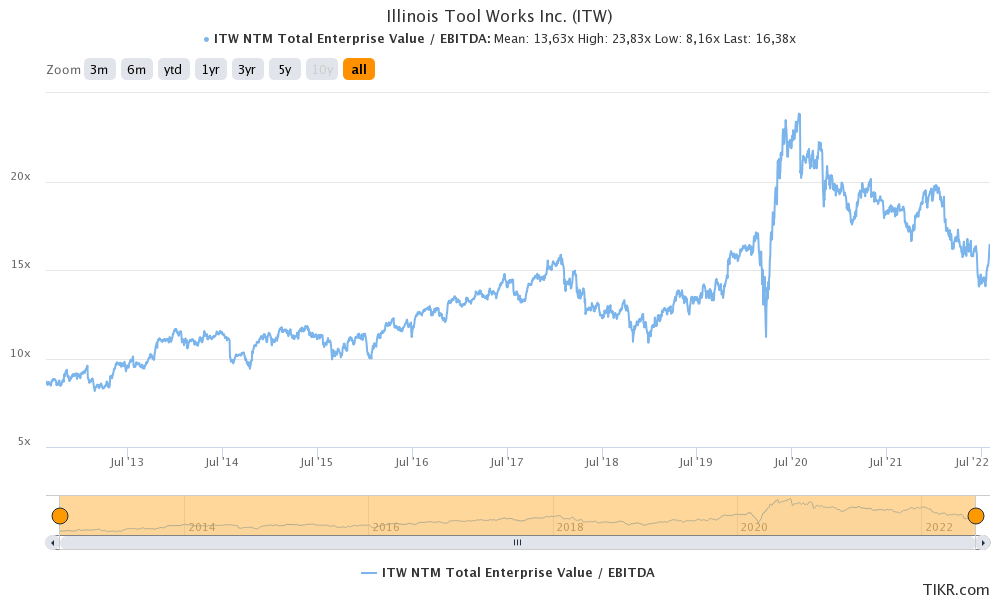
With all of this in mind, if I didn’t have more than 40% industrial exposure already, I would be looking to buy ITW below $195, preferably $190.
That would improve the risk/reward and give investors a slightly higher yield, which I believe would make sense given slow long-term growth.
Takeaway
Illinois Tool Works is a fascinating stock. It doesn’t have high long-term revenue growth, yet it does have very high long-term shareholder returns, a decent dividend yield of 2.4%, buybacks, and a healthy balance sheet. This is caused by the company’s focus on margins and its ability to generate tremendous value in its many subsidiaries. The company generates high free cash flow and is able to maintain long-term dividend growth of 7%.
The biggest problem right now is that ITW had a very good month in July. That’s not bad for existing shareholders, but it is an issue for investors who are looking to buy ITW shares. After all, economic growth isn’t out of the woods yet. The ITW valuation is now in what I like to call no-man’s land. It’s not overvalued at all, but it also doesn’t reflect the risk/reward I would like at this point of the economic cycle – despite that a lot of weakness has already been priced in.
Hence, I would recommend people to wait for weakness, which I believe will occur in the next few weeks. Look for an entry below $190 per share if possible as that would make the risk/reward much more attractive.
(Dis)agree? Let me know in the comments!
Be the first to comment