


lisegagne/E+ via Getty Images
As of my writing this, the S&P 500 Index (SP500) is down roughly 21% for 2022 The late autumn rally seems to have run out of gas, and liquidity continues to drain out of the market. As the Federal Reserve’s campaign to bring down runaway inflation continues, will stocks fall to new lows in the new year? I’d argue yes. In this article, we’ll take a look at what’s driving the drop in stocks and into the earnings outlook for the market to see what the S&P 500 is likely to do in 2023.
Why Are Stocks Going Down?
If you’re reading this, you might be wondering whether the odds favor buying the dip on stocks, or whether you should take some shelter in Treasury bills yielding nearly 5%. The short answer is that I think holding some cash looks good. We’ll get into the long answer in the next section, but first, we need to understand how we got here.
Lured by the siren song of modern monetary theory, global policymakers borrowed way too much money during COVID, and now the reality is that it wasn’t a free lunch. Inflation has surged, and the US government is at its most indebted level since WW2. America is nowhere near the only country in this position, but over the last 20 years, we’ve gone from having a near-perfect fiscal position to a terrifyingly unsustainable one. As we face a steadily aging and unhealthy population expecting Medicare and Social Security payments, there simply isn’t enough economic activity to satisfy all the future claims on it 10+ years down the road. We’ll likely either need big tax hikes to balance the budget going forward, or we will need to cut entitlement spending.
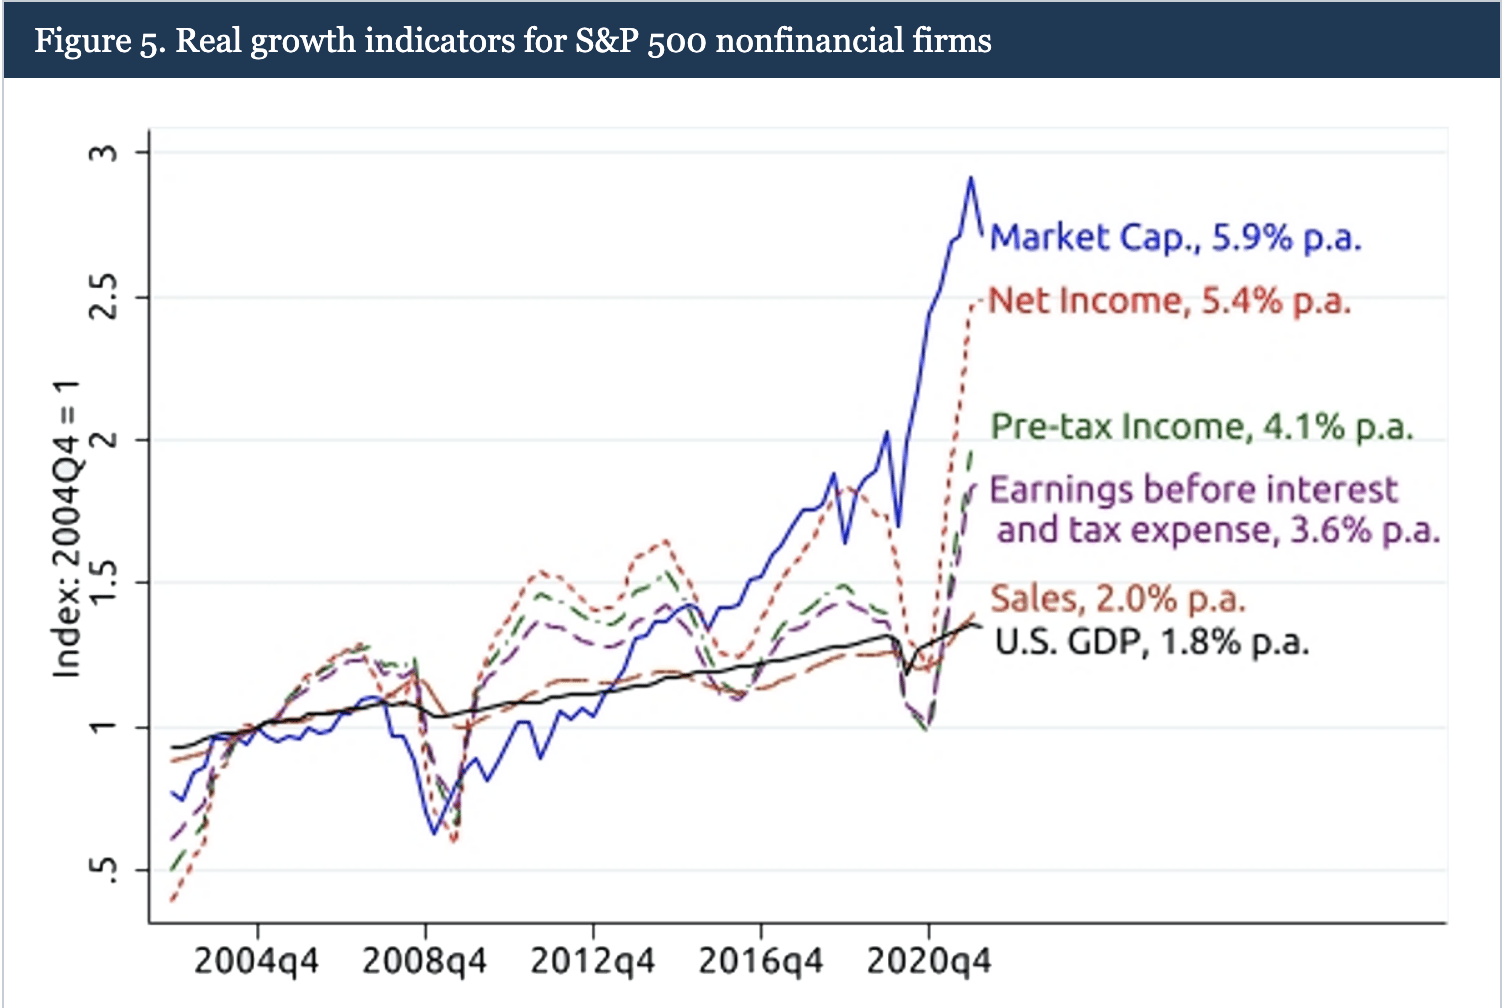
To this point, record-high corporate profits have been juiced by repeated tax cuts since the turn of the century and zero-interest-rate Fed policy since 2008. This fragile high-wire act worked for a long time, but runaway inflation in 2021 finally broke the dam for the Fed, the ECB, and now for the Bank of Japan. At home, stock valuations had risen faster than net profits, which rose faster than pretax income, which in turn rose faster than EBIT. A substantial portion of Corporate America’s success over the last 20 years was not of its own doing, but straight from tax cuts and falling interest rates. If these drivers are done and going into reverse, then that’s a huge problem for stocks.
The Market Is Ahead of Itself (The Federal Reserve)
Repeated fiscal stimulus and the zero interest-rate policy helped create the so-called “everything bubble” that peaked in 2021.
- Long-term bonds were yielding 1%.
- Equities made all-time highs nearly every month, returning 20%+ three years in a row.
- A runaway debt-fueled housing market saw national home prices rise ~35% in two years, and much more in hot markets.
- Nearly 20,000 new cryptocurrencies were created, and most of them were completely and utterly pointless.
The unwinding of the late 2010s/2020s “everything bubble” is still ongoing, but it’s quite possible that it will go down in history among the greatest stock market bubbles of all time, along with the late 1990s and the late 1920s.
These structural issues with the U.S. economy are widely known by economists, but widely ignored by investors. Over time, I believe the debt and demographic issues are manageable with sound fiscal and monetary policy (and some tough political compromises). However, this means that stocks are still somewhat mispriced compared with a long-term fair value that accounts for what rising tax rates and higher interest rates are going to do to the S&P 500 (SPY) earnings and the future growth thereof. As the bubble unwinds, the market is slowly getting to fair value now. Looking at the stock market now vs. one year ago, I see far fewer “WTF” valuations on individual stocks. Many former pandemic darlings are now down anywhere from 50% to 90%. The craziness in SPACs and crypto has mostly disappeared, sometimes with criminal charges for the founders accompanying.
But I don’t think we’re out of the woods yet. Bond yields are still on the low side of normal compared with expected inflation, and equity valuations are still on the high side of normal. Housing prices are falling 1-2% per month in most US metros from insane highs as that bubble deflates.
S&P 500 2023 Earnings and Valuation Forecast
2021 was the best year ever for corporate profits at $209 per S&P 500 index share. Against all odds, 2022 looks set to match it or beat it by a few dollars as consumers spend what’s left of their excess pandemic savings. After that though, we’ve got problems. Morgan Stanley analyst Michael Wilson has called for $195 in earnings for 2023. Wall Street’s current consensus figure for 2023 earnings is about $230, which I view as laughably unrealistic. You also can see here from FactSet that the Street is slowly revising its S&P 500 earnings estimates down.
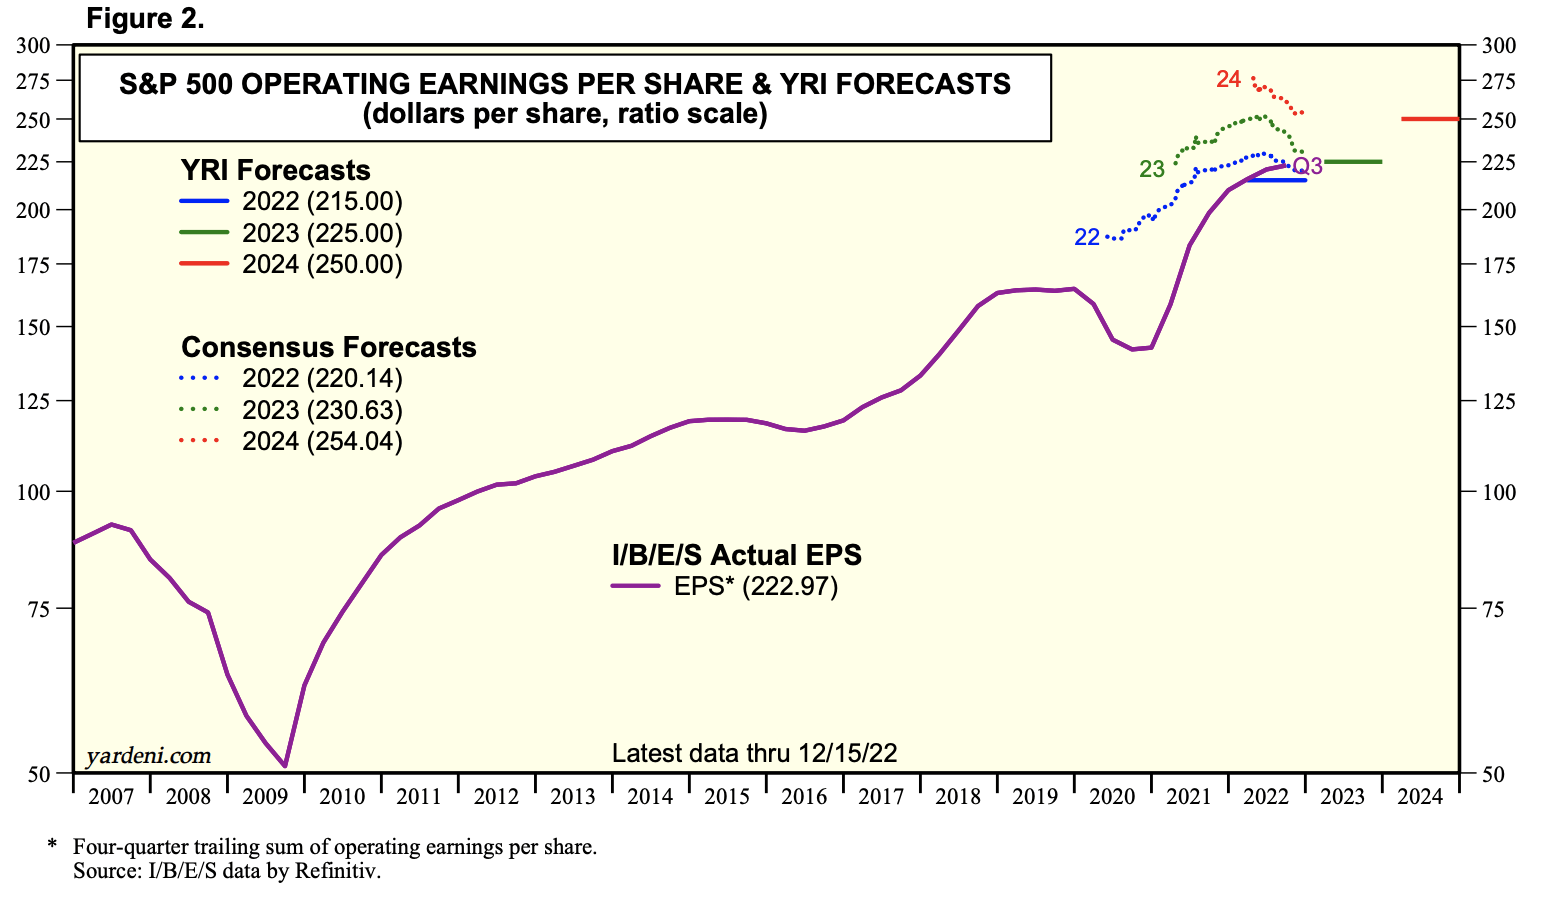
S&P 500 Earnings Estimates 2023 (Yardeni Research)
Real wages are stagnant (although there have been some recent glimmers of hope for workers). If households run out of excess savings, aren’t getting stimulus, and are paying more of their income in interest than they were in a ZIRP world, then where’s the money going to come from to push corporate profits to fresh all-time highs? 2019 was the previous best year for earnings, that year the S&P earned about $163. Nominal GDP is about 20% larger than it was in 2019 (this is mainly from money printing, not actual productivity growth). Nominal GDP should be a bit bigger next year than it is presently, which could add about $10 in earnings, but companies will have to refinance low-interest debt at higher interest rates and are getting some small tax hikes in 2023, so I think you can safely wash these factors out. If you assume corporate profit margins are the same as they were pre-pandemic and that the pandemic didn’t unlock some sort of cheat code to increased prosperity, then that gets you an earnings estimate of $195 for 2023. Interestingly, my estimate is independently almost the exact same as Mike Wilson’s.
For earnings to decline after stimulus ran out should surprise no one, and the fact that analysts project record earnings growth to continue in a hockey stick graph is not realistic. For the second part of our forecast, let’s take a look at what kind of valuation stocks should trade at to give investors enough compensation for buying.
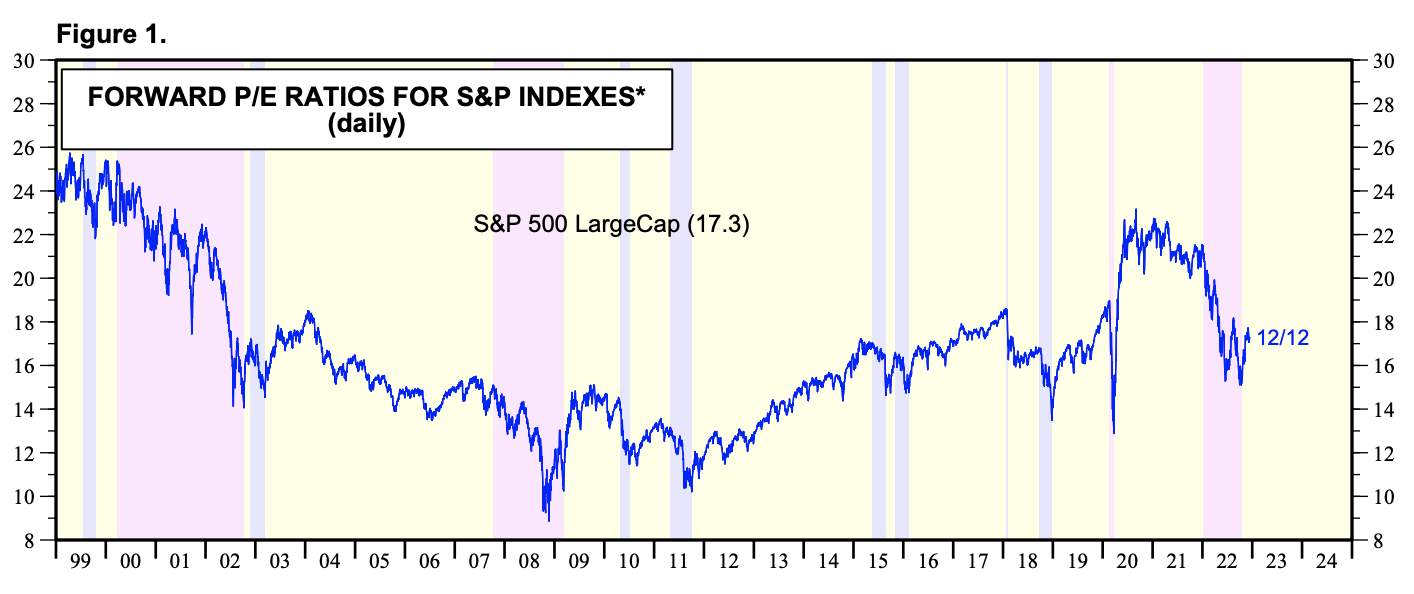
S&P 500 Forward PE ratios (Yardeni Research)
As you can see here, “normal” valuations for the S&P 500 based on forward earnings most of the time are anywhere from 14x earnings to 18x earnings.
- Valuations rose steadily in the 1990s, hitting 25x during the peak of the tech bubble, after which stocks subsequently fell 50% from peak to trough.
- Stocks also tanked 50% in 2008, but one interesting thing my research has found is that stock valuations were not crazy in 2007 – in fact, they were quite normal.
- Valuations steadily rose from deep discounts to historical norms from 2008-2012 to normal by 2016, back to cheap in the autumn 2018 rout, and then back to a bit overvalued in 2019.
- Then the pandemic happened. Things went nuts, taking equity valuations to near 1990s-era highs. The key differences between the late 1990s and 2021, however, were how inflated earnings were from fiscal and monetary stimulus, as well as the issue that the bubble in the 1990s was only in one asset class, whereas the “everything bubble” was in large-cap stocks, bonds, and housing simultaneously.
So if 14x to 18x earnings are “normal”, what should we expect going forward? I’d argue that we should trade on the lower half of this range due to cash rates being quite high, and due to the fact that earnings are going to have a hard time growing as they have in the past without help from the stimulus and tax cuts. This adjustment probably doesn’t all happen this year, but I’d expect the multiple to drift lower over time due to the supply/demand dynamics of more retired people selling stocks to live, structurally slowing earnings growth, the need to reduce budget deficits, and continual erosion of profit margins from higher rates.
Therefore, I’m going to hang a 16.5x multiple for stocks on top of $195 in earnings, equaling a fair value target for the S&P 500 of 3217 at year-end 2023.
That’s a bit lower than the prices in late 2019 and early 2020 when stocks were objectively a little overvalued–hitting 3217 would mark a near-total reversal of the pandemic-era bubble in stocks. And just because I say fair value for the S&P 500 is around 3200-3300 for this year doesn’t mean that stocks will necessarily trade there, or stop there if they hit it. History shows that periods of overvaluation are often followed by a shift in psychology from fed-up investors and a subsequent period of undervaluation.
I don’t have a crystal ball and market forecasting isn’t an exact science, but this kind of sea change could take stocks to 2800 or lower. The most obvious risk to the market on the downside is if we enter a recession, unemployment rises and there’s no easy way to bring it back down. But even still, if stocks fall that low, I don’t think they would stay there for long. The compensation that investors would get at S&P 2900 would be a lot better than it is now- my quick math implies stocks would likely be able to return 11-11.5% annually (earnings yield + earnings growth) from that price, vs. about 8.5%-9% annually now at current prices. And the risk to the upside here is if the fabled Fed pivot comes and stokes another round of inflation and a speculative bubble in stocks, but the 1970s and early 1980s show that it would be a terrible idea to try.
Should You Invest In Treasury Bills or Stocks?
I know what some of you are probably thinking – if stocks are offering at least some decent (if below average) long-term compensation, is it worth trying to “time the market” with some of your portfolio? I’d say yes because the markets are discounting unrealistic levels of earnings growth, so when that doesn’t hit, stocks will have to adjust downward in price. Also, this isn’t pure market timing, but also an asset allocation decision between putting money in cash paying 5% and stocks that are likely to earn 8.5% annually or so over the very long run but likely to fall in the short run. These decisions aren’t all or nothing but can be taken like any other asset allocation decision to allocate a percentage of your portfolio to cash as an asset class.
One way of thinking about whether stocks are offering good compensation is to compare multiples to the past. Another, arguably more forward-looking way to think about the market is to compare multiples on stocks to the rates paid on cash. Current T-bill rates are around 4.5% for 3-4 months of maturity, and you likely will be able to roll them over into new T-bills paying 5% or more. Another way of thinking about this is that stocks are expected to return 8.5% to 9% over the long run, but you can currently get over half of this return by taking zero risk. This means the returns in excess of cash that you can get for investing in stocks are quite low.
Plus, if you choose cash first, you can switch back into stocks whenever you please, giving you optionality to buy a market crash. Historically, when T-bills offer this kind of yield, stock valuations have been much lower than they are now. There are a few models that investors use to compare cash vs. stocks. One is the “rule of 20”, another is the “Fed model”, and another is to simply handicap cash yields with expected returns on stocks.
Should you sell stocks here if you’ve ridden them down 20% over the last year off of the highs? Arguments could be made both for staying in stocks or dialing back risk with cash. But if you have new money to invest each month, or if you have a windfall from selling a house, selling a business, or winning the lotto, it’s really easy to park it in Treasury bills and wait to see how the bear market plays out. Conversely, the S&P 500 index is up 42% plus dividends over the last five years, so if you’ve been in the markets a while, you’re likely not going to take any kind of loss by selling, even if you can’t get bubble prices anymore for your assets. Another approach I’d look hard at is to get away from the S&P 500 and move money into areas with better valuations like international stocks (VEA) and small caps (IJR).
Bottom Line
The S&P 500 is back in bear market territory. The first phase of the bear market is more or less complete, which has been to adjust valuations from bubble territory to normal ranges. The second phase seems to be happening now. Investors realize that not only their valuations were too optimistic, but that their earnings and profit margin estimates for stocks were too rosy as well. By this logic, the bear market is not yet in its final innings, and won’t be until profit margins and earnings recede to historical levels. Investors with long timeframes are fine here, but those needing money in the next few years are going to be at the mercy of the bear market for as long as it lasts. I believe the fair value for stocks is around 3200-3300, and expect stocks to approach those levels in the first half of the year and possibly fall through them if investors suddenly start caring about the structural issues with the economy.
“Editor’s Note: This article was submitted as part of Seeking Alpha’s 2023 Market Prediction contest. Do you have a conviction view for the S&P 500 next year? If so, click here to find out more and submit your article today!”
Be the first to comment