

BeyondImages/iStock Unreleased via Getty Images
Introduction
It’s earnings season again! This means we get to look at some of the most exciting earnings releases that not only tell us a lot about individual companies, but also a lot about the market and certain industries. J.B. Hunt (NASDAQ:JBHT) is one of these companies. One of America’s largest transportation companies reported blowout 1Q22 earnings as it benefits from strength across the board. The company rewarded investors with accelerating buybacks and a big dividend hike earlier this year. Unfortunately, not everything is in order in the industry as the company’s stock price performance suggests. Supply chain problems remain an issue and falling economic growth expectations are causing investors to de-risk their portfolios. The good news is that the big players will suffer but not succumb as it’s just one of many economic downturns. Hence my advice remains simple: benefit from sell-offs by buying best-of-class companies like J.B. Hunt on weakness.
Allow me to share the details:
Blowout Earnings, Poor Stock Price Performance
20%, that’s roughly how much J.B. Hunt has lost after peaking a few weeks ago. The stock is now down 16% year-to-date and back to price levels seen in the first quarter of 2021.
FINVIZ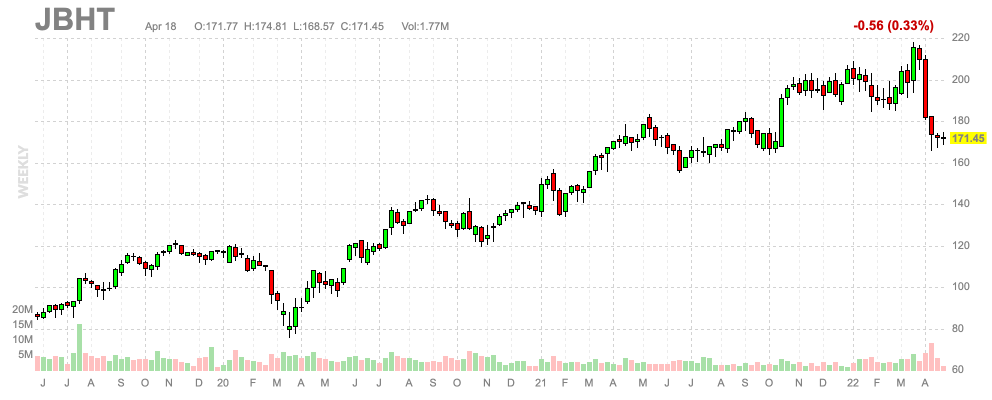
While the stock price is back at 1Q21 levels, its financials are not. In the just-released 1Q22 quarter, the company did $3.49 billion in revenue, which is $170 million more than expected and 33.2% higher compared to the prior-year quarter. Operating income rose by 61% to $334.3 million, which allowed earnings per share to come in at $2.29. That’s $0.34 higher than expected.
In the 1Q22 quarter, the company generated 60% of its operating income in its JBI segment, which accounts for 46% of total revenues and covers all of JBHT’s intermodal operations. This segment is home to America’s largest 53″ high-cube container fleet, America’s largest drayage fleet, and it benefits from priority loading and unloading at major rail terminals.
In this segment, the company did $1.6 billion in revenue as volumes increased by 7%. JBHT reported outperforming volume growth in Eastern network loads (+10%). Moreover, these results include supply chain issues. According to the company:
Volumes early in the quarter were negatively impacted by network fluidity issues attributable to labor challenges within the activities of our rail providers and customers, as well as our internal operations largely as a result of COVID-related disruptions. As the quarter progressed, volume levels strengthened as customer unloading activity improved, although rail network velocity continued to govern our ability to capitalize on even greater intermodal demand.
A few days ago, Supply Chain Drive run the following headline:
Supply Chain Drive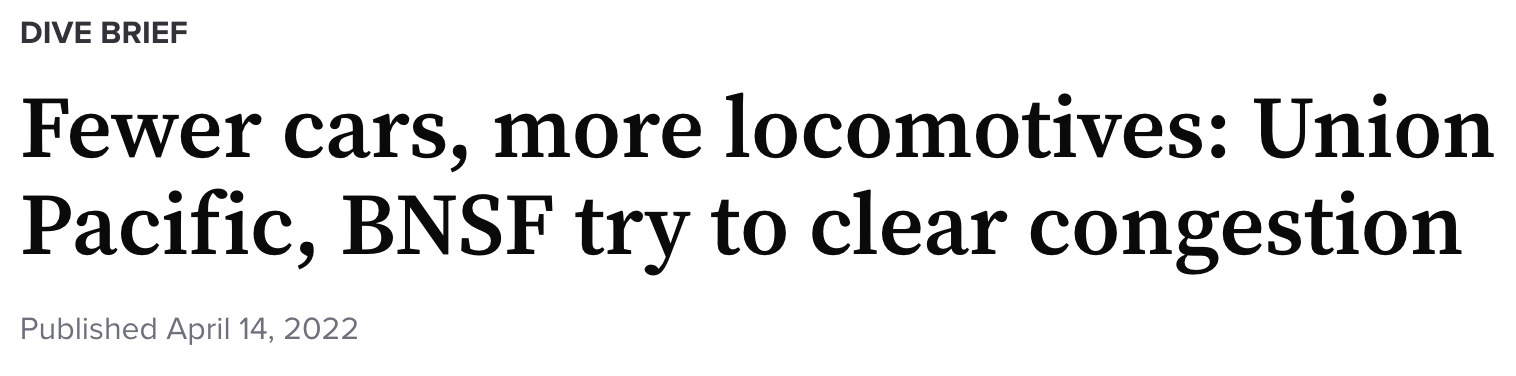
One of the major problems is that there are too many containers waiting for transportation. Now, railroads are working on ways to move more intermodal as they bring back locomotives. According to the article:
The railroads are also adding locomotives and limiting the number of cars in their networks in a bid to maintain network fluidity. Union Pacific has added 50 locomotives since January and will remove between 2% and 3% of its cars across multiple commodity groups, according to the customer letter. BNSF said in its intermodal update it will add 100 locomotives this month. It will reduce railcar inventory by 2%, according to a letter in response to NGFA.
In the case of JBHT, the company benefited from J.B. Hunt 360, which turned five years old and was now more than ever a great tool to provide efficient sourcing capacity for the company and its customers.
Despite challenges, the company did $483 million in adjusted EBITDA with an EBITDA margin of 13.85%. That’s one of the best margin results ever. Note that the graph below also includes forward-looking data.
TIKR.com
And, even more important, the company is positive going forward when it comes to intermodal:
In closing, Intermodal’s value proposition remains strong, supporting our view of long-term sustainable growth. We continue to see ample opportunities to convert highway freight as well as transloading cargo into our domestic containers. We believe our service backed by our people and the ownership of our equipment is differentiated in the market and even more so when combined with the power of the J.B. Hunt 360 platform that allows us to source capacity efficiently when needed.
The good news is that JBHT is finally breaking out of a very long sideways trend. Between 2014 and 2020, EBITDA growth was extremely sluggish as the company ramped up investments in its business and because economic growth wasn’t great after 2018. Now, the company is coming back roaring. EBITDA is expected to continue its upwards trajectory, resulting in $2.1 billion in 2024 EBITDA. This move is supported by higher (expected) EBITDA margins and stronger free cash flow. Next year, the company might do $560 million in free cash flow.
TIKR.com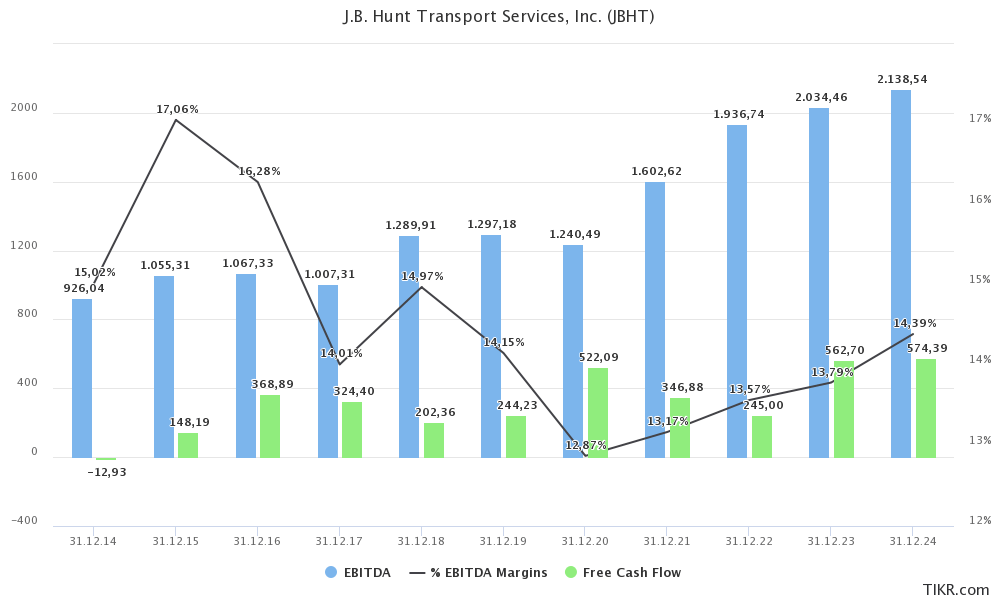
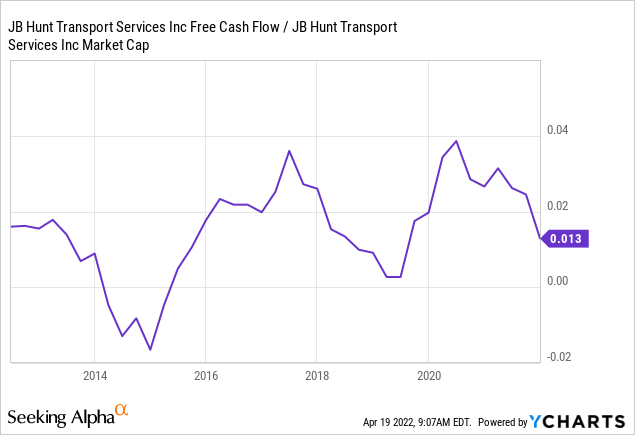
To give you an idea of how much that is, it’s roughly 3.1% of the company’s $18.0 billion market cap. If this number remains close to 3%, the company is in a fantastic position to reward investors with high buybacks and strong dividend growth. After all, net debt is expected to end this year at $1.2 billion, or just 0.6x EBITDA. This means there is no need to prioritize the balance sheet.
This is what the company commented on that:
We will continue to prioritize supporting the growth of our business with reinvestment as needed, remaining committed to our investments in capacity to help serve our growing customer base. We recently increased our quarterly dividend to $0.40 a share or 33% from prior levels and keeping with our dividend strategy. We also intend to incorporate mindful share repurchases and opportunistically execute on M&A opportunities. We remain conservatively leveraged to maintain our investment grade rating. However, we are not afraid to increase leverage as opportunities arise.
What’s interesting is that almost all of the company’s operating cash flow leaves the door one way or another. Please bear in mind that free cash flow is basically operating cash flow minus capital expenditures. Free cash flow can be used to distribute a dividend, repurchase shares, reduce debt, or acquire businesses. The graph below shows the many ways operating cash flow leaves the company. Most of it goes to suppliers of capital investments. This mainly means new trucks, containers, and related maintenance. Then, the company uses dividends and buybacks to “get rid” of the difference.
J.B. Hunt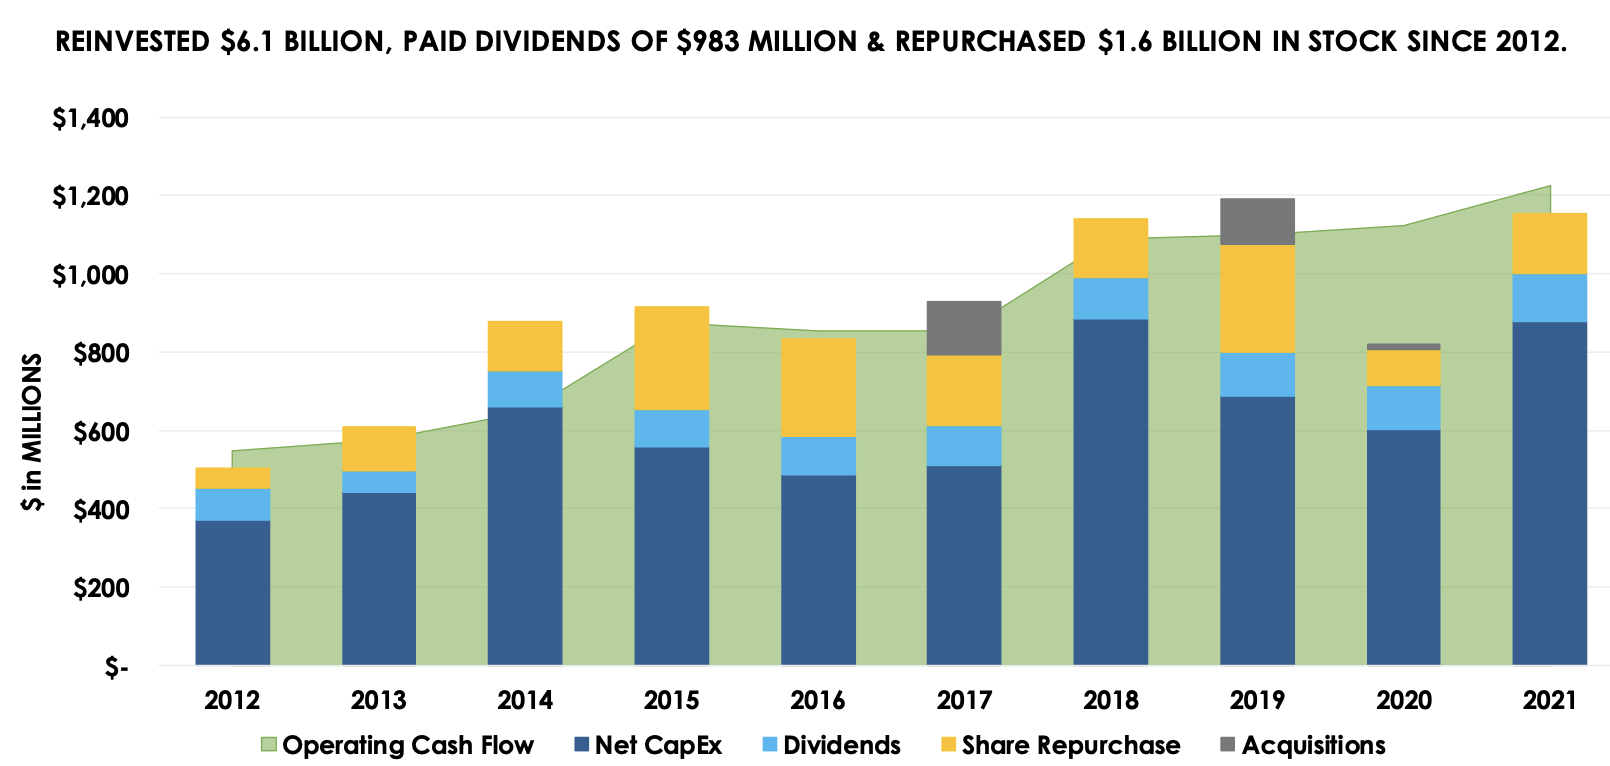
While it’s hard to see in the graph above, the company’s dividend growth is impressive. Over the past 10 years, the dividend has grown by 9.6% per year (on average) according to Seeking Alpha data.
With that said, there’s a reason the stock price is down.
Valuation And Outlook
As I already mentioned, JBHT has sold off quite violently this year, falling more than 20% from its all-time high. Even after the earnings release and earnings call, the stock did not budge. It’s roughly unchanged while I am writing this – the market is currently up 1% on the day.
What has happened to JBHT is that investors have priced in slower economic growth. I like to compare cyclical companies to the Empire State Manufacturing index, a survey-based forward-looking indicator that tells us what we can expect in terms of economic growth. Right now, JBHT is trading roughly unchanged compared to 12 months ago, this prices in flat economic growth.
Author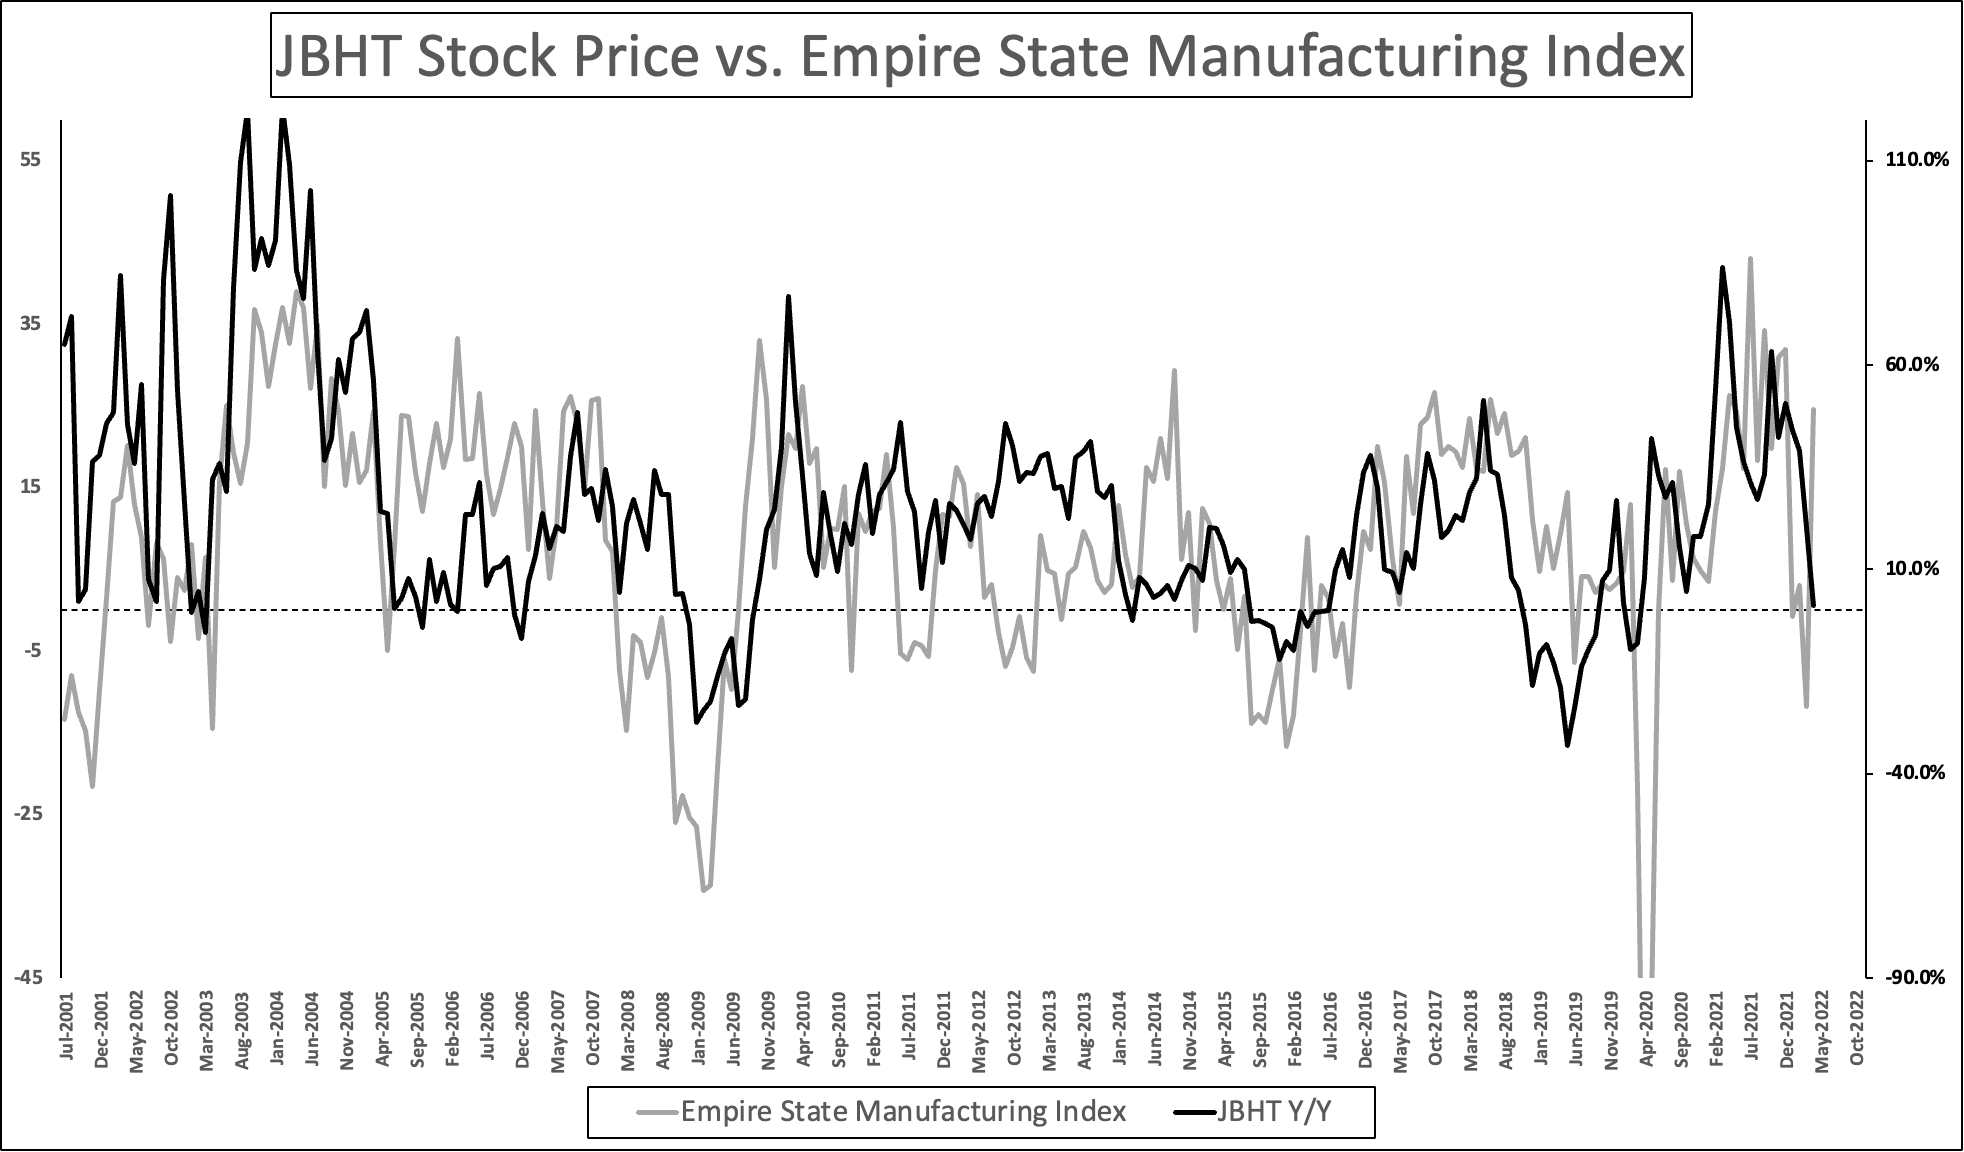
Overall, growth expectations have come down significantly due to high inflation, weaker consumer sentiment, uncertainty regarding the Federal Reserve, which is set to tighten into weakness, and ongoing supply chain issues.
Right now, China has locked down roughly 40% of its GDP as it fears the spread of COVID in major cities like Shanghai. This is expected to cause new supply chain problems. Meanwhile, Russia invaded Ukraine in February, leading to high(er) energy inflation and problems in the automotive industry (among others).
It’s an incredibly tricky situation and investors have responded by dumping stocks like JBHT as these companies are set to “suffer” a bit longer until supply chain issues have been resolved.
For example, the picture below shows the ships that are waiting in Shanghai. What looks like an expensive painting in an art gallery could very well be the start of yet another wave of supply chain issues. This can consist of lower export demand for US products as no ships are available and later on the problems that come with multiple ships reaching US ports simultaneously.
Twitter (@DanCollins2011)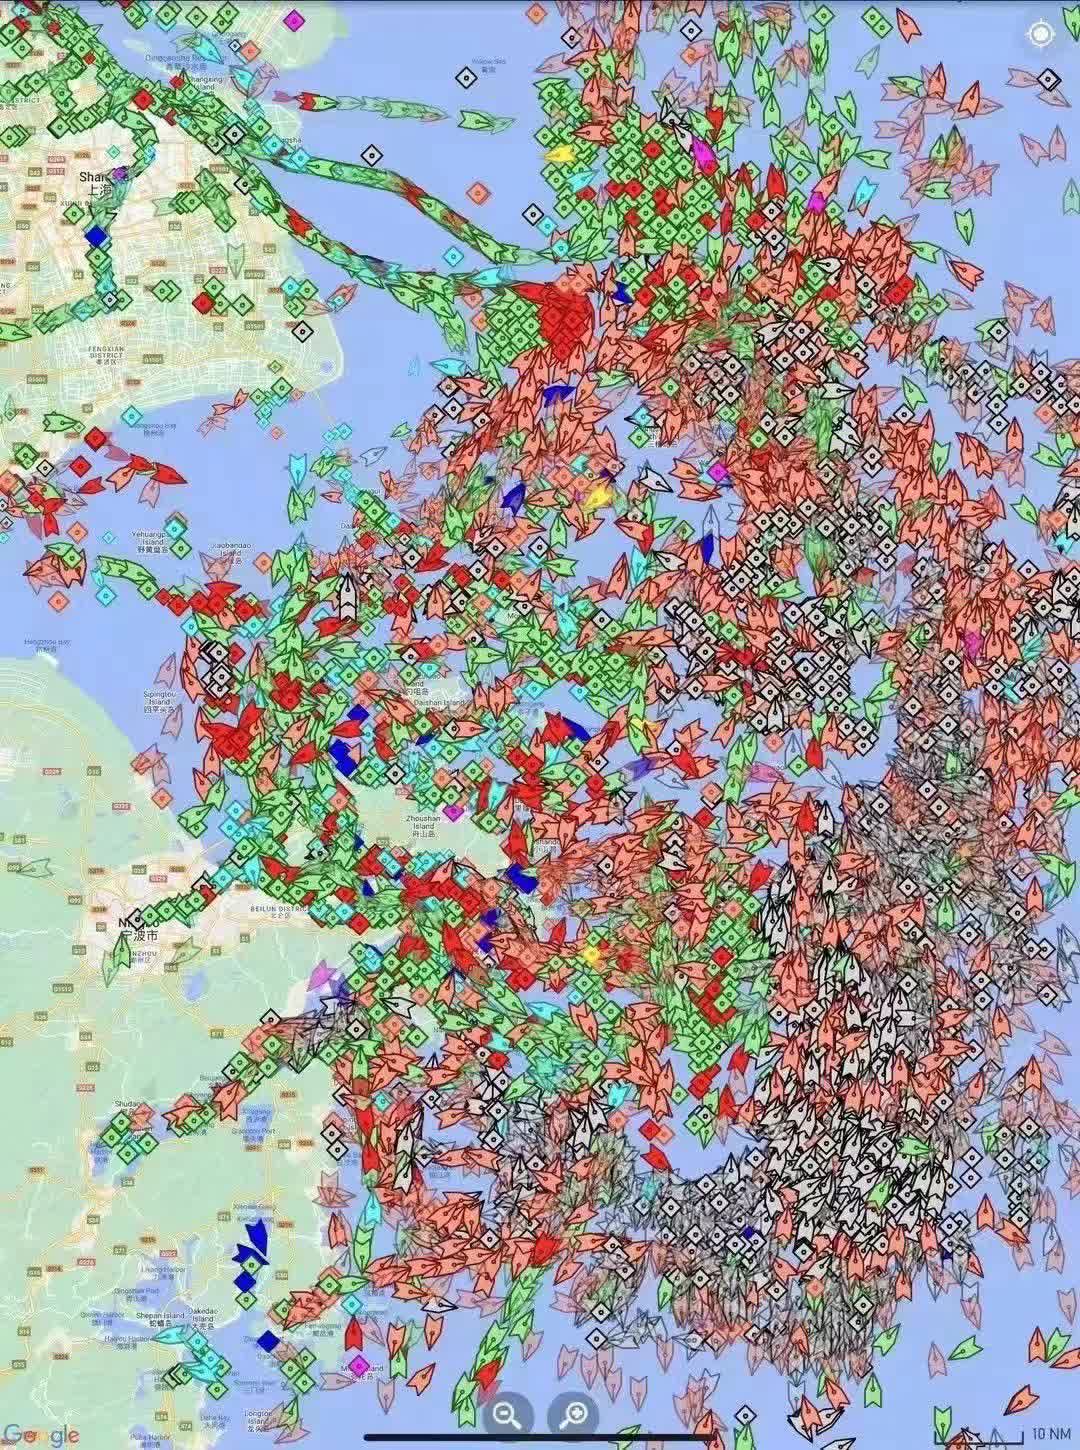
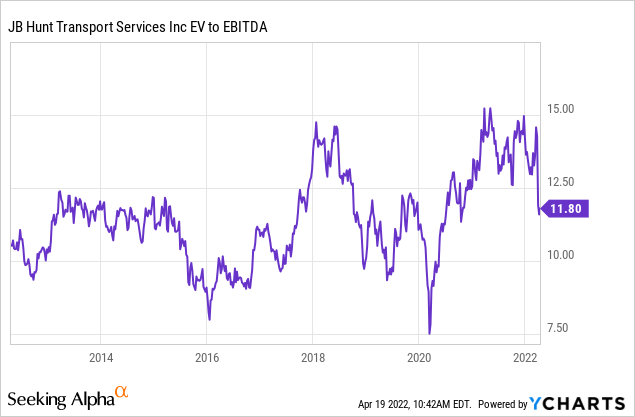
Either way, risks are rising and investors responded by selling JBHT. In terms of valuation, we’re dealing with a $19 billion enterprise value based on an $18 billion market cap and $1.0 billion in expected 2023 net debt. This implies a 9.5x EBITDA multiple, using $2.0 billion in expected 2023 EBITDA. This valuation is too cheap. Even if 2023 expected EBITDA were to come down 25%, the stock would be fairly valued. Note that this includes my 3.1% free cash flow yield estimate, which also indicates that the current price is very fair/attractive.
Here’s how I would deal with the stock.
Takeaway
Steep drawdowns in great companies give me mixed feelings. While it’s never fun if (unrealized) capital gains go down, it’s fantastic to buy great companies at even better prices. Right now, J.B. Hunt is in a somewhat tough position. Investors are currently sitting on 20% lower capital gains since the most recent all-time high. Yet, the company continues to do well. The just-released earnings were good. Margins are up and the company’s investments in its business are paying off as free cash flow and (expected) EBITDA are rising.
Yet, investors are still not sold as the stock cannot catch a break. The problem is that the market, in general, is pricing in slower economic growth. Supply chain issues are more than likely to remain persistent, consumer weakness could hurt sales and transportation demand, and nobody knows what happens if the Federal Reserve hikes into economic weakness.
I believe that there is more room for weakness as investors tend to go too far when pricing in risk. Also, and in their defense, it’s very hard to tell how bad things can get for the economy.
If you’re long JBHT, don’t change anything. The company has proven to be a great long-term investment and it will continue to be that way. If you’re looking for an entry, I would look to buy as close to $160 as possible as that would give us a great risk/reward. Or, if you’re able to, monitor the ISM manufacturing index. I will do that as well going forward. Buy shares when the index bottoms. At that point, investors will come back and price in higher growth.
Right now, the index is rolling over as I explained in a recent transportation-focused article.
Buying current prices is also an option. The valuation is good and the downside is limited. In that case, I would divide an initial investment into parts and buy gradually over time (i.e., divided over 2-3 months) starting at current prices. If the stock drops further, you can average down. If the stock price takes off (I don’t expect that), you have a foot in the door at a great price.
(Dis)agree? Let me know in the comments!
Be the first to comment