


We Are/DigitalVision via Getty Images
Anavex (NASDAQ:AVXL) seems to have ignited a firestorm following the release of pivotal clinical results in early December 2022. These results were presented in detail at the CTAD Alzheimer’s conference (although this deck is no-longer available), and the company later presented the same data (with some additional explanation) in its own conference call. They come from the company’s Phase II/III clinical trial of blarcamesine for the treatment of Alzheimer’s disease. Following the announcement, the stock traded up over 30% despite criticism of the results from biotech journalist Adam Feuerstein, among others. The situation closely mirrors the announcement of the company’s Rett syndrome results in early 2022, in which the company presented data with endpoints that were only changed in the clinical trial protocol weeks before, similarly bringing the criticism of the biotech press and others.
My hope with this report is to examine the data presented by the company with as un-biased an eye as possible. I do not want to speculate about the veracity of the data, but rather take the company at its word and look at specifically what their numbers imply. I am applying rigorous statistical principles to these data, and I encourage the reader to replicate this analysis.
Based on the data provided by the company, we have come to the conclusion that these data are not supportive of approval, and the company would be required to run additional studies and hope to reach a different conclusion, at major expense to the company.
Note: Anavex was provided with a copy of this report 5 days before publication. They initially stated that they would provide feedback, were given extra time to respond, but did not follow up.
Primary endpoint confusion
There is some confusion regarding the primary endpoints of this trial stemming from how the clinical results were presented. The trial had coprimary endpoints of:
- ADAS-Cog (Alzheimer Disease Assessment Scale-Cognition) [ Time Frame: 48 weeks ] Reduction in cognitive decline assessed from baseline over 48 weeks with ANAVEX2-73 compared to placebo using the Alzheimer Disease Assessment Scale-Cognition (ADAS-Cog)
- ADCS-ADL (Activities of Daily Living) [ Time Frame: 48 weeks ] Reduction in decline of the ability to perform daily activities assessed from baseline over 48 weeks with ANAVEX2-73 compared to placebo using the Activities of Daily Living Scale (ADCS-ADL)
The confusion stems from the fact that the company prominently displayed different results from a set of different endpoints using the ADAS-Cog and ADCS-ADL scales. The company presented a responder analysis where the number of patients past a certain threshold were counted as responders. This is different than the above endpoints, which do not have such thresholds and just compare average responses. Despite the confusing statements from management, as the trial was designed and documented in both the company’s earlier presentations and in the clinicaltrials.gov reports, the endpoints are those above, and not responder analyses.
ADAS-Cog decline
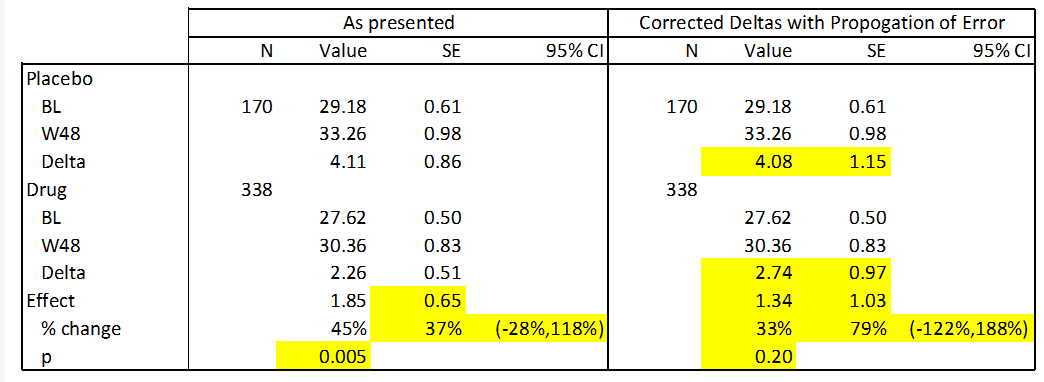
The one prespecified endpoint that the company provided data on was absolute declines in ADAS-Cog. This is a simple cognitive assessment in which a patient performs 11 tasks such as word recall and is assessed by a provider. The company presented the following data in their slide deck:

Anavex
These data present a statistically significant improvement of 1.85 points between drug and placebo. However, there are multiple arithmetic and statistical errors in this table:
- The “Mean Change” presented is not a subtraction of week 48 from baseline, i.e. (for the treatment arm) 30.36 – 27.62 = 2.74, not the reported 2.26.
- The calculated standard errors ((SEs)) do not reflect the correct propagation of error from prior measurements. For instance the propagated error for the delta in the drug arm is the square root of 0.50^2 and 0.83^2, or 0.97, not 0.51 as reported.
- The confidence intervals on the “Relative Reduction” data are much too small considering the SE in the data. These values are incorrect for both the data as presented as well as the data with corrected SEs.
- The baseline values in this data differ from those previously presented in the slide deck.
In the following table I present corrections to the above data using standard statistical techniques. This is possible because the standard deviations for this data are easily calculable from the SEs. Calculated and corrected values are presented in yellow below. For this analysis I used the baseline data presented in the above table (as opposed to the baselines presented earlier in the deck) because I do not know what the correct value is. However, the results are similar if these numbers are substituted.
Anavex, calculated values.
Interestingly, when the data as presented is used to calculate a p value, I arrive at a more significant result than what is presented in the company’s data (p=0.005 vs. p=0.033). The reason for this is unclear. However, when the data is correctly subtracted and errors are correctly calculated, this data becomes statistically insignificant (p=0.20). This is because the effect size is substantially smaller (28%) and the error is substantially larger (59%). I hope the reader can see that these conclusions are the result of straightforward calculations, and we encourage you to duplicate them.
The company provided the following logic in their revised deck (linked above) for why these values above fail to comport with one another:
Analysis method: t-test on change from baseline at the end of treatment (week 48) on subjects with available scores at week 48. Mean change from baseline obtained from an average of ADAS-Cog score change for each subject. Mean of change from baseline not equivalent to subtracting mean baseline scores from mean end of treatment scores when all subjects do not have both measures.
From this explanation, it appears as if the company used paired measurements (from patients with both baseline and week 48 measurements) to derive the delta’s for each group, but the averages for baseline and week 48 included all patients. This would be a deviation from commonly accepted trial protocols, because any patients that withdraw from the study prior to it’s completion should use the last available measurement as their readout. All patients on the study should therefore have a before and after measurement, and this protocol is ostensibly universal.
ADCS-ADL decline
This co-primary endpoint is not discussed at all in either the initial data presentation or in the follow up presentation from the company. The company CEO Christopher Missling was asked why the data did not include details of the decline in ADCS-ADL on the conference call, and here was his response:
That’s very important to understand. So the CDR sum of the boxes, the ADAS-Cog and the ADCS-ADL co-primary endpoints of odds ratio were prespecified specifically in the SAP, in the statistical analysis plan. And the reason for that is because we are aiming for showing an improvement for patients, and that’s something which we knew from previous Phase IIa trials and the Parkinson’s dementia trial that we should go after that also for differentiation of the drug and for labeling reasons. That is really the key to understand. We are aiming for that, and we prespecified explicitly that analysis of improvement over a threshold of clinically meaningful improvement even in the clinical study — statistical analysis plan.
Responder analyses
As we discussed above, the majority of the company’s discussion of the study was focused on ADAS-Cog and ADCS-ADL responder analyses, as opposed to the primary endpoints of absolute change in these scales. These responder analyses have a similar construction:
- Average values on these rating scales are gathered for before and after treatment
- The absolute improvement or worsening in these scales is calculated, as it is for the primary endpoints.
- These values are then compared against a chosen threshold and the number of patients surpassing this value is reported.
Responder analyses are typically done in situations where the study cannot be powered to find the absolute improvement, because they are more statistically forgiving. You typically find these types of analyses in midstage cancer studies, where patients are labeled as having a PR (partial response), CR (complete response) etc., but in later stage cancer trials, progression free survival or overall survival (both absolute measures) are the approvable endpoints.
The use of these responder analyses as the main data that the company is presenting has been one of the most controversial details surrounding this release. The controversy stems from the fact that these were not discussed publicly or documented as part of the clinical trial protocol prior to the release and we believe that they are unlikely to be able to support approval.
Responder analyses are extremely prone to bias when the thresholds are defined after the fact, so most studies define the threshold and publish it in their protocols before performing the analysis. Although Anavex claims that these thresholds were prespecified, the values used in this study were never published anywhere and are not consistent with thresholds used in any other similar study. The company themselves document some of this in their presentation when comparing these endpoints to those of other studies.
The easy way to illustrate why these analyses are biased to compare them to a football game: the goal line is a magical line that the team must cross to get a goal, but if everyone agrees to where it is before the game, everything is fair. It would not be fair for instance to declare after the game that really the 30 yard line is the goal and you scored every time you crossed it. Even if you crossed that line more, it wouldn’t be fair to the other team. They might as well have chosen the 45 yard line which they crossed more often.
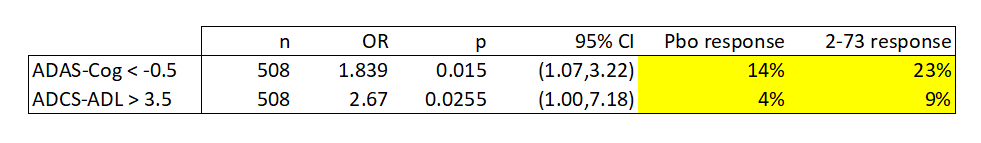
Despite the deficiencies in this type of data, I decided to perform the same analysis and check the calculations provided by the company. Using the p values reported by the company (and confirmed using the confidence intervals), I can estimate the response rate in both cases. Again, yellow cells reflect calculations. These calculations use a Fisher Exact Test.
Anavex, calculated values.
We find that the response rates observed in this study by the company’s own criteria are low. In particular, the response rates for the ADCS-ADL threshold were very low at single digit percentages. The response rates by both metrics are lower than other products; for instance aducanumab, the controversial anti-amyloid antibody developed by Biogen (BIIB), had 37.1% ADAS-Cog response rates for the much more stringent -3.0 point cut off.
Impacts and next steps
The company has guided towards its next steps, but the likely event is for the company to communicate this data to regulatory authorities to determine if additional studies are needed. The company never obtained an IND in the United States, and as such, this and all previous studies have been run completely outside of the US. Therefore, it is unlikely that the FDA will allow an NDA submission. The study was run in Australia and the UK and the company may seek approval in those geographies first, but based on our analysis of the data above, we think it is likely that the company will need additional studies for approval in any geography.
The majority of patients in this and prior studies have been enrolled in Australia, where the government provides support for clinical development. This has allowed the company to constrain costs substantially. If the company were to seek approval in the US, they would need to run a major clinical study in the US without this financial support, which could require substantial cash. Currently the company spends $34.5 million on R&D (FY22), but a large fraction of this was stock based compensation. Operational cash burn for FY22 was $24.3 million, and this could easily double if the company needs to run a study in the US.
The company currently has $149 million, which should be sufficient cash for the near term under any scenario. However, we expect the company to raise the cash needed to run additional studies before it runs out of cash, and this is likely to measure in the $100s of millions. the current study is small for an Alzheimer’s trial with other programs with US studies requiring patient counts that are multiples higher.
Conclusions and risks
As much as we desire a new effective treatment for this devastating disease, our inevitable conclusion following a detailed examination of the company’s data is that this particular project will need substantial additional investments before we will have a clear idea of it is approvable. It is our belief that the current data falls short of this because of several reasons:
- It failed to reach significance on its prespecified primary endpoints
- The alternative endpoints presented were subject to bias because they were not prespecified
- The alternative endpoints are not approval under normal circumstances regardless
We can be encouraged by this data without assuming that it will be sufficient for approval. Regardless of this data’s approvability, the company does not have a package it can submit to the FDA and will need additional studies for US approval regardless, at significant expense.
The current market valuation for AVXL is $747m. This would be a reasonable valuation for a company ready to seek FDA approval for a product, but we believe that these hopes are misguided and that this valuation has significant downsides. We are therefore short AVXL.
There are however multiple risks to this trade, the most prominent being the risk that the company is able to achieve approval from an amenable regulatory agency. Biogen (BIIB) was able to get approval for Aduhelm without a substanital demonstration of efficacy. However, that approval was extremely controversial and the drug is selling very poorly. We believe following the substantially more robust results from studies of lecanemab has somewhat changed the landscape, because there is a drug with strong data to support it that can meet the medical need. We are bullish on the approval of lecanemab.
Other risks associated with the trade include headline risk, because the stock may go up on the announcement of FDA meetings or other progress it makes towards approval and commercialization. We believe that gains here will likely be short lived because these communications will ultimately lead to the conclusion that additional studies are needed and the company will need to raise capital to support such activities. This expense is likely to be large. For instance lecanemab was supported by a study over 3 times the size of the study we are currently discussing.
Finally, there are risks associated with short trading. The current rate is in the 3-4% range, but this could change quickly, especially if there are additional developments that make the short more attractive. Average volume is abut 8 million shares a day or over 10% of the float, which also doesn’t put many limitations on the short currently, but could also change, and we advise the reader to be aware of this risk.
Be the first to comment