

DNY59/E+ via Getty Images
Bear market (NYSEARCA:SPY) bounces are always nice because eventually one of these bounces will mark the end of the bear market. This latest bounce has sell signals and now we know that it is not the bounce that is going to end this bear market, despite our hopes for an end.
To end this bear market, the SPY, after breaking out above the 200-day moving average downtrend, needed to go much higher than $410. It failed to do that and instead sold off, breaking below the 200-day downtrend and going down to retest support at $392. That triggered Sell Signals which you can see on our daily chart and Point & Figure chart shown below.
The broken support levels on the way down now become resistance levels as price has a technical bounce off $392 support and tries to get back above $401 and the 200-day bear market downtrend. Our sell signals on the charts below tell us that this will be very difficult to do. For example, in order to reverse the sell signal on the Point & Figure chart, price would have to breakout above $404. Strong resistance ~$400 makes $404 a real challenge for this technical bounce.
While the PPI and CPI may provide a little good news, in the larger scheme, they will not take the Fed much closer to its 2% target for inflation. That is a long way off. On the other hand, if both of these numbers indicate little change in inflation, we expect the SPY to drop and break below $388. This would be a continuation of a price drop that is targeting a retest of $348.
In addition, the Fed is coming up to bat on Dec. 14, and we expect a repeat performance of the last time. The Fed will once again talk about decreasing the rate of increase from 75 basis points down to 50 basis points. It will also talk about the increasing upper limit it has for interest rates. The Fed will keep interest rates high until it sees inflation dropping substantially or unemployment increasing substantially. Both of these are a long way into the future.
Meanwhile, other factors are playing on the market. How much will corporate earnings drop for the S&P 500 and what P/E will be applied to those earnings. For example, if earnings dropped to $220 and the P/E dropped to 15, that would give a target of ~$330 for the SPY. Corporate earnings are being hit by a rising dollar, inflation, supply disruptions, and a squeeze on profit margins. Add to this, the drop in revenues due to the worldwide recession. Not a pretty picture for CEOs during 2023.
Another factor with the worldwide recession is its effects on the price of commodities, especially oil. OPEC is already reducing production in anticipation of a drop in demand due to a worldwide recession. A jump in oil prices could deepen any recession. Russia is a wild card not only in energy, but in the war in the Ukraine. The market has not priced in a nuclear strike or a war with Russia, because it is unlikely, but Putin keeps threatening.
Here is our daily chart showing the latest, red, vertical line Sell Signal. You can also see the failure of price to stay above the 200-day moving average bear market downtrend.
Red, vertical line, sell signal, daily chart (StockCharts.com)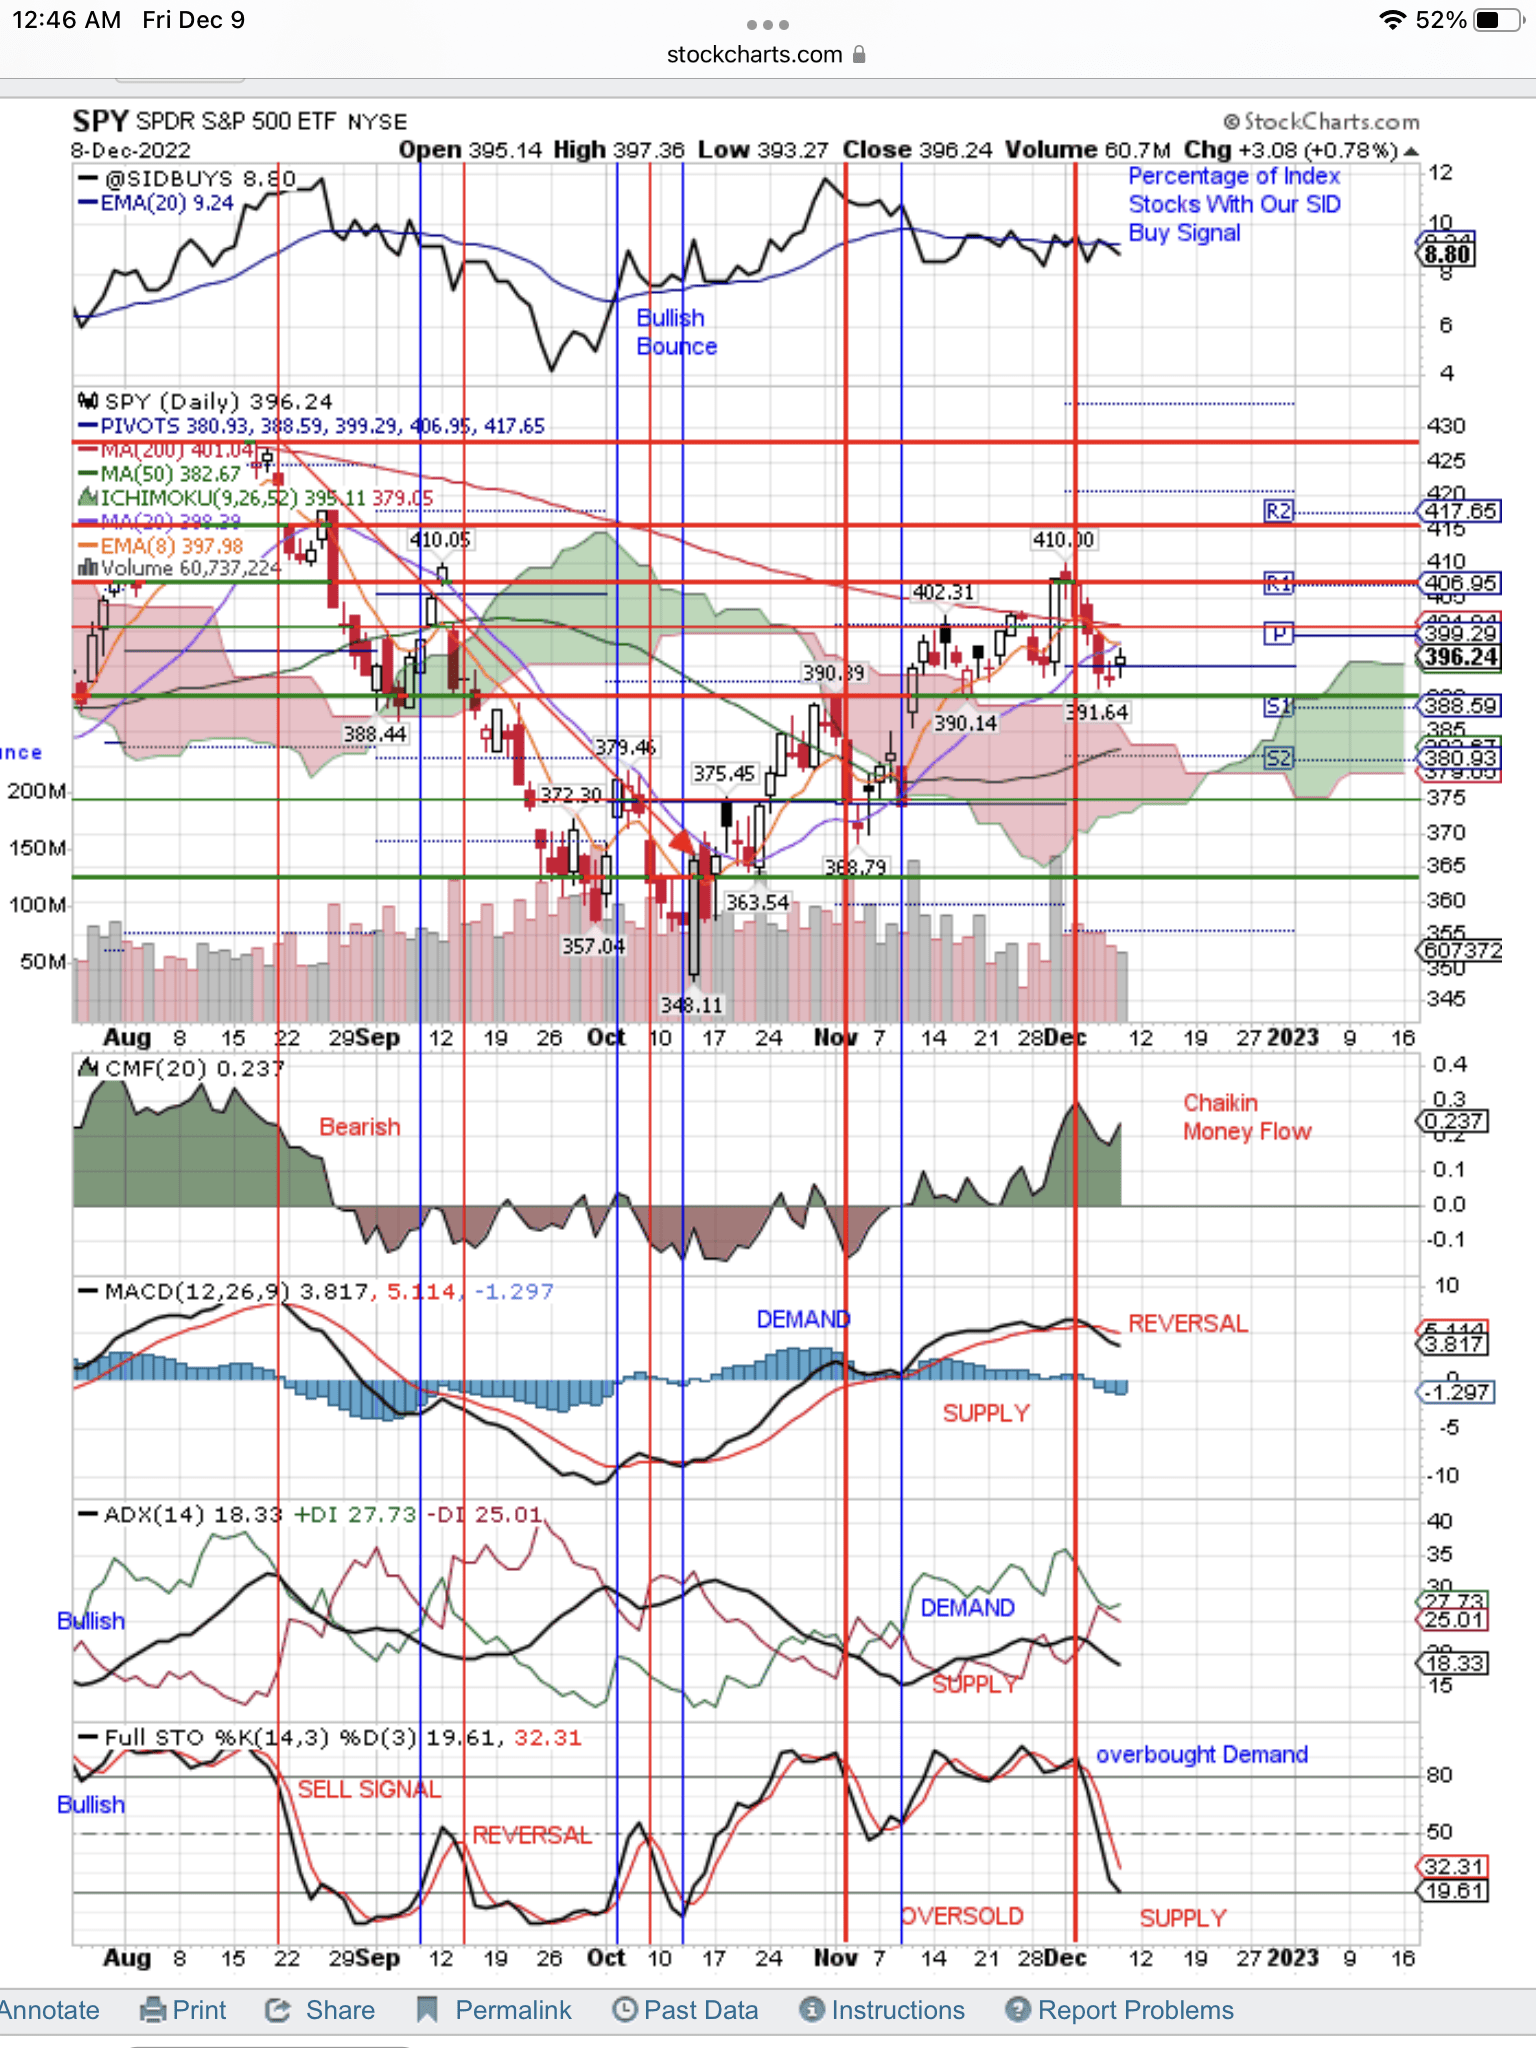
Here is the reversal Sell Signal on the Point & Figure chart. You can see the rising column of “Xs” has switched to a dropping column of “Os”.
Reversal Sell Signal (StockCharts.com)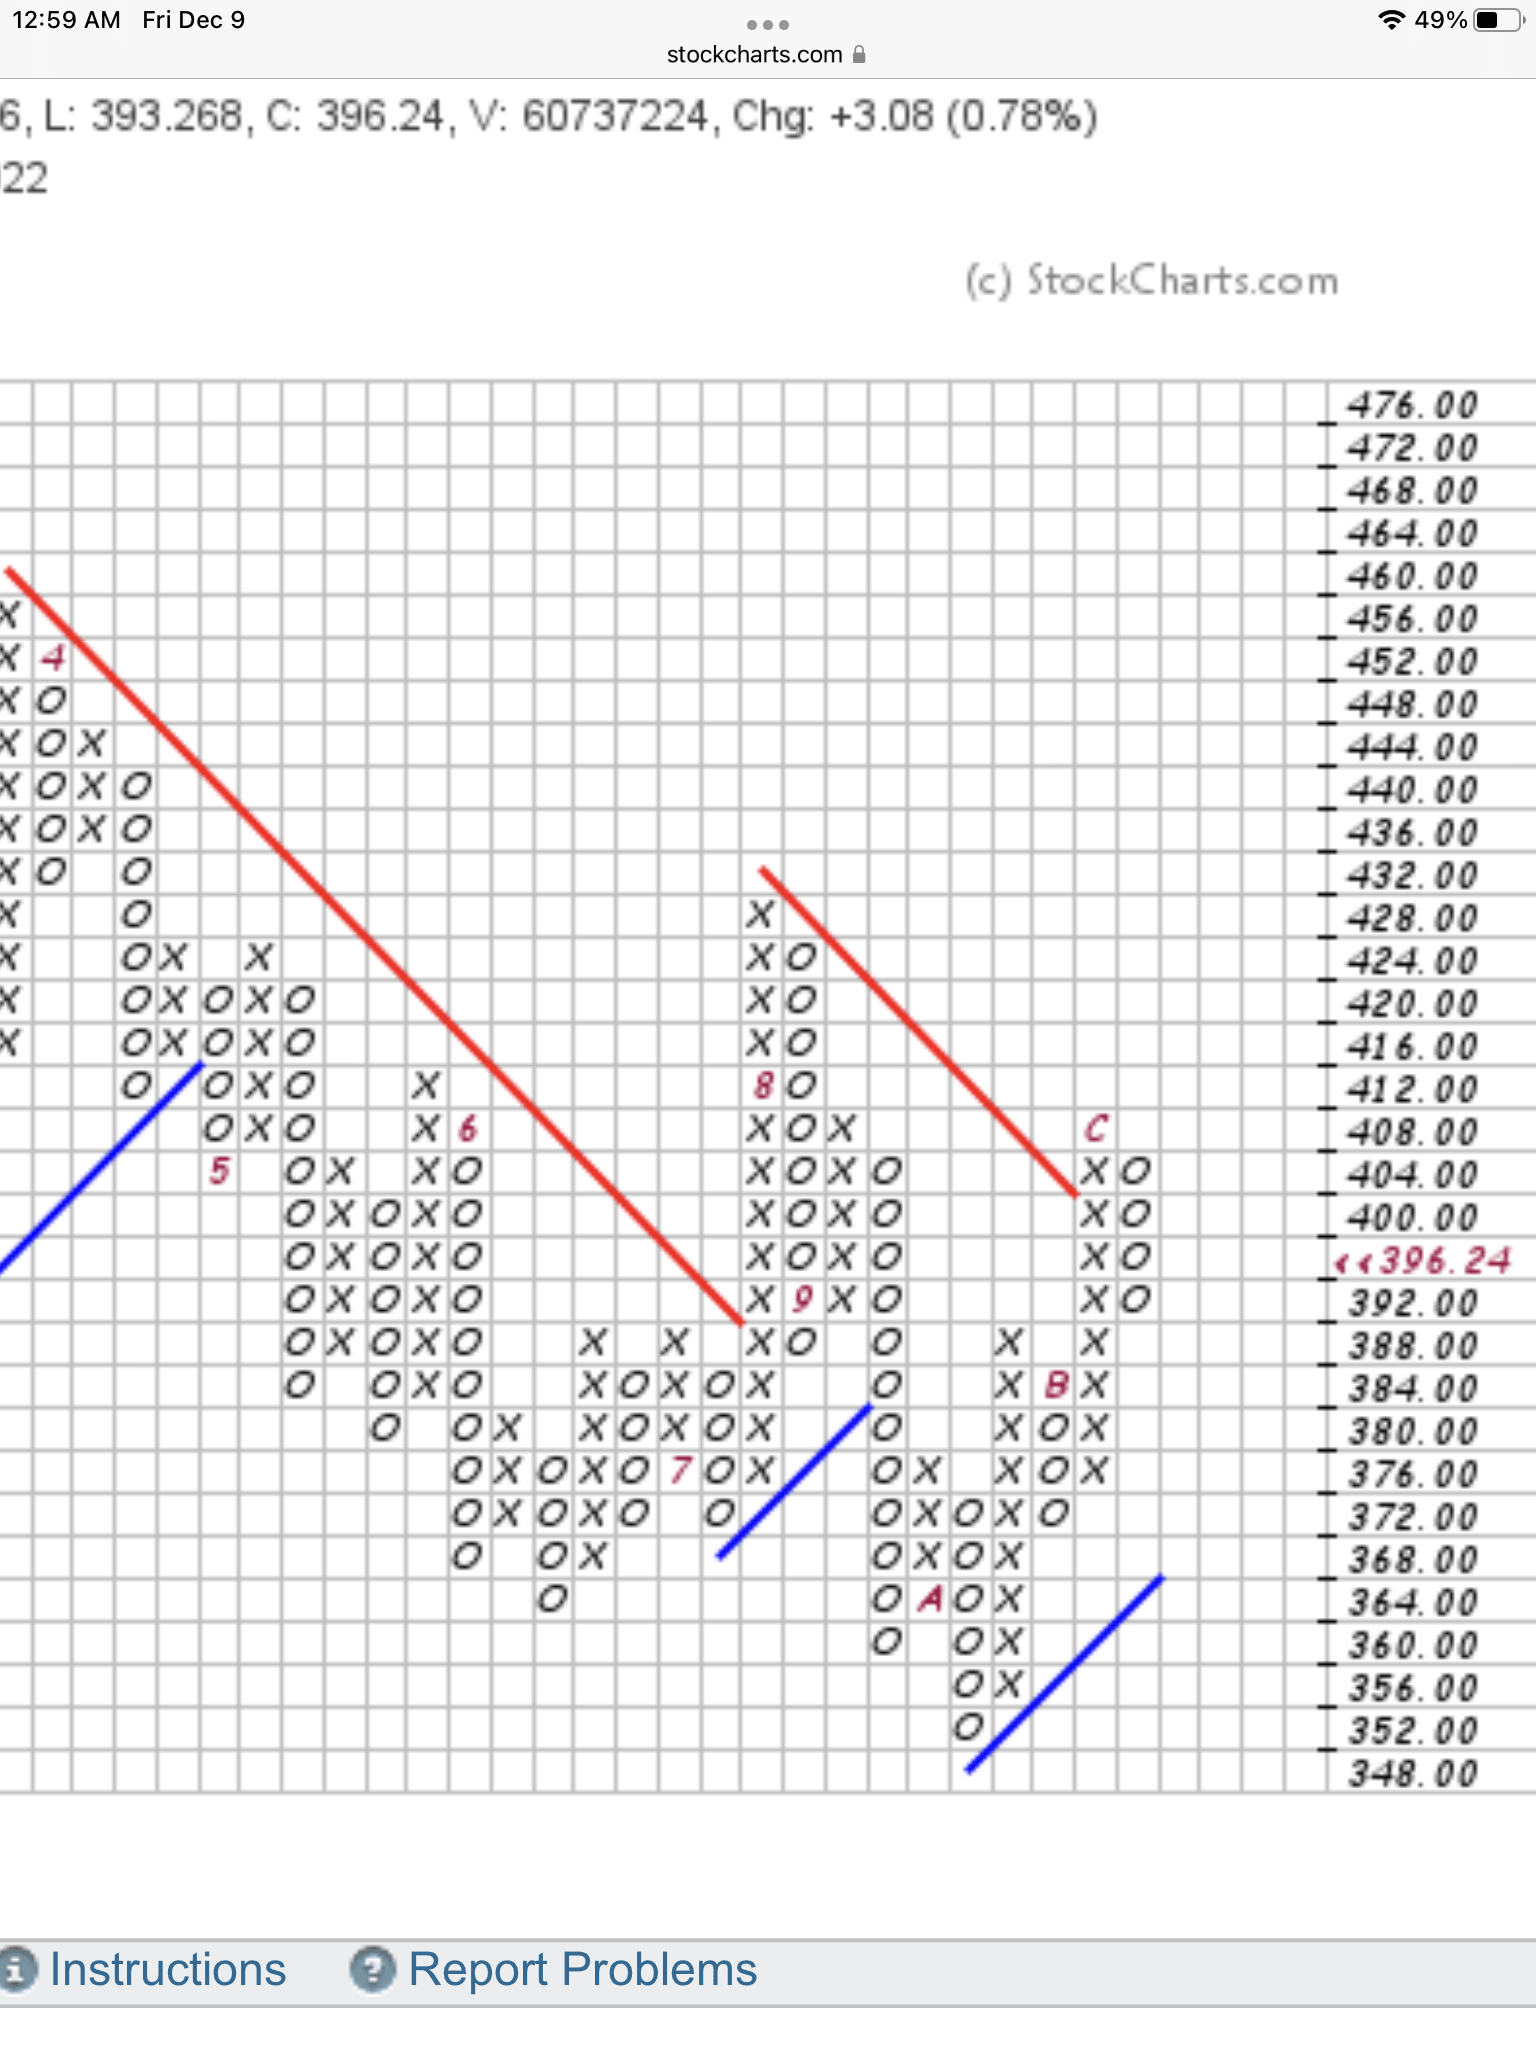
Be the first to comment