

jejim/iStock Editorial via Getty Images
Intro
In our analysis of stocks, we like to initially study the long-term chart (Macro) and then move up to how shares have been trading over the past few months (Micro). Long-term charts do not get enough attention among traders and investors in our opinion. They are invaluable, however, as the more time shares of a respective underlying spend in a given area, the more significant this area then becomes.
Take Western Digital Corporation (NASDAQ:WDC) for example. Shares have been making consistent long-term lower lows since October of 2014. In saying this, WDC has managed to consistently print long-term higher highs since early 2016 which leads us to believe that we have a long-term symmetrical triangle or coil in Western Digital at present. These patterns usually play themselves out as continuation patterns which means it has bullish ramifications when we take the company’s former trend into account. Suffice it to say, WDC’s long-term chart helps us determine where long-term support, as well as resistance, currently reside. Although shares of WDC continue to trade above their 200-month average of $44.06, investors have to be open to the possibility of shares dropping down once more to test long-term support which comes in under $40 a share.
Western Digital Long-Term Chart (StockCharts.com)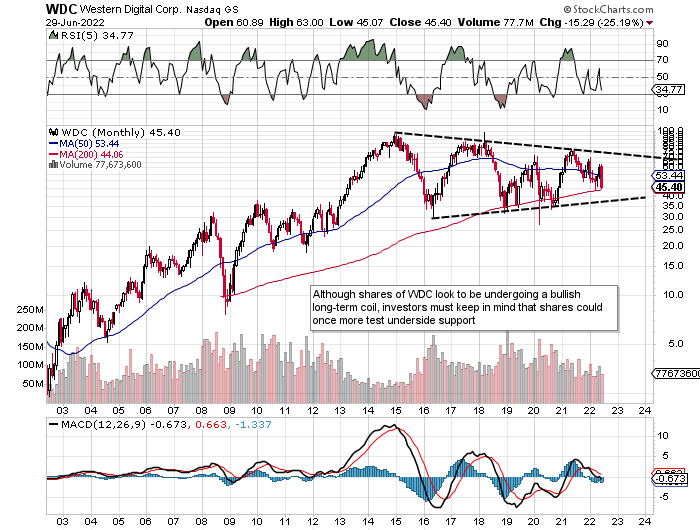
What does the above chart tell us? It tells us that a strong buying opportunity would present itself on a confirmed swing if indeed support was tested, and that long positions could indeed be increased if a breakout outside of the coil was to take place. On the short-term chart, we see that shares remain trading well under the 200-day moving average, although a short-term buy signal may be imminent through the daily MACD indicator. WDC’s 200-day moving average however remains in a downward trend, so even if we have a sharp rally in shares here over the near term, the rally may not be sustained.
Short Term Chart Of WDC (StockCharts.com)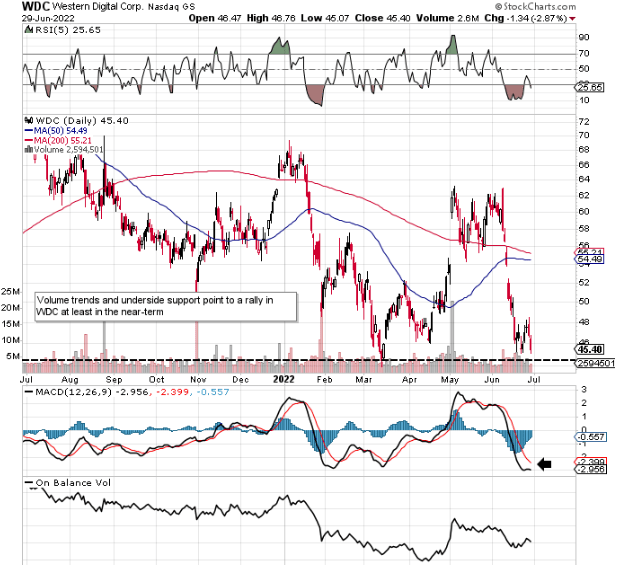
Optimum conditions for our trade setups are when we have short-term buy signals when shares are trading at multi-year support levels (What we do not have at present). However, we can get around this problem by selling out of the money put options which give us a much lower breakeven than WDC’s current prevailing share price ($44+). The August 2022 puts for example are trading for roughly $1.50 per contract which means our cost-basis would come in at $38.50 per share (what we want).
Given WDC’s current trends in its profitability as well as its valuation, buying anywhere near $38 to $39 a share is very attractive to us for the following reasons.
Valuation
Book value growth has been strong in recent years with shareholder equity almost surpassing $12 billion in the company’s most recent quarter. This trend obviously impacts the company’s debt-to-equity ratio and how Western Digital is viewed among its creditors, although debt continues to come down. Suffice it to say, although the company has added close to $2 billion in equity over the past two years or so, shares are trading at a much lower price point than they were at the end of fiscal 2019 for example. WDC’s book multiple now comes in under 1.2 whereas the company’s 5-year average is 1.7. We smell undervaluation considering the company’s bullish earnings trends.
Strong Profitability Tailwinds
When you couple the company’s valuation and tie it with how profitability has been trending, then it becomes evident that shares have limited downside here. The CEO spoke to this effect at the recent Goldman Sachs Semiconductor conference where he mentioned how the Kioxia partnership continues to thrive and how having the right people at the forefront of the HDD & Flash business units has made a meaningful impact in driving innovation at the firm. This innovation has been clearly evident in how both businesses have evolved over a period of time. The above trends are obviously showing themselves up in WDC’s profitability metrics with the company’s trailing return on equity now coming in at 16.6% and trailing returning on capital surpassing 9%. Suffice it to say, WDC compared to historic times is producing considerably more returns on the money it is spending.
Conclusion
Given Western Digital’s growth, profitability trends as well as the valuation, there is every chance shares bottom out here in the near term. Furthermore, if this pending bounce can also take out the stock’s 200-day moving average, it would be a big indicator that multi-year lows are behind us in this play. We look forward to continued coverage.
Be the first to comment