

CHUYN
Charts created by writer from C Trader.
A quick stroll around the port this morning signaled a return to tranquility for the Mediterranean and sun that’s hot, just not too hot. What appeared to be a globally shaky start to the year followed by a nice long leveling out summer, all eyes now move to the season ahead.
Certainly in Amazon’s (NASDAQ:AMZN) case it has technically printed what can be perceived as a macro bullish wave one two and with shopping season next up as the planes fly the last of the holiday makers home, a third wave should be on the cards shouldn’t it?
Since its inception in 1997, Amazon has seen just over a 16% combined average return in the last four months of the year. With September and November being particularly strong performance months in that period. However as the world faces high inflation primarily with fuel issues, one wonders will the extra zeros on the fuel bills hit a major online marketplace like Amazon.
If you haven’t read my last Amazon article, it covers the initial bearish wave before the stock split in June this year and provides all the information as to how Amazon was performing before it arrived at today’s price region.
Moving to the current macro chart below we can see a bottoming at $101 with what can be identified as a possible wave one off that low to peak at $146. A wave one or two must have a rejection candle in order to set the barrier the price must break through to move onto the next price zone.
Amazon Monthly (C Trader)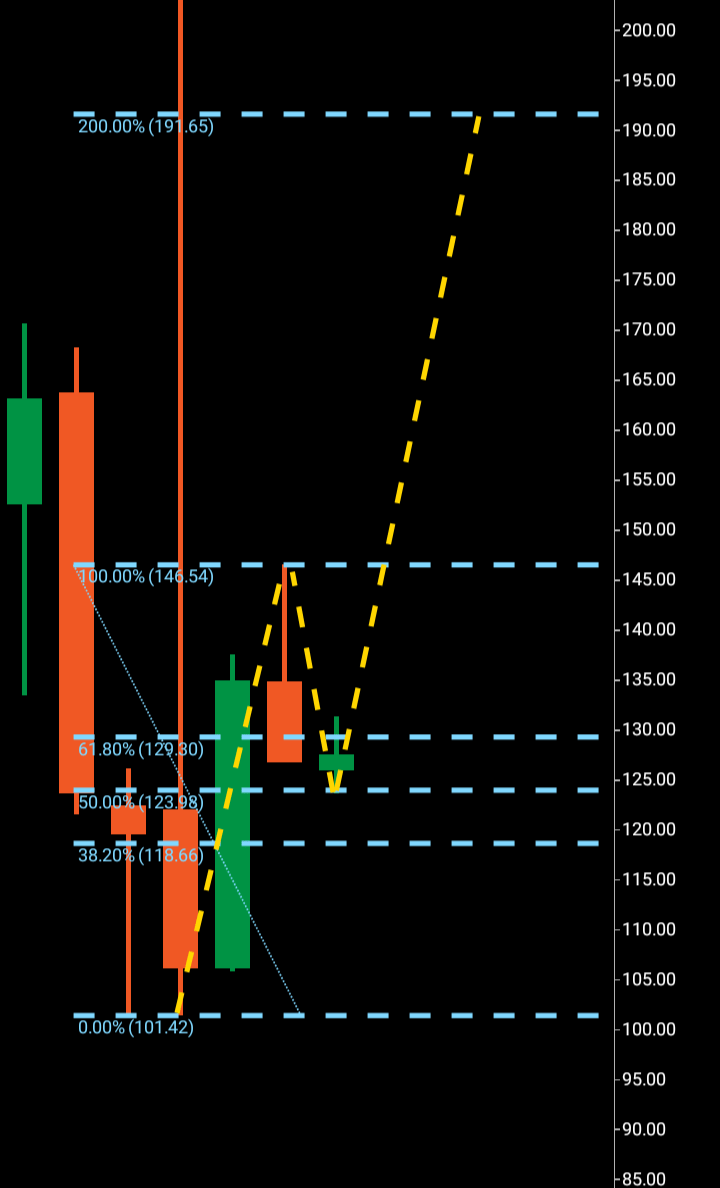
We can see the Fibonacci levels drawn out between the low and high with $123 being the Fibonacci 50% area, the price turned around exactly at that region with an attempt to form a wave two bottom to then form the wave three to carry price over the $146 region and onto target. If this is the wave two low then the latter is the only way it will be confirmed. The wave two may want to go lower but as long as price stays above $101 in this set up, we can take it as a wave two.
Amazon Monthly Fibonacci 161 (C Trader)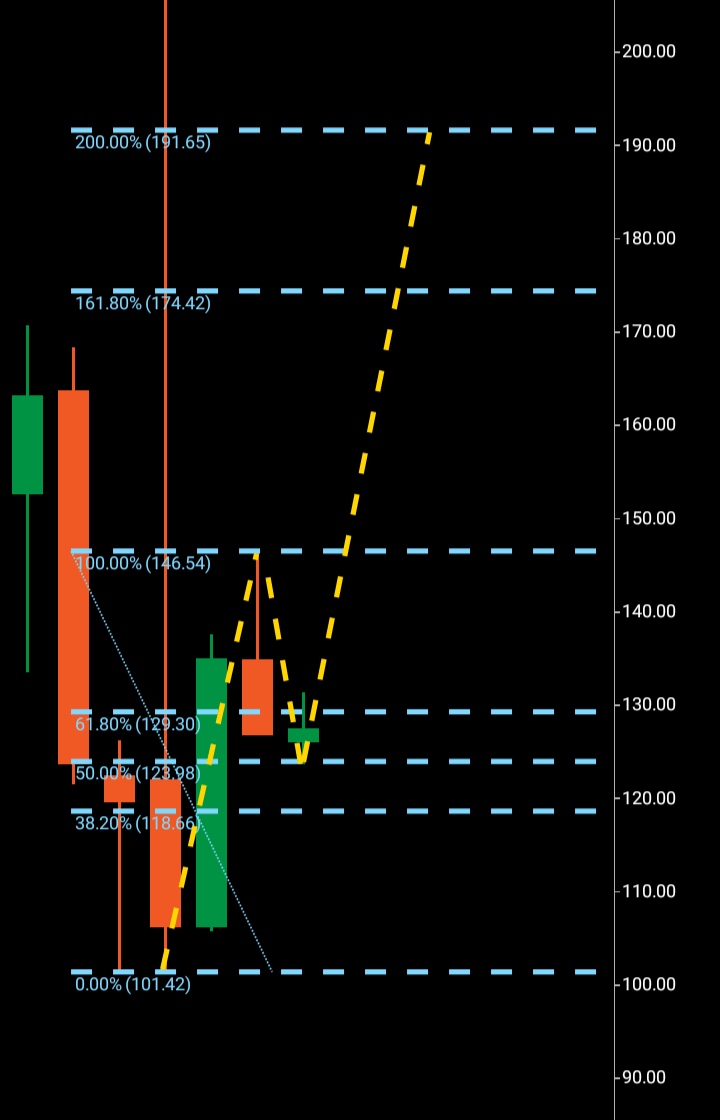
If the third wave does break out, it will be first the $174 Fibonacci 161 that would be the immediate target, this area acted as previous resistance which price failed to break through before going lower, the $191 region would be the overall target for a numerical replication of wave one.
If we move to the weekly chart below, we will look to see what is happening within the monthly set up. Although we are looking for a first third wave on the current monthly chart, it would not be the first three wave pattern on the weekly, we can see at the bottoming $101 area, a three wave pattern was technically formed between $101 – $118 – $103, with its ultimate target from $103 through resistance at $118 being $135 which it completed in very bullish fashion. We will also need to see the next wave pattern higher high on the weekly if Amazon is to break out on a monthly third wave.
Amazon weekly wave pattern (C Trader)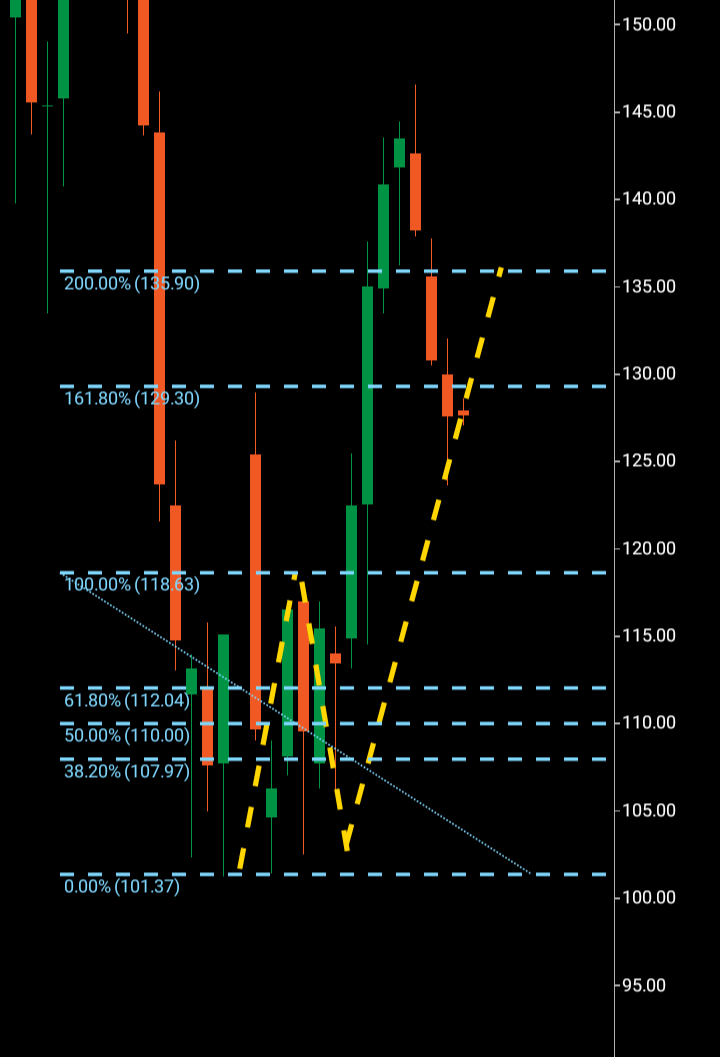
To finalize, if Amazon breaks out above the rejected $146 region, the targets have been outlined with $191 possibly being hit before the new year. The third wave may of course continue but it is only if the third wave breaks out that we can then examine the technicals of that scenario. From this point, any move below will $101 would render the third wave attempt a fail.
About the Three Wave Theory
The three wave theory was designed to be able to identify exact probable price action of a financial instrument. A financial market cannot navigate its way significantly higher or lower without making waves. Waves are essentially a mismatch between buyers and sellers and print a picture of a probable direction and target for a financial instrument. When waves one and two have been formed, it is the point of higher high/lower low that gives the technical indication of the future direction. A wave one will continue from a low to a high point before it finds significant enough rejection to then form the wave two. When a third wave breaks into a higher high/lower low the only probable numerical target bearing available on a financial chart is the equivalent of the wave one low to high point. It is highly probable that the wave three will look to numerically replicate wave one before it makes its future directional decision. It may continue past its third wave target but it is only the wave one evidence that a price was able to continue before rejection that is available to look to as a probable target for a third wave.
Be the first to comment