

Photon-Photos/iStock via Getty Images
The Q4 Earnings Season for the Gold Miners Index (GDX) is finally over, and one of the first companies to report its results (fiscal Q2 2022 for Australian producers) was Newcrest Mining (OTCPK:NCMGF). Overall, the company had a weaker quarter with lower production at Cadia, Lihir, and Red Chris. However, while some investors might be disappointed with the fiscal Q2 results, I believe it’s best to stay the course for the long-term outlook. Given the potential for steady growth at industry-leading margins, if Newcrest can execute successfully, I continue to see the stock as a solid buy-the-dip candidate.
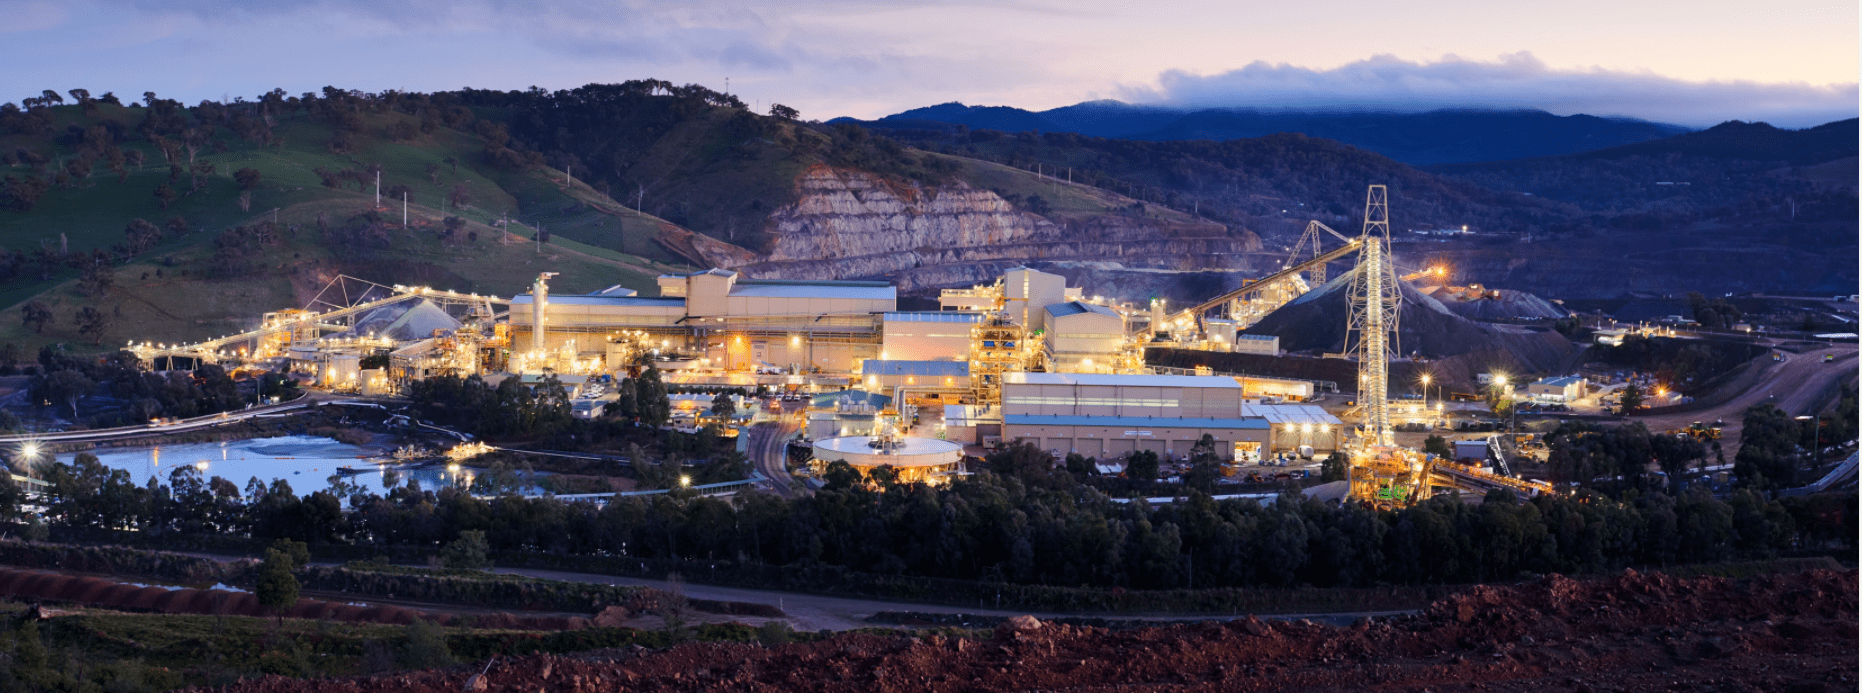
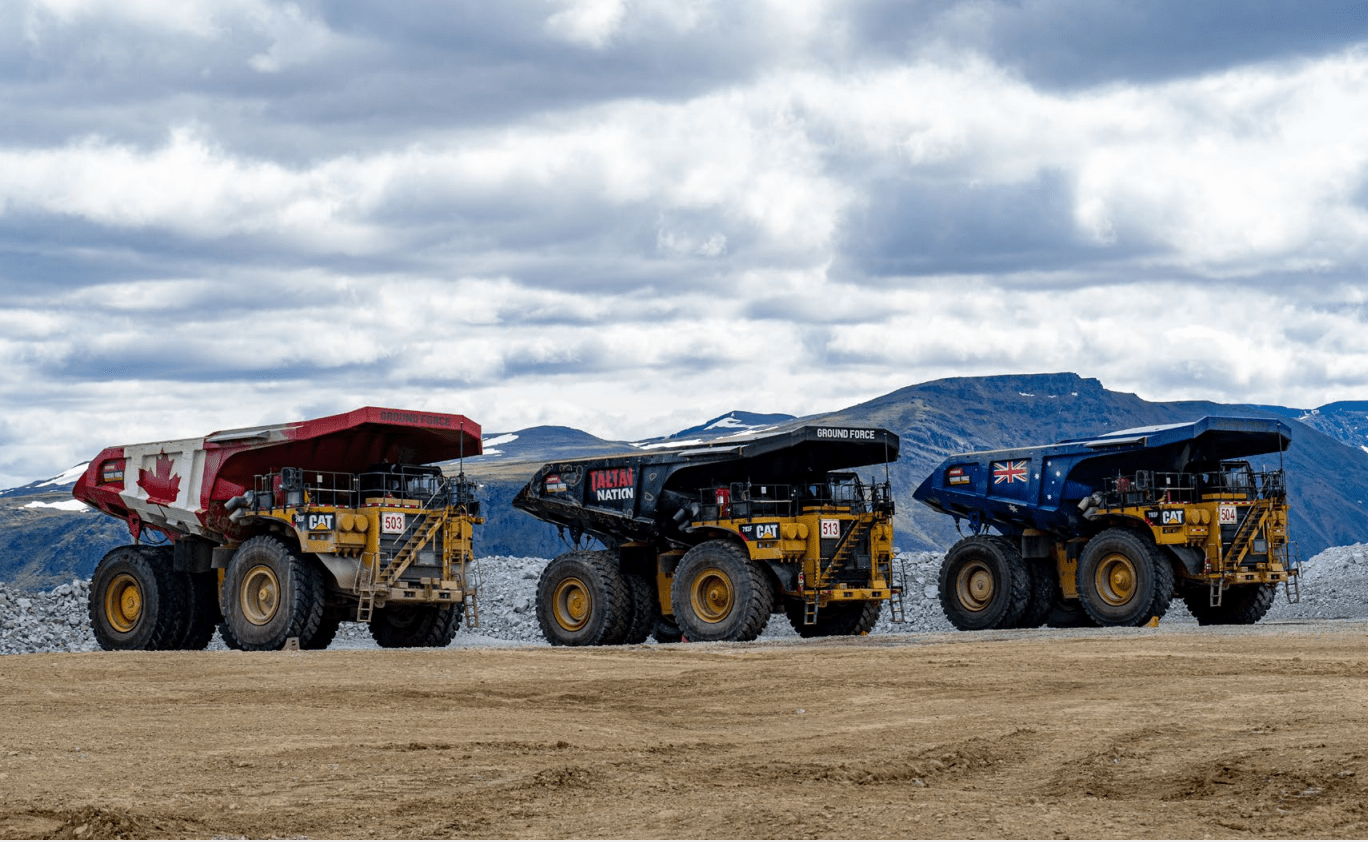
Cadia Operations (Company Website)
Newcrest released its fiscal Q2 2022 and H1 2022 results earlier this year, reporting production of ~436,100 ounces of gold and ~26,000 tonnes of copper. This represented a sharp decline on a year-over-year basis compared to the ~535,500 ounces of gold and ~34,600 tonnes of copper produced in fiscal Q2 2021 (December quarter). The lower production in the period was broad-based, with nearly every operation seeing lower production except for two smaller contributors (Telfer and Fruta Del Norte). Let’s take a closer look at the quarter below:
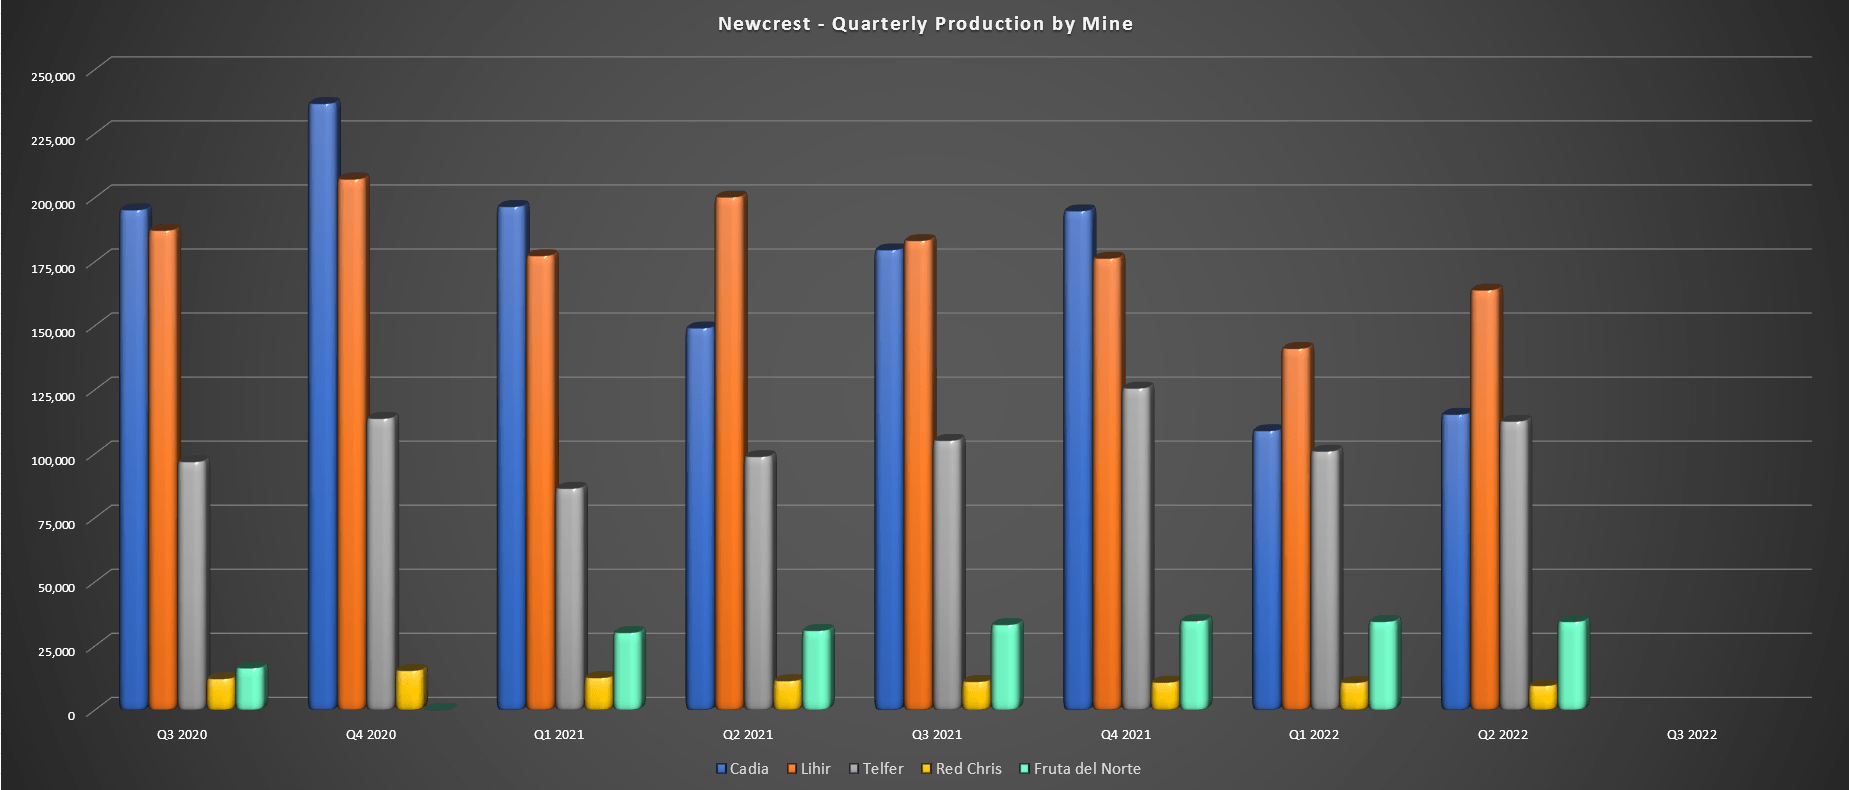
Newcrest – Quarterly Gold Production by Mine (Company Filings, Author’s Chart)
As shown in the chart above, Newcrest had a softer quarter in fiscal Q2 2022, with its massive Cadia Mine contributing just ~115,400 ounces of gold, down from ~194,100 ounces in the year-ago period. However, this was largely related to work to complete the replacement and upgrade of the SAG mill motor, and the SAG mill was able to return to full capacity in December 2021. Meanwhile, Newcrest also completed the remediation of Panel Cave 2 East in the period, which allowed the mine to ramp back up to full production.
Despite the significantly lower production, Cadia had another incredible quarter from a cost standpoint, and all-in sustaining costs [AISC] were actually lower on a year-over-year basis. This was helped by higher copper prices in the period, with the copper price averaging $4.30/lb vs. $3.20/lb in the year-ago period. For those unfamiliar, Cadia is a major producer of copper, and while copper production was down vs. the year-ago period, the asset still produced just over 18,000 tonnes in fiscal Q2.
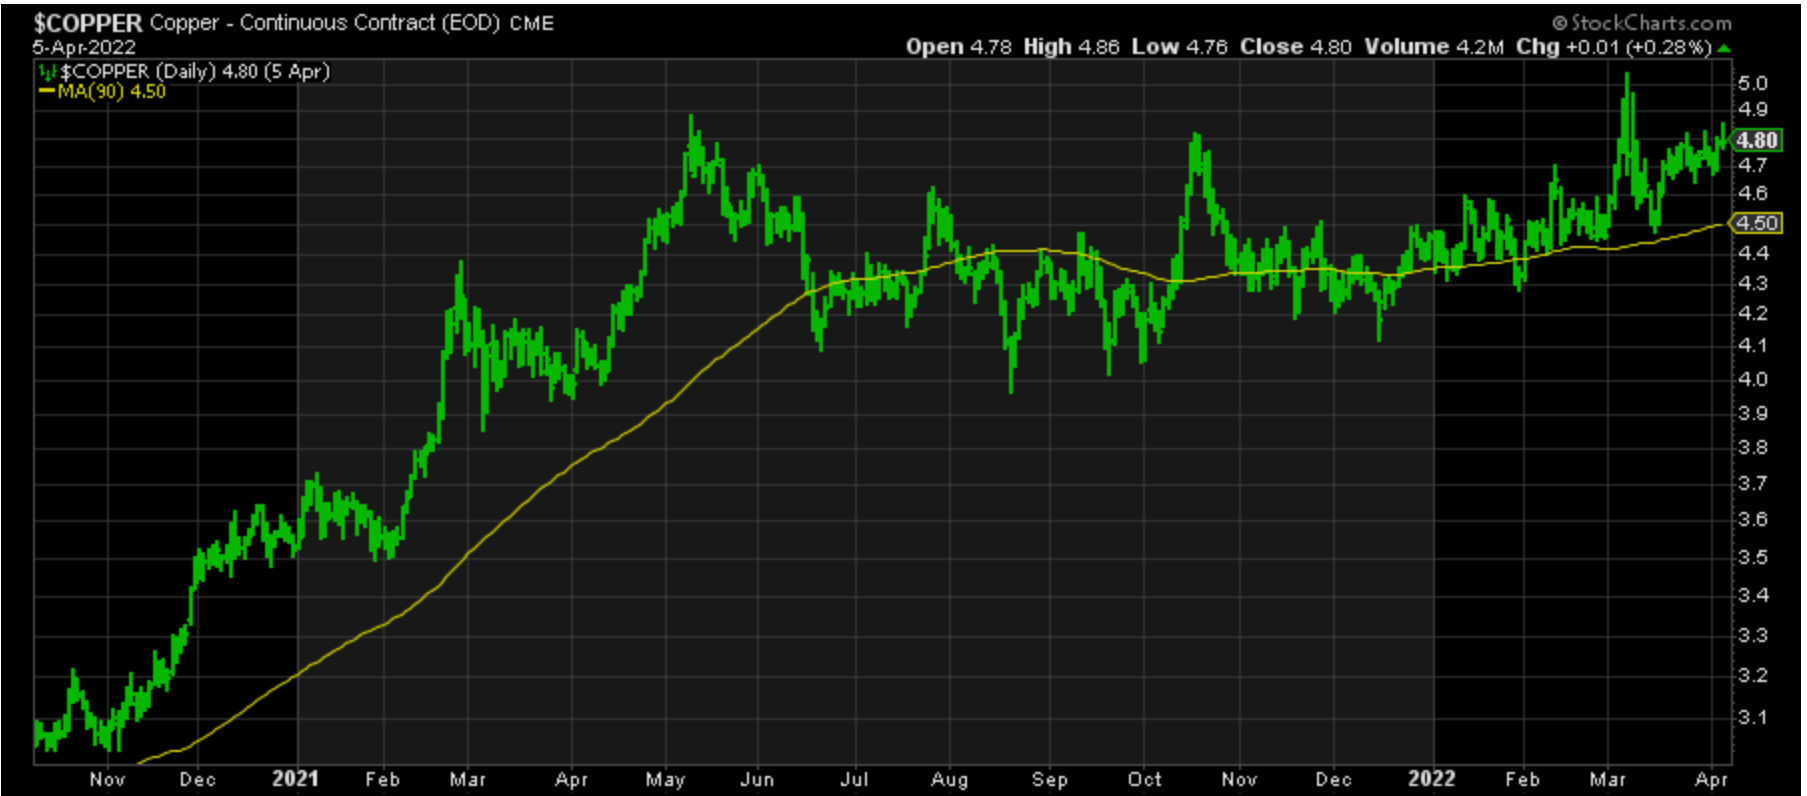
Copper Price (StockCharts.com)
Moving over to Lihir, the operation also had a softer quarter in fiscal Q2, with gold production of just ~164,000 ounces, down from more than 200,000 ounces in fiscal Q1 2021. This was related to lower head grades and fewer tonnes processed, with Lihir’s head grade coming in at just 2.17 grams per tonne gold (Q1 2021: 2.27 grams per tonne gold), related to a higher contribution from lower grade stockpiles. The increased reliance on stockpiles was due to limited access to higher-grade ore from Phase 14 due to heavy rainfall, while the company also encountered lower grades from Phase 15 at the upper edges of the ore body.
The good news is that the impact of rain events will be less significant going forward with the implementation of additional pumping capacity, and the asset should benefit from better grades and production in H2. This is based on a higher proportion of feed from increased mining rates at Phase 14 and lower plant maintenance. As it stands, Lihir is sitting nowhere near FY2022 guidance of ~750,000 ounces with just ~305,000 ounces produced. However, Newcrest noted that it is confident that the asset will come in within the low end of the guidance range despite the slow start to the year.
Red Chris Mine (Company Presentation)
Finally, at Red Chris and Telfer, combined gold production came in at ~122,000 ounces of gold vs. ~110,000 ounces in the same period last year. Telfer managed to pick up the slack for Red Chris, which saw lower production due to lower gold and copper grades in the period. While Red Chris may not be a large contributor currently, nor is Telfer, these two assets will see significant production growth medium-term. This is based on the high-grade Havieron Project, which will utilize Telfer’s existing processing infrastructure and the robust Block Cave Feasibility plans at Red Chris.
In the case of Havieron, the project is expected to see average production of ~160,000 ounces per annum at industry-leading costs of less than $800/oz, a major improvement from costs of $1,300/oz plus at Telfer. Meanwhile, the Red Chris Block Cave Pre-Feasibility study suggests the potential for a 30+ year mine life with an average production profile of ~320,000 ounces of gold and ~80,000 tonnes of copper per annum in FY2029-FY2034. While investors have to wait several years to see the bulk of this growth, this is a world-class project and makes Newcrest look very wise for scooping up its 70% stake in this asset at much lower copper prices in 2019.
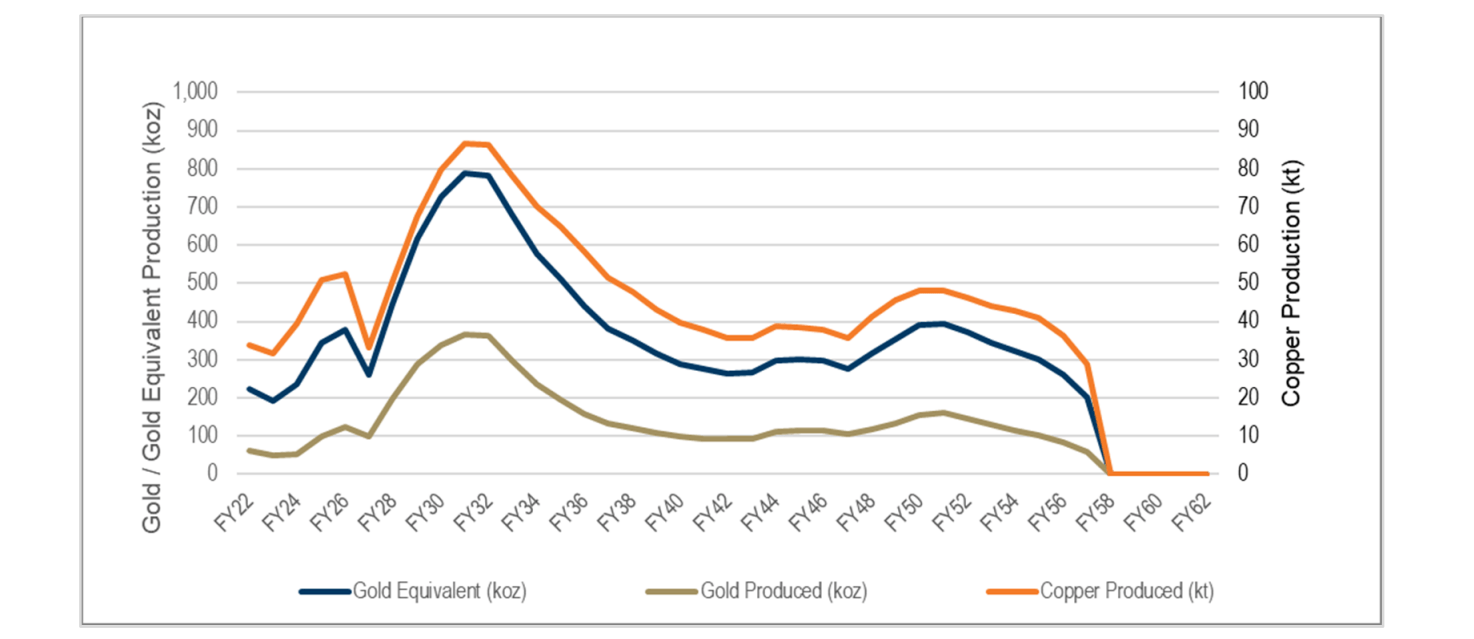
Red Chris – Gold-Equivalent Production Profile (Company News Release)
Looking at the production profile above, it’s worth noting that while production will peak post-2030, production will trend higher while investors wait for the sweet spot of this growth with significantly higher gold/copper grades in FY2028 to FY2033. So, while Red Chris is only expected to contribute ~40,000 ounces of gold this year (Newcrest’s smallest gold operation) and ~24,000 tonnes of copper, the operation’s copper production will more than triple from FY2022 levels in FY2029 to FY2034, making this one of the lowest-cost mines globally. In fact, Red Chris’ life of mine all-in sustaining costs are estimated to come in below $100/oz even after accounting for inflationary pressures and assuming conservative copper prices ($3.20/lb).
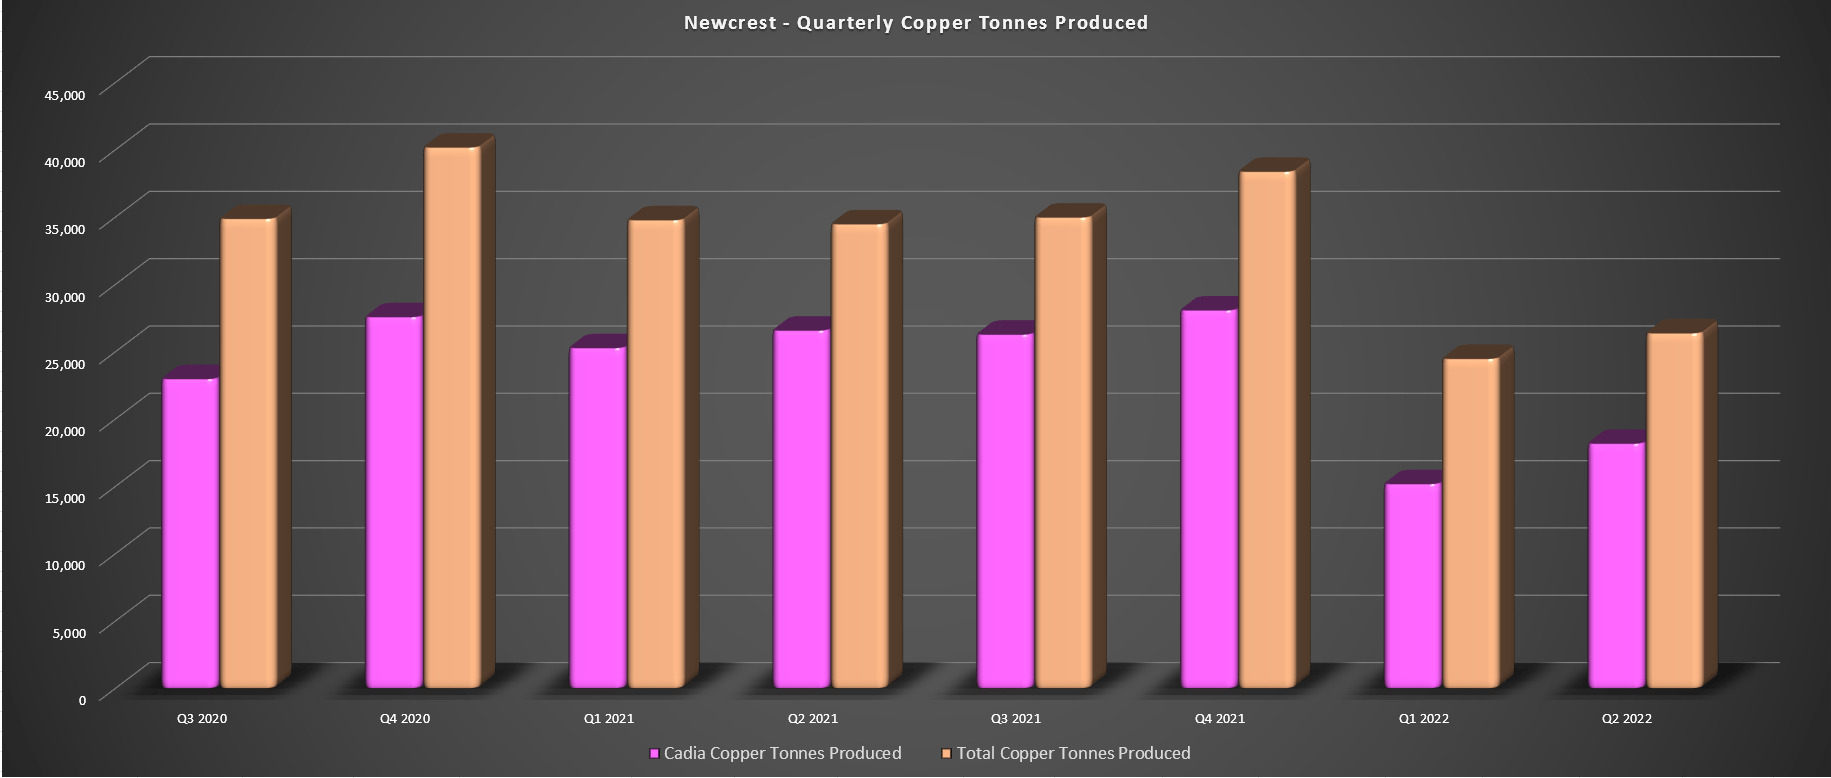
Newcrest – Quarterly Copper Tonnes Produced (Company Filings, Author’s Chart)
As it stands, Newcrest already benefits from industry-leading all-in sustaining costs at Cadia, which helps to pull down the company’s consolidated cost profile. However, with the potential for another operation with sub $200/oz due to by-product credits, Newcrest will have a clear path to being one of the sector’s lowest-cost gold producers later this decade. If we combine this with improved costs with higher-grade feed from Havieron at a modified Telfer processing plant, I expect Newcrest to look like a completely different company post-2025.
Financial Results & Margins
Moving over to Newcrest’s financial results, it’s understandable that investors might be disappointed with the numbers, given that H1 2022 revenue declined sharply on a year-over-year basis to just ~$1.72 billion. However, this was partially lapping difficult year-over-year comps with record gold prices in the previous period (July to December 2020) and also lapped much higher metal production/sales. The good news is that gold and copper prices have improved substantially thus far in H2 2022 (January through March).
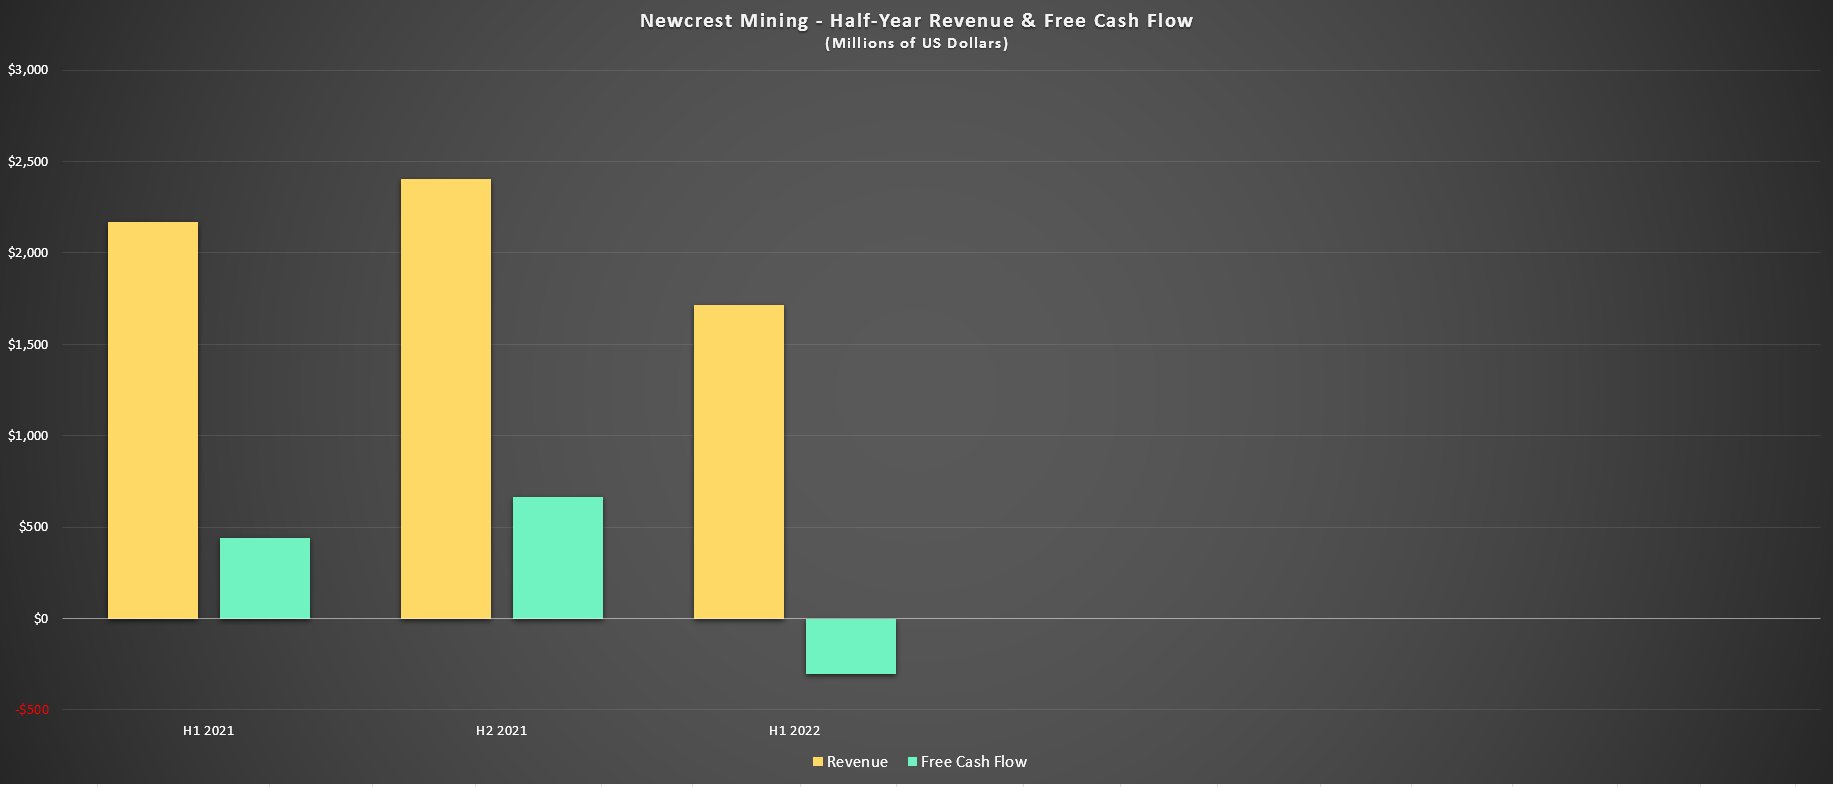
Newcrest – Half Year Revenue & Free Cash Flow (Company Filings, Author’s Chart)
This means that Newcrest will switch from being up against tough year-over-year comps in the prior period to easy comps, and this will occur at the same time as the company enjoys much higher production in H2 2022 at legacy assets. Meanwhile, the company will also see just over three months of contribution from its newly acquired Brucejack Mine, which should boost production by more than 80,000 ounces. The addition of Brucejack combined with higher gold prices and a stronger H2 from Cadia should lead to improved margins and revenue in the back half of the year.
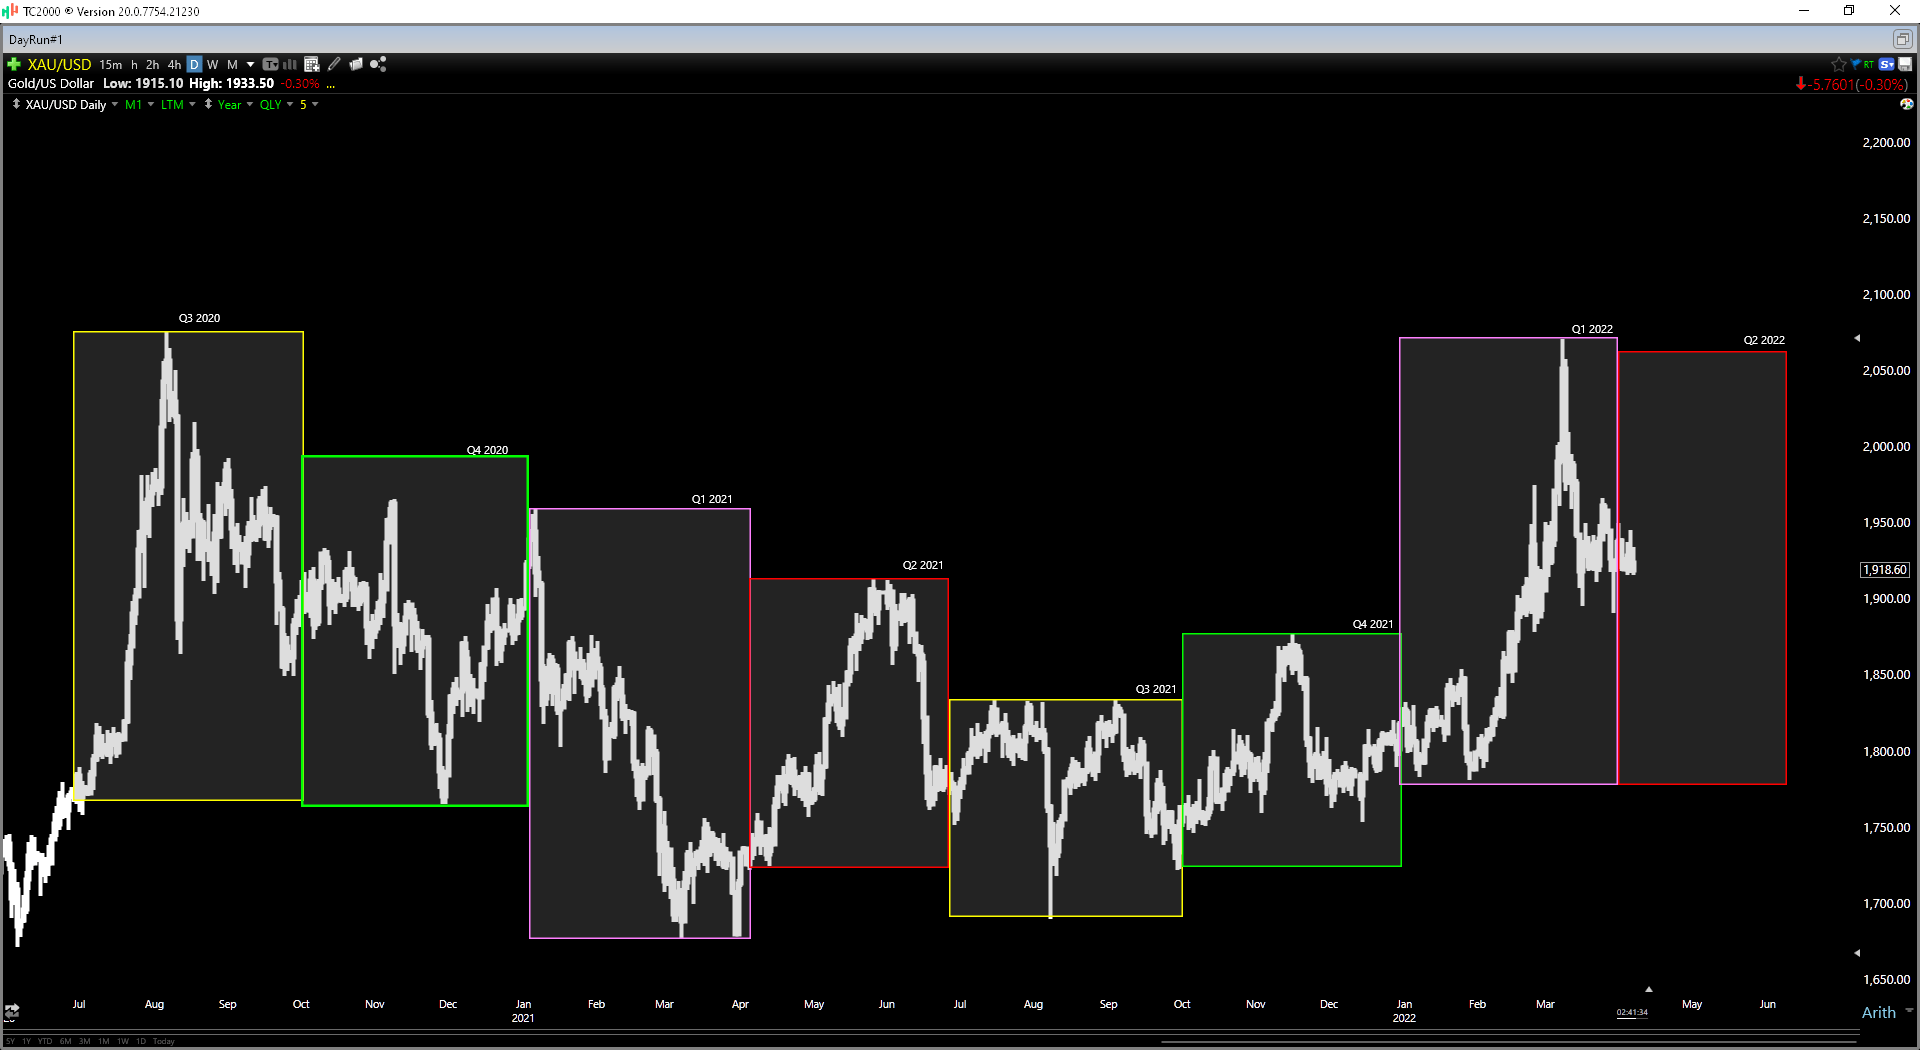
Gold Futures Price (TC2000.com)
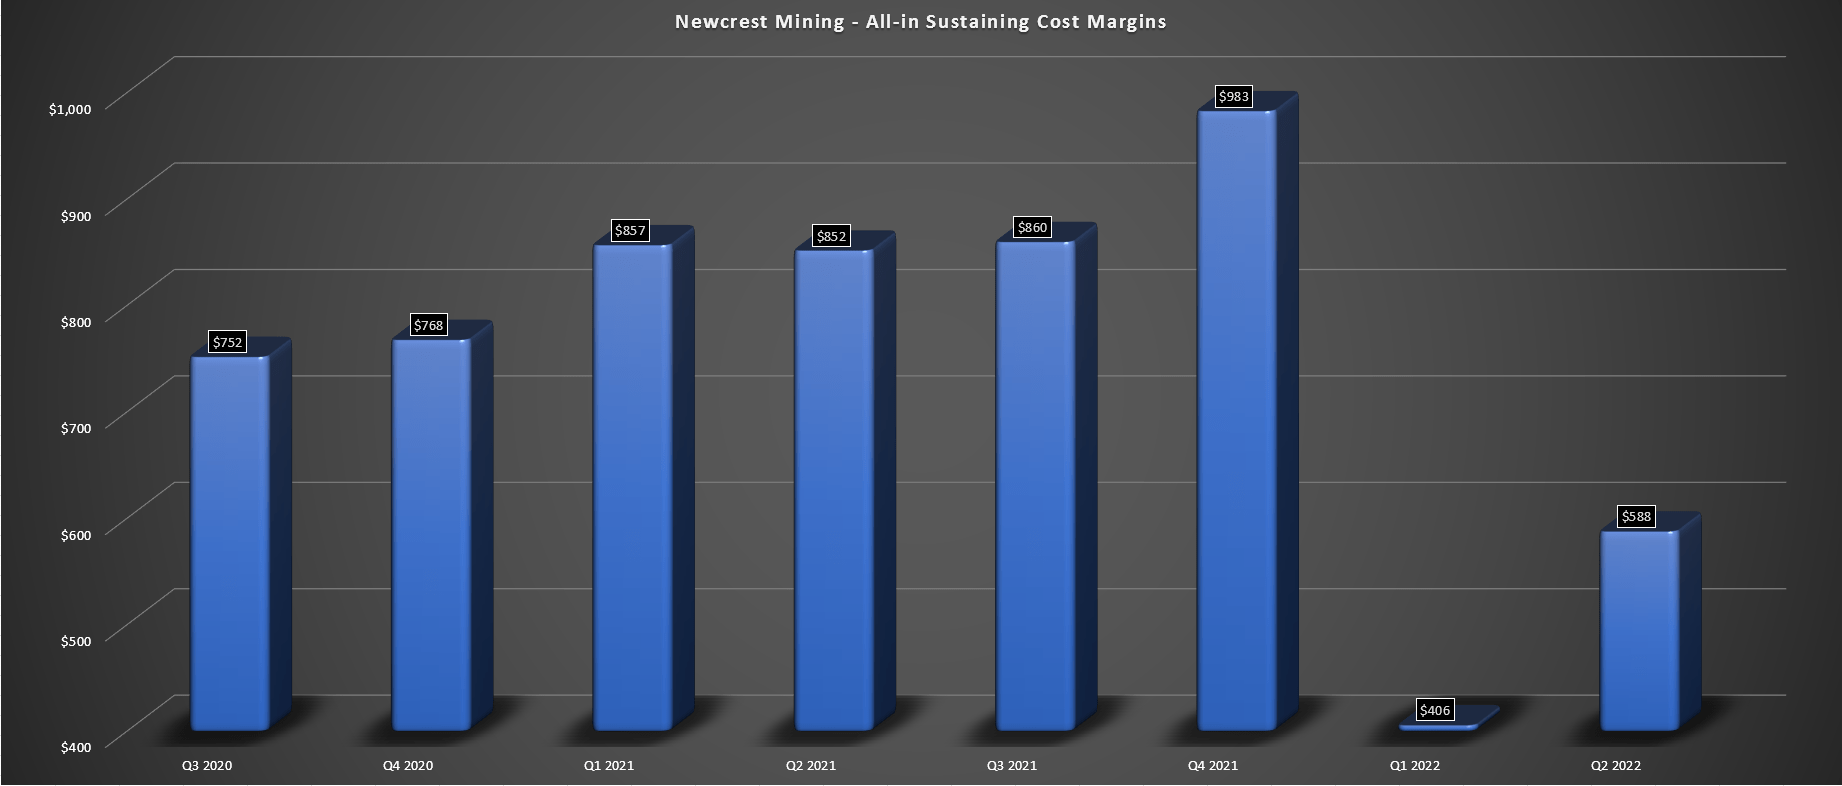
Newcrest – AISC Margins (Company Filings, Author’s Chart)
Long-Term Outlook
As noted above, Newcrest saw much weaker financial results on a year-over-year basis in H1 2022, but as the chart below shows, Newcrest has just picked one of the top-20 highest-grade gold mines globally. The bonus is that this mine is in a safe jurisdiction. Notably, Newcrest is confident that it can optimize the operation, and it is just coming off a major discovery at the newly uncovered Golden Marmot Zone before the acquisition. With the possibility of another major high-grade discovery, we could see costs at Brucejack dip below $800/oz by mid-decade, making this yet another operation with industry-leading costs.
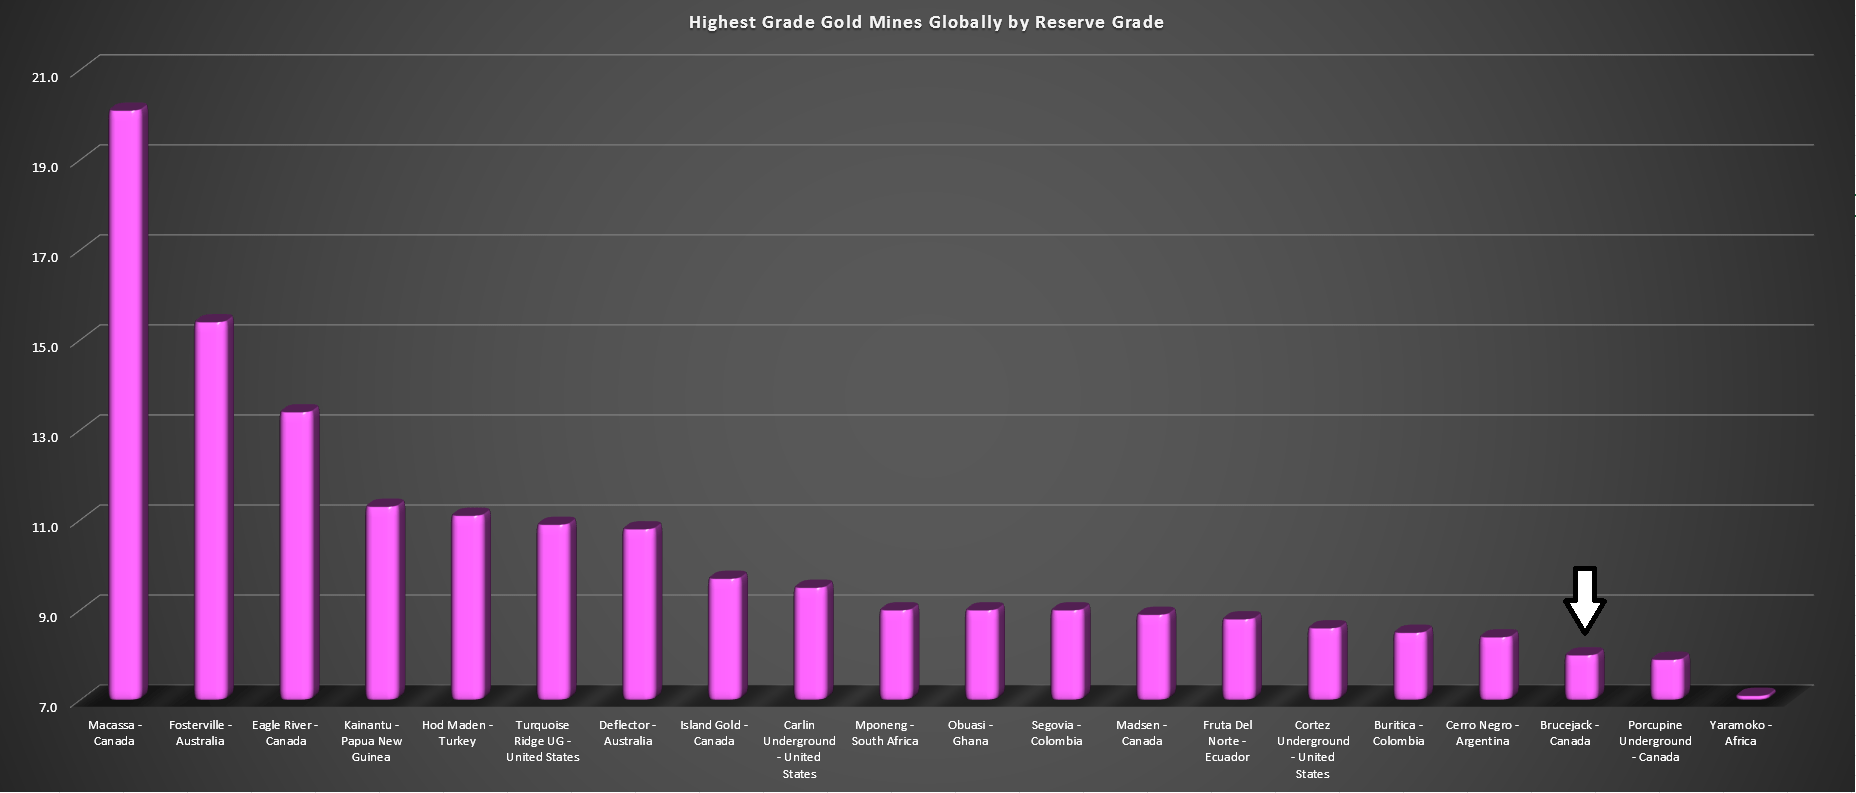
Highest-Grade Gold Mines by Reserve Grade (Company Filings, Author’s Chart)
If we look at the rest of Newcrest’s portfolio, the company appears confident that it can pull costs down below $700/oz by FY2025 and below $650/oz by FY2028. Comparing this to Newcrest’s current cost profile of ~$1,100/oz, this would translate to a more than 50% increase in margins in FY2028, and that assumes the gold price remains at $1,900/oz. This is because the company’s AISC margins at a $1,900/oz gold price would soar from $800/oz to $1,250/oz. I would expect this to earn the company a premium multiple relative to peers like Barrick Gold (GOLD) and Newmont (NEM), who also have copper exposure, but have operating costs closer to $1,000/oz.
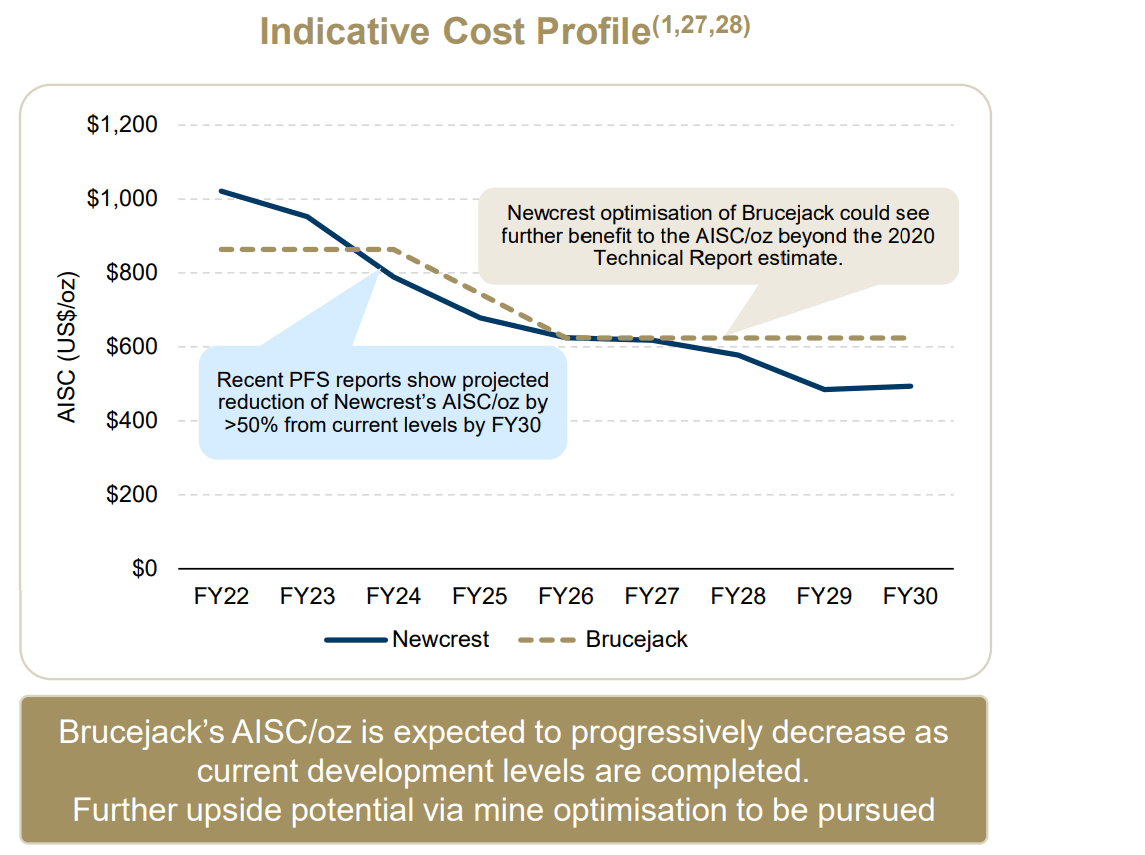
Newcrest – Declining Cost Profile (Company Presentation)
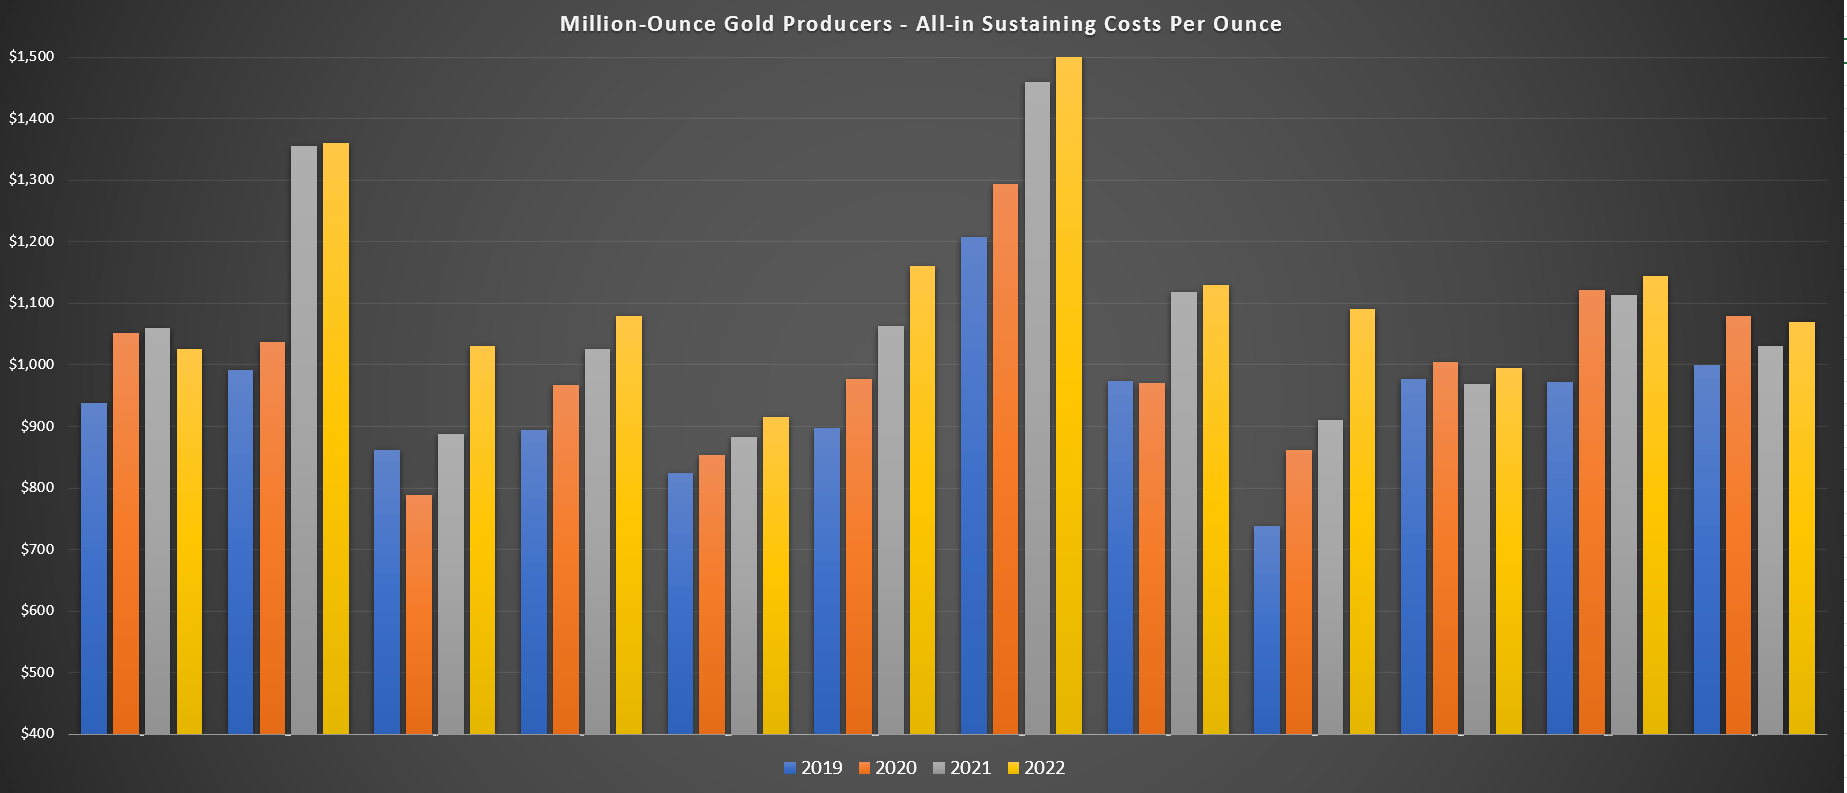
Million-Ounce Gold Producers – Cost Progression (2019-2022) (Company Filings, Author’s Chart)
The above projections will not be an easy task, with Newcrest guiding for the possibility of sub $650/oz AISC by 2028. However, even if Newcrest misses this target and comes in at $700/oz – $750/oz, it would still be the lowest-cost million-ounce producer by a wide margin, with the average million-ounce producer having costs closer to $1,025/oz (chart above). So, if Newcrest can deliver on these plans, this will be a completely different company seven years from now that will justify a premium multiple relative to nearly all of its peers. Let’s take a look at the technical picture below:
Technical Picture
As the chart below shows, Newcrest has rallied sharply off its January lows after a brief breakdown below key support at US$15.90. This has left the stock in the upper portion of its expected trading range, with the reward/risk ratio now coming in at 0.42 to 1.0 vs. a previous reward/risk ratio near 4.0 to 1.0 near US$16.50. Obviously, if gold and copper prices remain strong, Newcrest could continue to trend higher, but I generally prefer at least a 3.5 to 1.0 reward/risk ratio when entering new positions in large-cap producers, and this is no longer the case. Hence, I see the stock as a Hold vs. a Buy at US$16.75, which I highlighted in my most recent update.
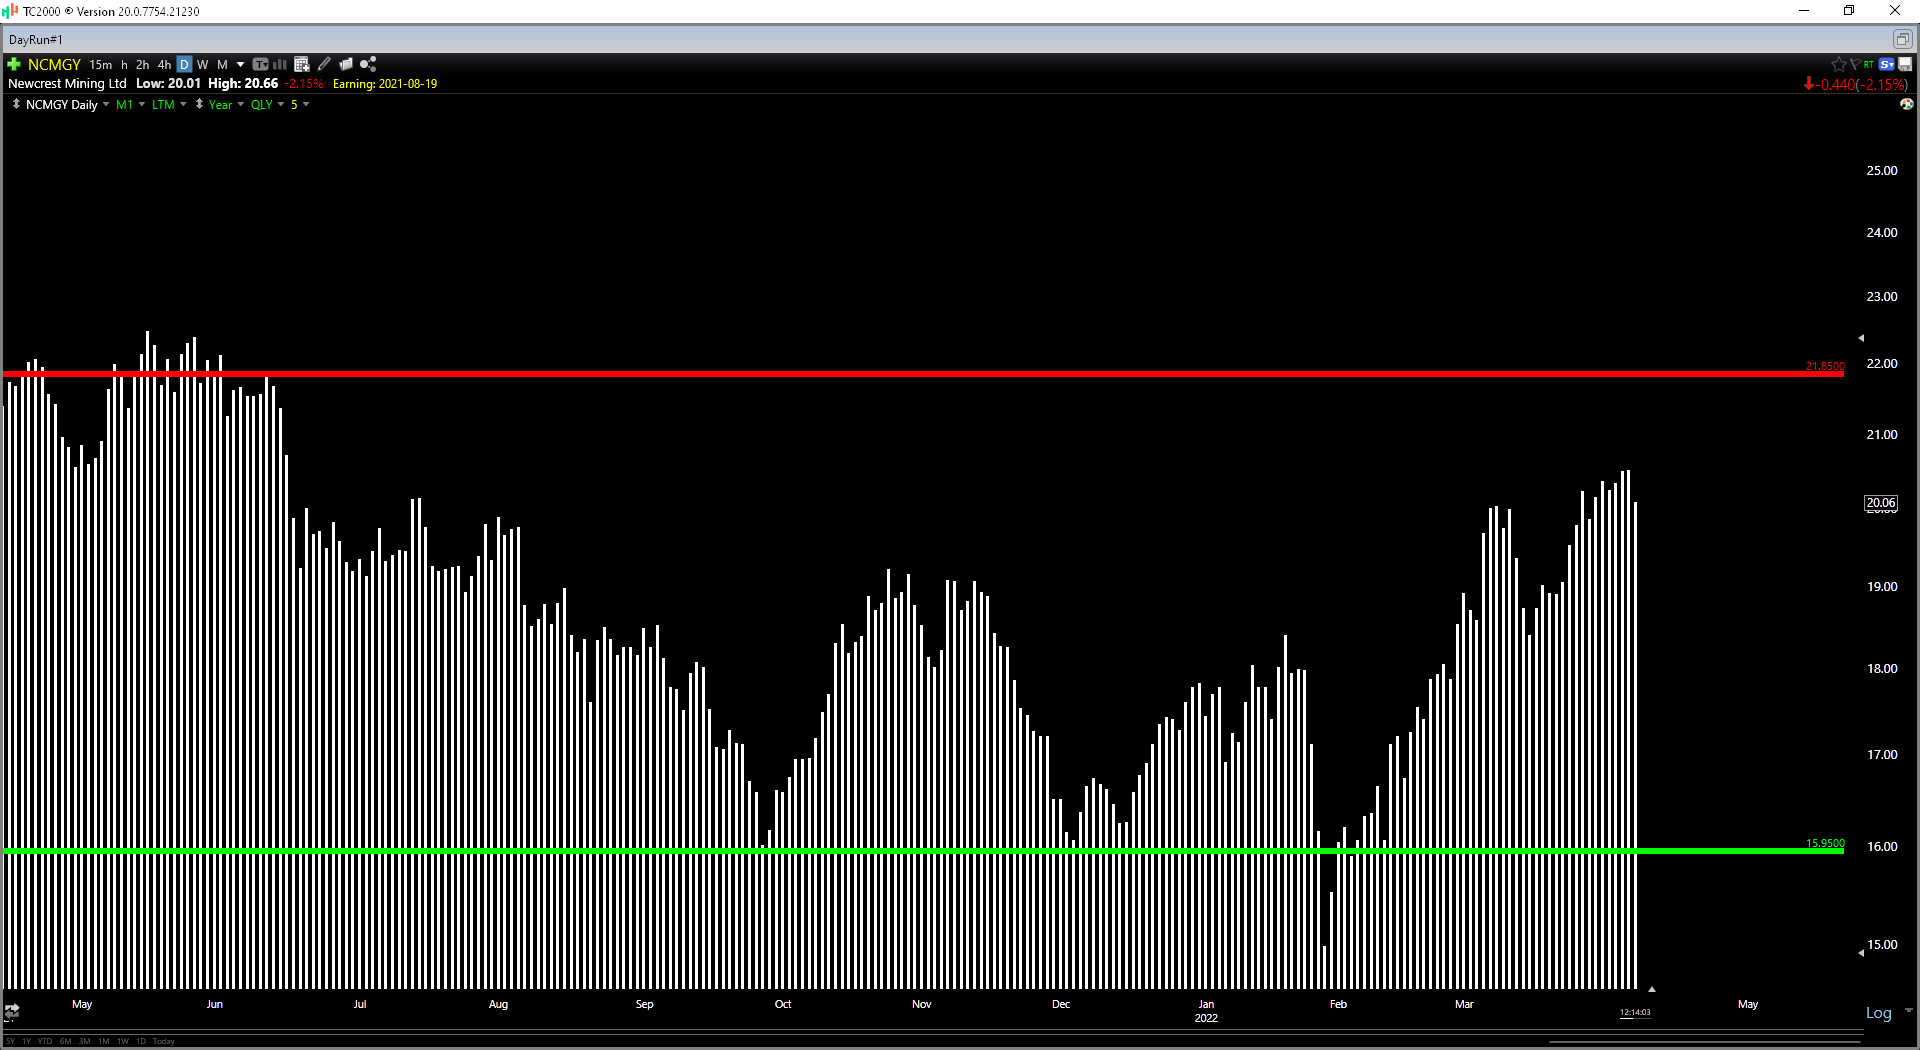
NCMGY Technical Picture (TC2000.com)
Newcrest had a softer fiscal H1 2022 from a free cash flow standpoint, with lower production and much higher costs vs. H1 2021. However, with Brucejack added into the mix beginning in late fiscal Q3 2022 and a stronger second half for Cadia and Lihir, I would expect to see a meaningful improvement in free cash flow in the second half. Meanwhile, if the company can execute on its goals, it is set to be a free-cash-flow machine in FY2026, given its much higher margins and declining capex at Red Chris Block Cave. Based on this favorable long-term outlook, I see Newcrest as a solid buy-the-dip candidate, and I would view pullbacks below US$17.35 as buying opportunities.
Be the first to comment