

hapabapa/iStock Editorial via Getty Images
Introduction
My last coverage of Paychex (NASDAQ:PAYX) stock was back on April 6th of this year when I warned investors about Paychex’s overvaluation in my article “Paychex Stock: A Classic Sentiment Cycle Pattern“. Here is my conclusion to the article:
Paychex is a great and steadily growing business just as it has been for years. But sometimes the sentiment simply gets too high given the likely future returns an investor will ultimately receive. Every business has some price that’s too high to pay, and I think Paychex is at that level now. With the Federal Reserve rapidly raising rates and government stimulus likely finished for the next three years, the odds of an economic slowdown by 2023 and a corresponding bear market are higher than average. That means that within the next couple of years, it’s likely Paychex stock will trade at a more reasonable price. I have the fair value range for Paychex at about $72 to $95 per share, and for value investors who would like a margin of safety like myself, my current buy price for the stock is $63.70, and at that point, I would likely be a buyer myself. I think there is an above-average chance it trades down to that fair value range within the next two years. It will probably take a full recession and bear market for it to hit my buy price, and the chances of that happening are lower, but still in the realm of possibility.
Since that article, just three short months ago, here is how Paychex stock has performed:
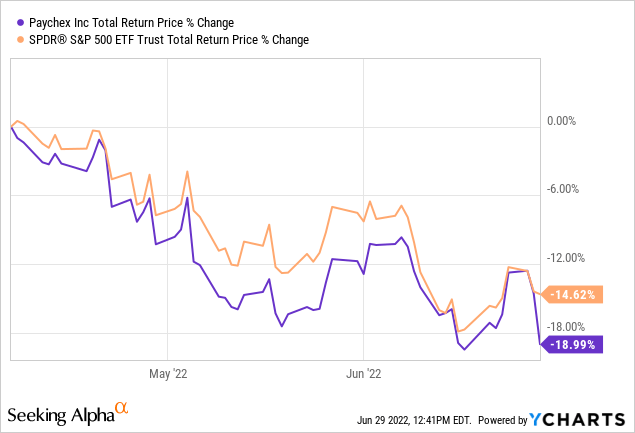
Paychex stock is down about -19% compared to -15% for the S&P 500 over the same time period. Now that the price has fallen a little bit, and they have recently reported earnings, it seems like a good time to check to see what Paychex’s valuation implies about its future returns for shareholders.
How Cyclical is Paychex?
In this article, I’m going to perform a very similar analysis as the one I performed on Paychex in the past in order to see where Paychex’s valuation stands today and what sort of future returns we might expect if Paychex’s long-term earnings trend stays intact. As part of the analysis, I calculate what I consider to be the two main drivers of future total returns: Market sentiment returns and business returns. I then combine those expected returns together in the form of a 10-year CAGR expectation and use that to value the stock.
Before I begin this analysis, I always check the business’ long-term earnings patterns in order to ensure that the business is a proper fit for this sort of analysis. If the historical earnings 1) don’t have a long enough history 2) are erratic in nature, or 3) are too cyclical, then I either avoid analyzing the stock altogether or I use a different type of analysis that is more appropriate.
FAST Graphs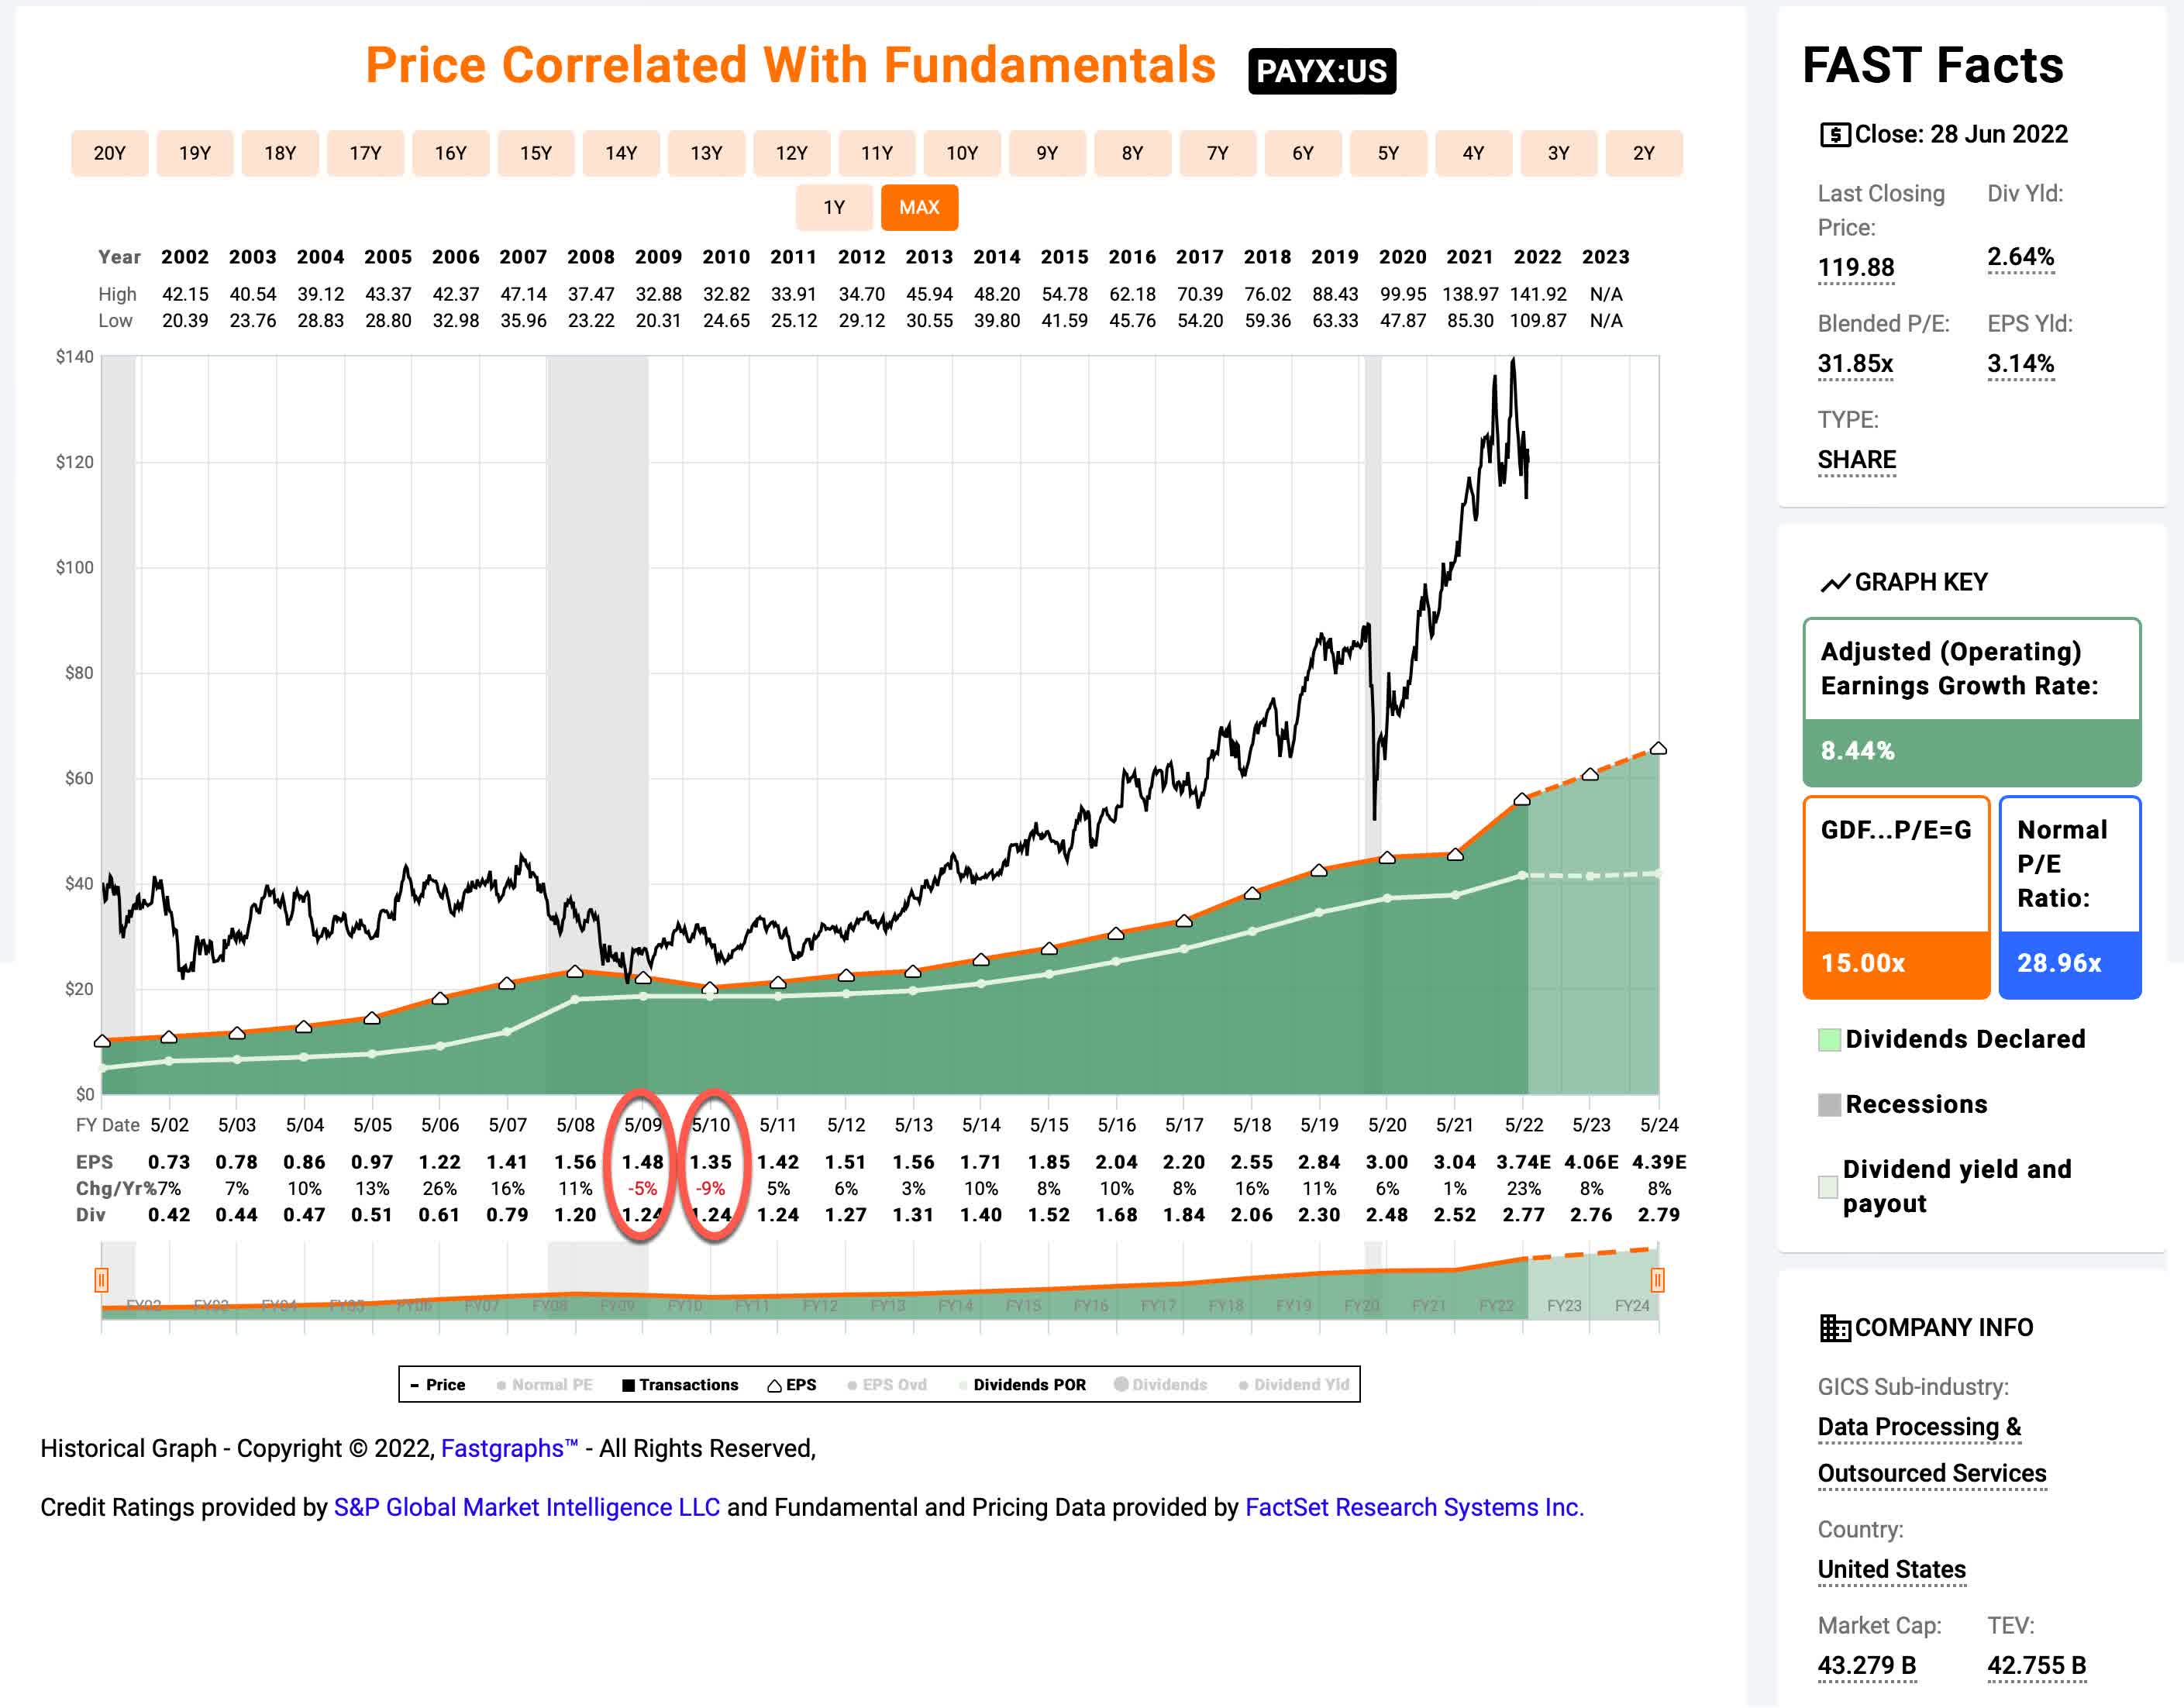
We have a full 20-year earnings history on FAST Graphs for Paychex, so there’s plenty of data. Earnings have been remarkably steady, which makes them relatively predictable. And earnings have only had two years of very modest declines during the Great Recession in 2009/10, so they aren’t very cyclical. Taking all this into account, Paychex meets all of the basic requirements for the Full-Cycle Analysis I’m about to share.
It’s worth noting that Paychex is a remarkably easy stock to analyze using a combination of price-to-earnings and earnings growth. If a person was a new investor just learning about how to value stocks, Paychex would be a great place to start. A simple PEG ratio would do the trick during all the periods that weren’t during recessions and the PEG ratio would do a pretty good job predicting future long-term returns.
Market Sentiment Return Expectations
In order to estimate what sort of returns we might expect over the next 10 years, let’s begin by examining what return we could expect 10 years from now if the P/E multiple were to revert to its mean from the previous economic cycle. Since we have had a recent recession (albeit an unusual one) I’m starting this cycle in fiscal year 2015 and running it through 2023’s estimates.
FAST Graphs
One of the changes in this analysis from the one I shared three months ago is that in my April analysis I was using 2022’s forward earnings, but now that we are into a new fiscal year for Paychex, I’m using 2023’s forward expected earnings from analysts, which are expected to grow about 8%. (Management recently guided 9%-10% growth for 2023, so analysts are slightly more conservative but very much in the same ballpark.)
Paychex’s average P/E from 2015 to the present has been 27.62 (the blue bar circled in gold on the FAST Graph). Using 2023’s forward earnings estimates of $4.06 (also circled in gold), Paychex has a current P/E of 28.16. If that 28.16 P/E were to revert to the average P/E of 27.62 over the course of the next 10 years and everything else was held the same, Paychex’s price would fall and it would produce a 10-Year CAGR of about -0.17%. That’s the annual return we can expect from sentiment mean reversion if it takes ten years to revert. If it takes less time to revert, the losses could be quicker and steeper (as they were in 2020).
Business Earnings Expectations
We previously examined what would happen if market sentiment reverted to the mean. This is entirely determined by the mood of the market and is quite often disconnected, or only loosely connected, to the performance of the actual business. In this section, I will examine the actual earnings of the business. The goal here is simple: We want to know how much money we would earn (expressed in the form of a CAGR %) over the course of 10 years if we bought the business at today’s prices and kept all of the earnings for ourselves.
There are two main components of this: The first is the earnings yield and the second is the rate at which the earnings can be expected to grow. Let’s start with the earnings yield (which is an inverted P/E ratio, so, the Earnings/Price ratio). The current earnings yield is about +3.56%. The way I like to think about this is, if I bought the company’s whole business right now for $100, I would earn $3.56 per year on my investment if earnings remained the same for the next 10 years.
The next step is to estimate the company’s earnings growth during this time period. I do that by figuring out at what rate earnings grew during the last cycle and applying that rate to the next 10 years. This involves calculating the EPS growth rate since 2015, taking into account each year’s EPS growth or decline, and then backing out any share buybacks that occurred over that time period (because reducing shares will increase the EPS due to fewer shares).
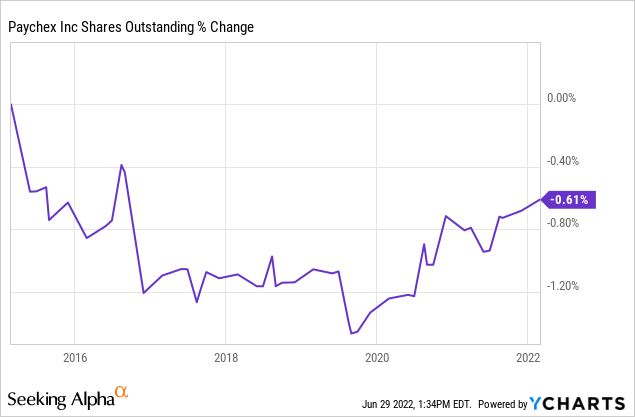
Paychex hasn’t really bought back any stock over this time period so no adjustments need to be made here. I will factor in their slow 1% earnings growth in 2021, though. After doing that, I calculate an annual earnings growth rate of about +9.96%. (Which is nearly identical to FAST Graph’s +9.87% number, and right in line with management’s expectation as well.)
Next, I’ll apply that growth rate to current earnings, looking forward 10 years in order to get a final 10-year CAGR estimate. The way I think about this is, if I bought Paychex’s whole business for $100, it would pay me back $3.56 plus +9.96% growth the first year, and that amount would grow at +9.96% per year for 10 years after that. I want to know how much money I would have in total at the end of 10 years on my $100 investment, which I calculate to be about $163.20 (including the original $100). When I plug that growth into a CAGR calculator, that translates to a +5.02% 10-year CAGR estimate for the expected business earnings returns.
10-Year, Full-Cycle CAGR Estimate
Potential future returns can come from two main places: Market sentiment returns or business earnings returns. If we assume that market sentiment reverts to the mean from the last cycle over the next 10 years for Paychex, it will produce a -0.17% CAGR. If the earnings yield and growth are similar to the last cycle, the company should produce somewhere around a +5.02% 10-year CAGR. If we put the two together, we get an expected 10-year, full-cycle CAGR of +4.85% at today’s price.
My Buy/Sell/Hold range for this category of stocks is: Above a 12% CAGR is a Buy, below a 4% expected CAGR is a Sell, and in between 4% and 12% is a Hold. This makes Paychex right on the edge of a sell and a hold. In order to decide how to treat the stock, I think it’s useful to zoom out to the macro in borderline cases such as this and gain some perspective.
The Bear Market Has Started, and Recession Is Near
Whether we are likely to experience a deep bear market and/or a recession is important in this case because, during the last recession in 2008 and 2009, Paychex experienced negative earnings growth for two years in a row. If that happens, then the valuation we just performed is likely to be using optimistic earnings expectations for the next year or two, and if they were adjusted for what is likely to happen during a recession, then it would tip the 10-year CAGR expectation well below the 4% threshold I use for a “sell” rating.
At the macro level, as I’ve written about many times this year, we have a government that is ending and reversing stimulus, along with a fall election that is expected to shift the make-up of Congress so that it is split between parties. This effectively means that unless more stimulus gets passed in the next 6 months, it likely will not happen over the next 2.5 years. So, while there is still time for the government to do some kind of additional stimulus, particularly with regard to student loans, this year, I don’t think it’s something investors should count on. This withdrawal of stimulus will have a negative impact on corporate earnings over the next 6-18 months and will cause a bear market.
Well, it has already caused a bear market, even if stock analysts haven’t admitted it and taken down corporate earnings estimates, yet. But, actual investors are starting to see the writing on the wall, as we can see from Paychex and the S&P 500’s declines off their highs.
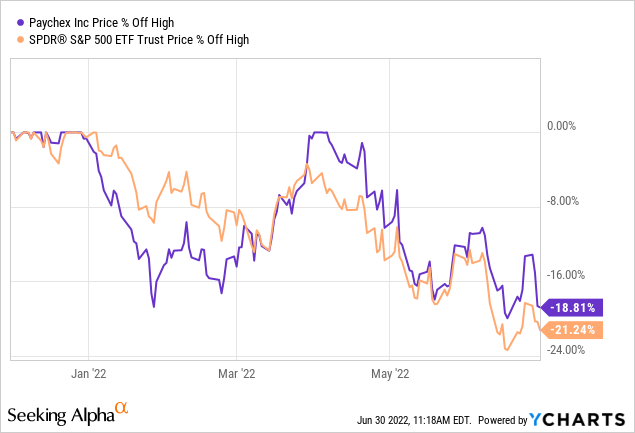
They are both down roughly -20% off their highs.
On top of future earnings misses we also have the Federal Reserve raising interest rates as fast as humanly possible in an effort to get inflation down to their 2% core inflation target. Expecting the Fed to lower fuel and food prices along with expecting them to fix supply chain problems and geopolitical issues without causing a recession is a tall order. So, on one hand, we have a market that is already in a bear market because it was priced as if stimulus would continue forever when it obviously wasn’t going to continue forever, and now we also have a recession coming in the next 6-12 months unless there is some miraculous intervention or change of mind from policymakers.
So, a deep bear market and at least a mild recession should be the base case investors are operating under here.
With that in mind, it’s useful to examine two things. The first is what was Paychex’s peak P/E ratio before the 2008/9 recession, and the second is how far Paychex’s stock dropped during that recession. I prefer to use the monthly average for the peak P/E ratio from FAST Graphs and that number is 31.13 P/E from mid-August 2007. Here is the drawdown from the high during that recession:
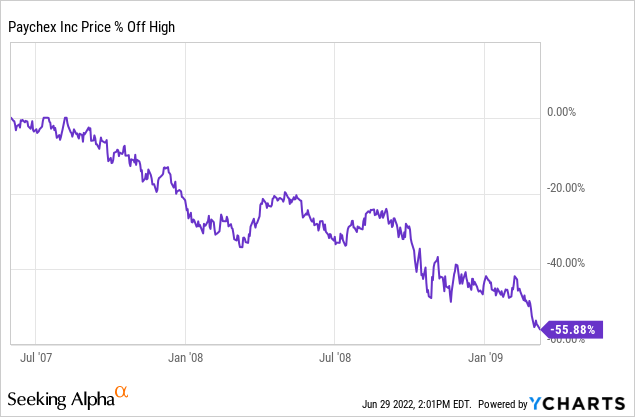
In total, Paychex fell about -55% off a peak P/E of 31 back in 2008/9.
During today’s decline, this April, Paychex peaked at a 38 P/E ratio, quite a bit more expensive than it was going into the Great Recession. For that reason, I think investors should be prepared for at least a -50% drawdown from its peak price of about $142. That would be a price of about $72. Right now the stock is trading around $114 per share. That implies that during a recession, even from today’s price, the stock could fall another -35%. That decline is significant enough that I think it’s still reasonable to rate Paychex stock a “sell” even though it’s right on the borderline of being a hold.
Conclusion
Stock investing is all about estimating forward returns and asking yourself if those forward returns are good enough to meet your goals. Paychex forward returns over the long-term are probably about 4-5% per year. And this is about what they actually earned for investors who bought before the Great Recession and held for 10-years.
FAST Graphs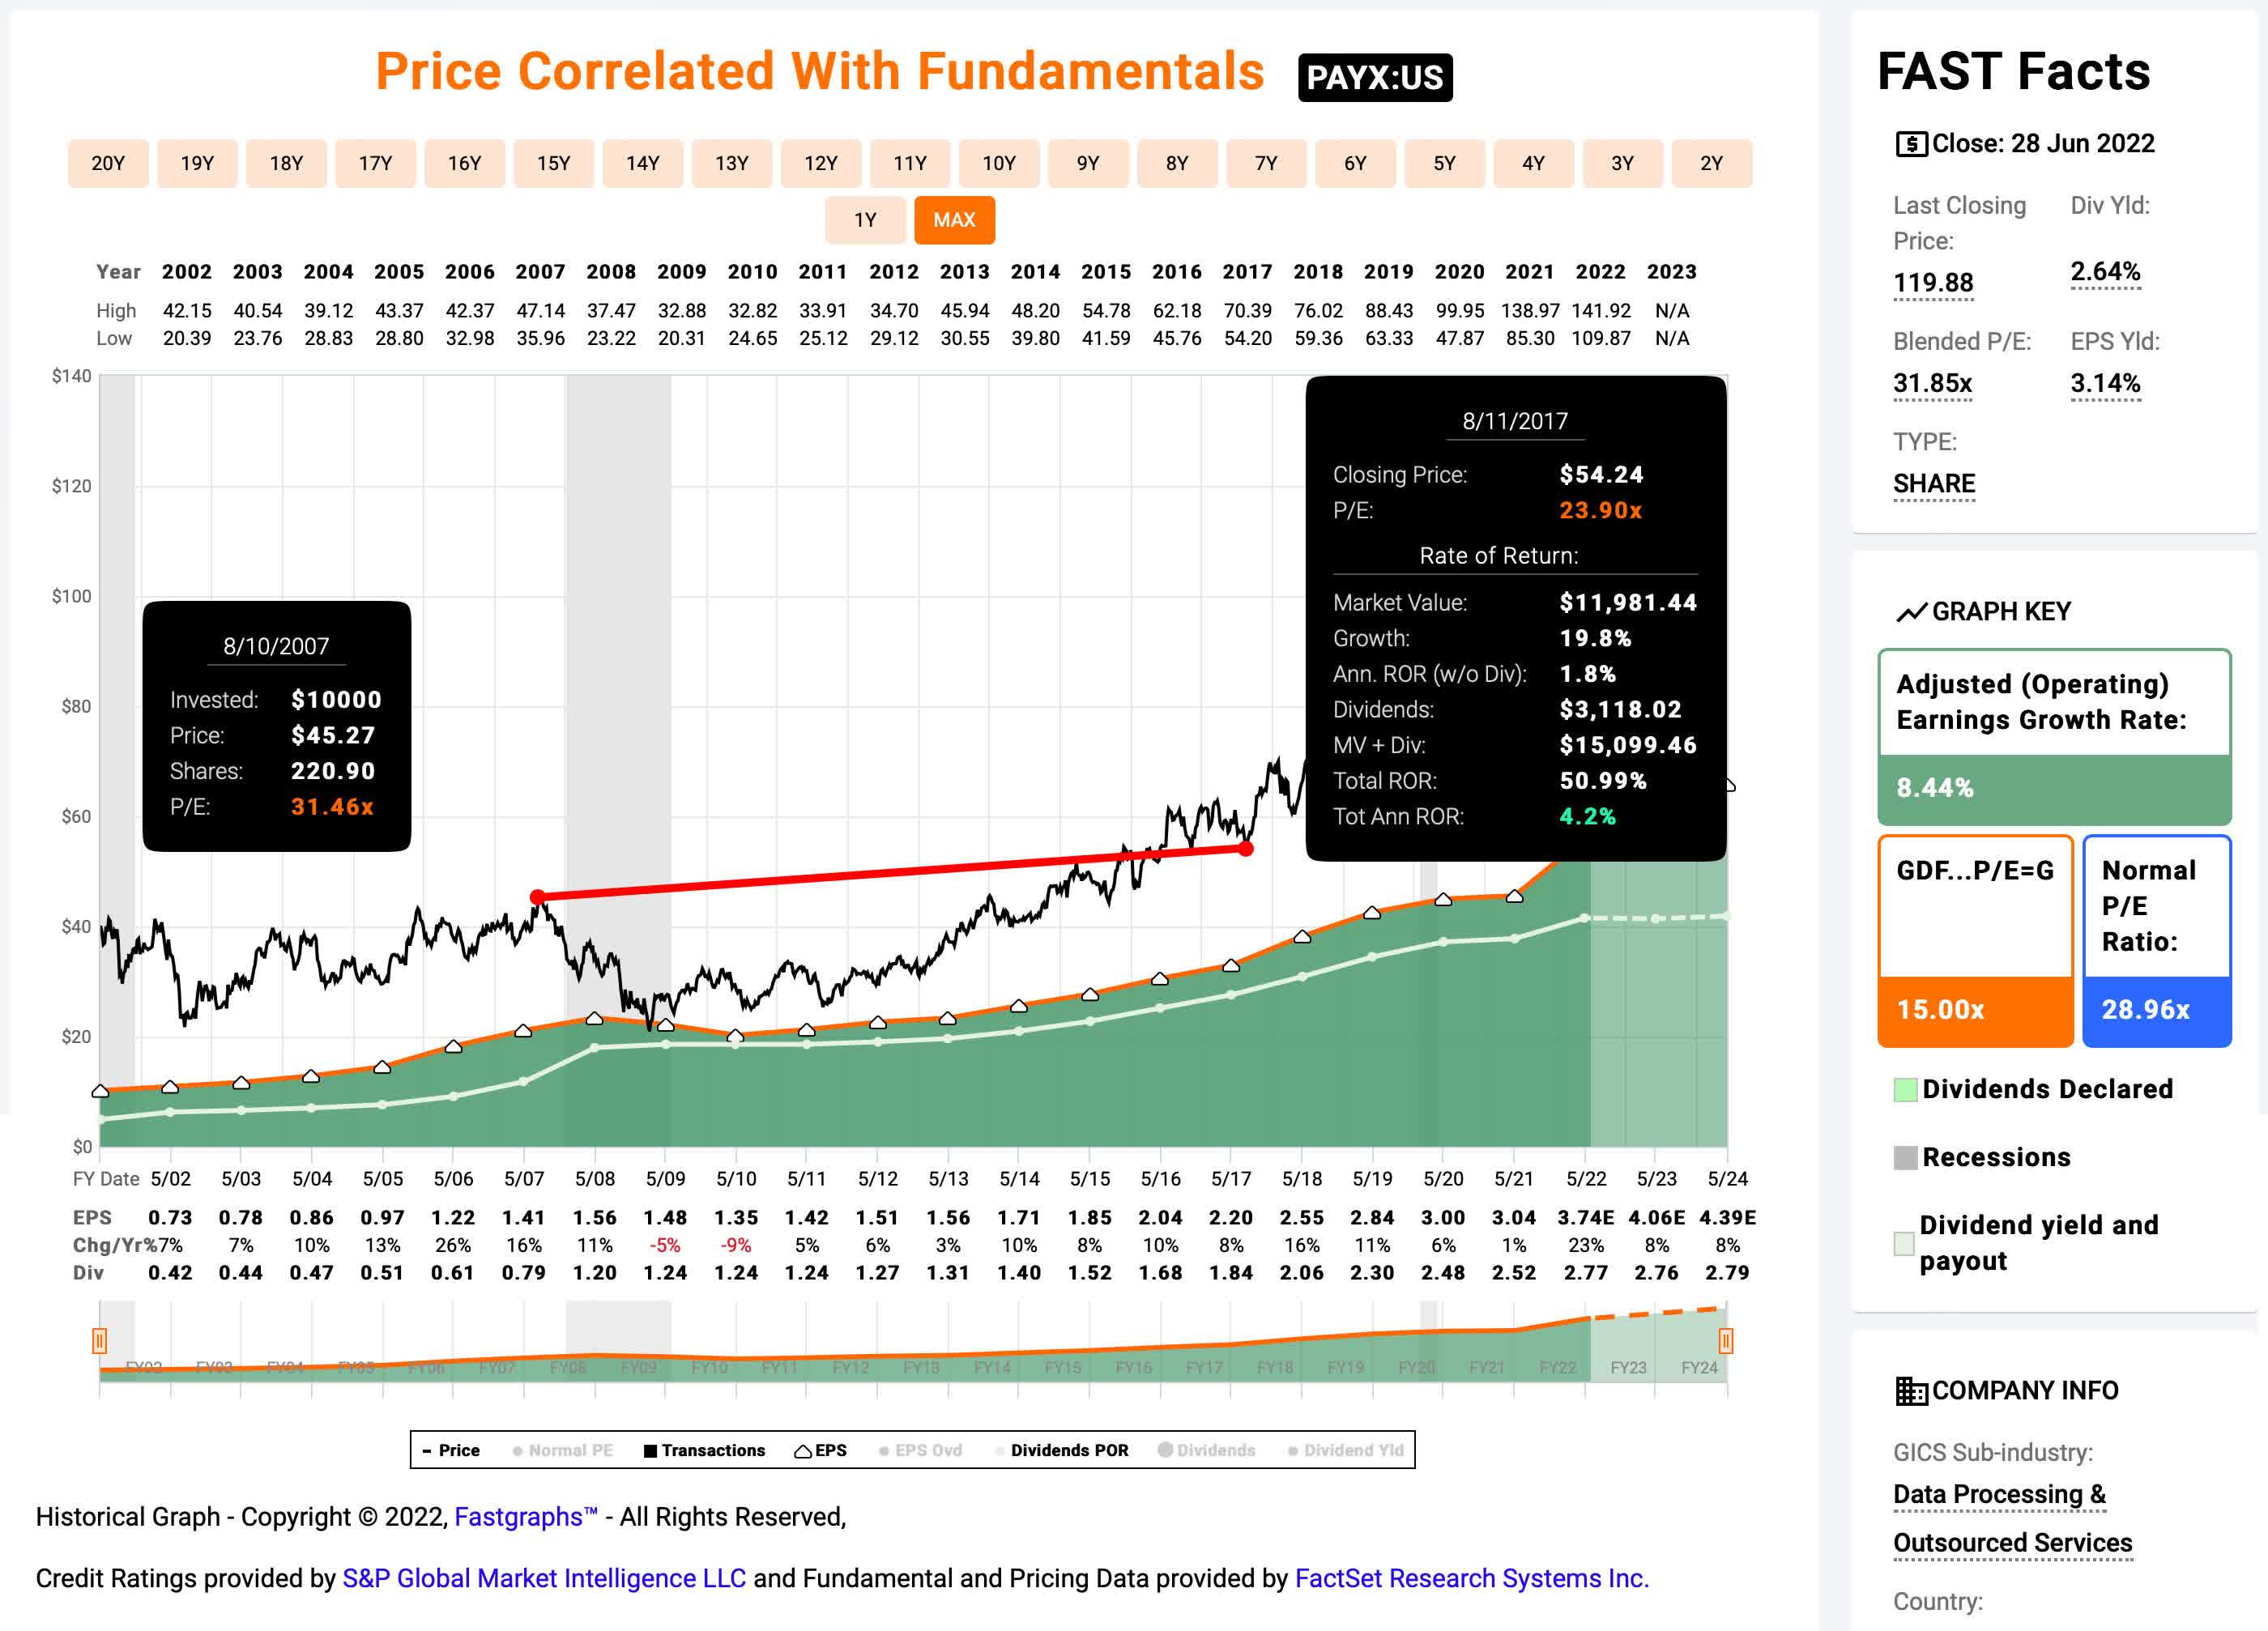
If a person would have bought Paychex stock at a very similar P/E ratio right before the 2008 recession and held for 10 years from August 2007 to August 2017, they would have had an annual return of +4.2% over this time period including the dividend. I see no reason why we should expect a different outcome this time around. Maybe a 4% to 5% return is good enough for some investors, but I aim for a return in the 15% to 20% range per year over the long term. So, for me, I still need Paychex’s stock price to fall about -45% from here to get me interested in buying it.
Be the first to comment