

honglouwawa/iStock via Getty Images
The article was published to subscribers of my service on the 26th of June 2022 as an explanation of our newly announced High Yield, Low duration portfolio.
Mortgage REITs have created the illusion of being quite the investment for income seekers in the last 20 years. Their simple structure and high distribution rates have benefited greatly the American investor by simply leveraging a long-term yield generated from high-quality mortgage-backed securities. In this article, we will try to understand the business of Annaly Capital Management, Inc. (NYSE:NLY) and determine what is the best way to get exposure here. The average market participant is mostly invested in common stocks and usually, the preferred stock of a company gets little to no attention. Sometimes this creates a hidden gem and it is up to any investor to dig just a little deeper to be able to profit even greater from the company he already likes and invests in. As of the moment, we do believe NLY-I represents a hidden gem opportunity and will try to defend this thesis.
Road map of the article:
- NLY’s business
- Historical returns of the common stock
- Current Company structure, Assets, Liabilities, Hedges
- Biggest risks
- The leverage ratio and common stock offerings
- Dividend sustainability common vs preferred
- Preferred stock characteristics
- Interest rate risk protection from the preferred stock
- Comparing expected returns and explaining risks
- Recent trading developments and the pair trade potential
- TWO preferred stock buyback announcement
- Final comparison
- Conclusion
NLY and its operations
Since its IPO in 1997 NLY has always had its portfolio mostly invested in long-term high credit quality fixed-rate mortgage-backed securities. The main idea is to borrow money at shorter-term rates which are supposed to be lower than long-term mortgage rates, “save” the spread by constantly hedging the assets’ interest income by using interest rate swaps and partially hedging their NAV against interest rate risk by shorting similar duration treasury futures. Credit risk is comparable to the credit risk of the USA so basically, this is not a concern as long as the company keeps its assets mostly in agency-backed MBSs. In a perfect world with no economic cycles and static rates where everything can be calculated the hypothetical ideal year would look like this: Earn 3% on the assets, pay 1% borrowing costs, leverage the return 10 times, and have the same net asset value at the end of the year. Here it is 20% gross ROE generated regularly with no fluctuations distributed to the retirees. Most likely this is the dream of the CEO and the team of NLY tries to do anything possible to limit any type of fluctuations but the financial world is far from ideal and having such a large exposure and social responsibility needs a lot of risk management and proficiency. The following ironic picture illustrates what would be the ideal scenario for any MREIT:
MREIT Management Dream (Personal Drawing)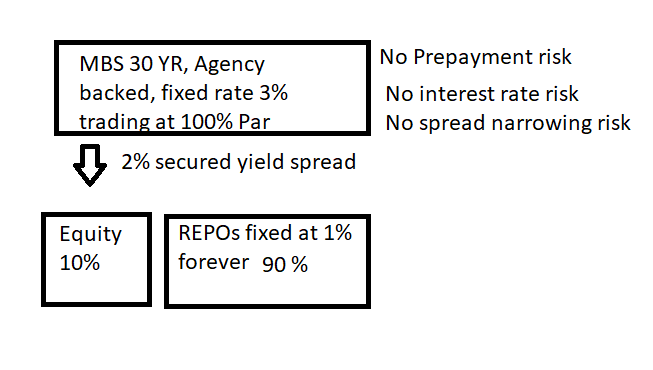
Past results of NLY
NLY vs SPY Cumulative Return (NLY Website)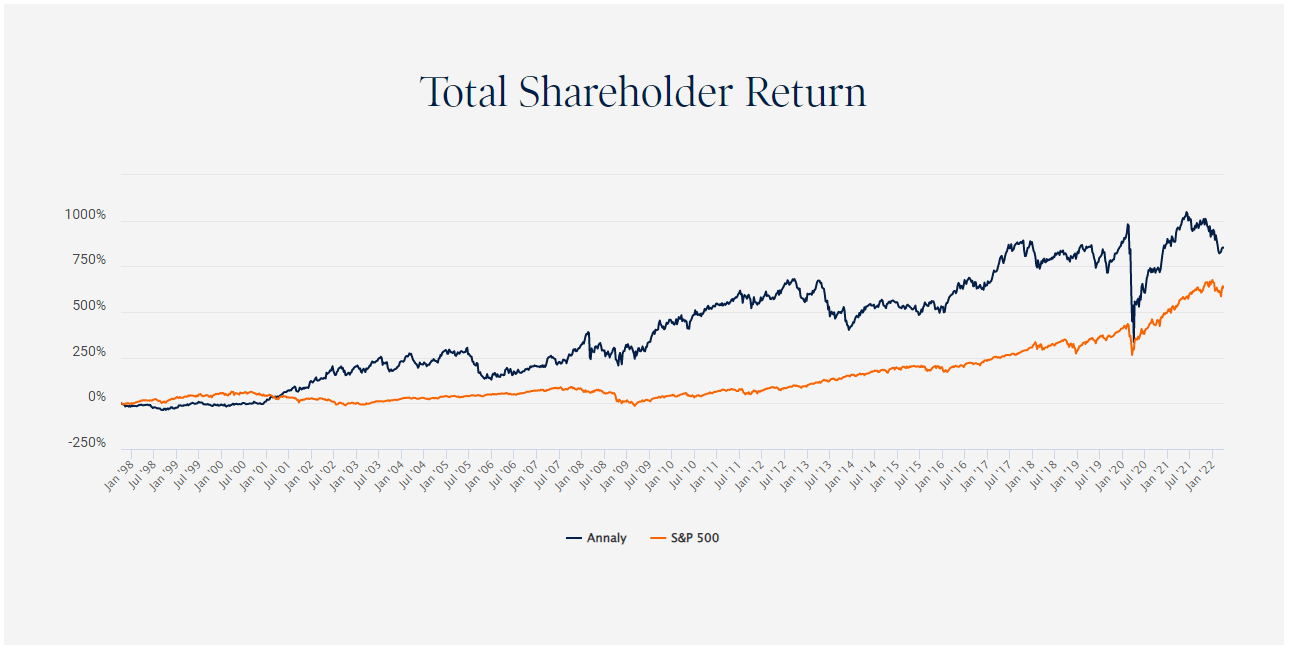
This is what you will see if you go to investor relations on the company’s website. Quite an impressive chart to be honest. I have also looked at year-end ROE on average equity metric in all of their annual reports:
NLY ROE By Year Since IPO (NLY Annual Reports)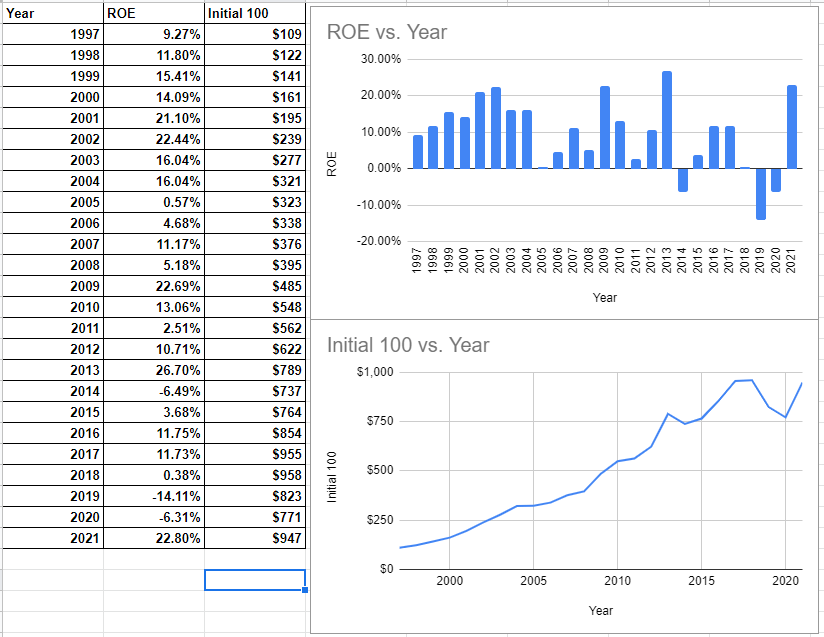
If one is a long-term investor and can stomach market price volatility, these are the pure ROE returns of the company from its inception till the end of 2021. The CAGR stands at 9.8%. If we only include the year 2022 and the CAGR falls below 9%. There is another problem with these returns:
NLY Trailing Returns (Morningstar Website)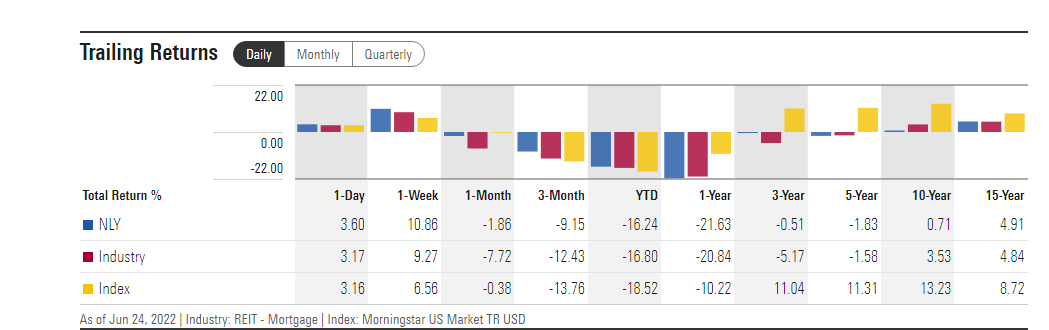
For the last 3 and 5 years, the returns have been negative. For the last 10 years, you have barely broken even and for the last 15 years, the CAGR is at around 5% annually. There are 2 other factors that seem quite important:
Leverage dynamics:
Leverage And ROE (Data By Annual Reports)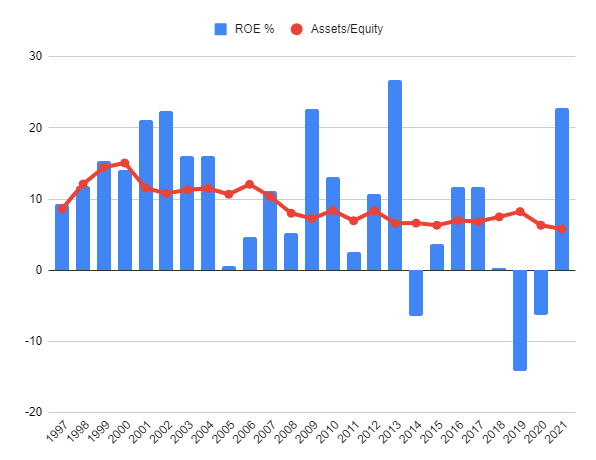
Portfolio credit quality. The financial crisis of 2008-2009 changed the financial world drastically. There have been numerous new regulations and adjustments to all financial institutions. MREITs are not an exception, they had to react to a world where the general public wanted more safety:
Agency MBS Bought By MREITs (FED Research On MREITs)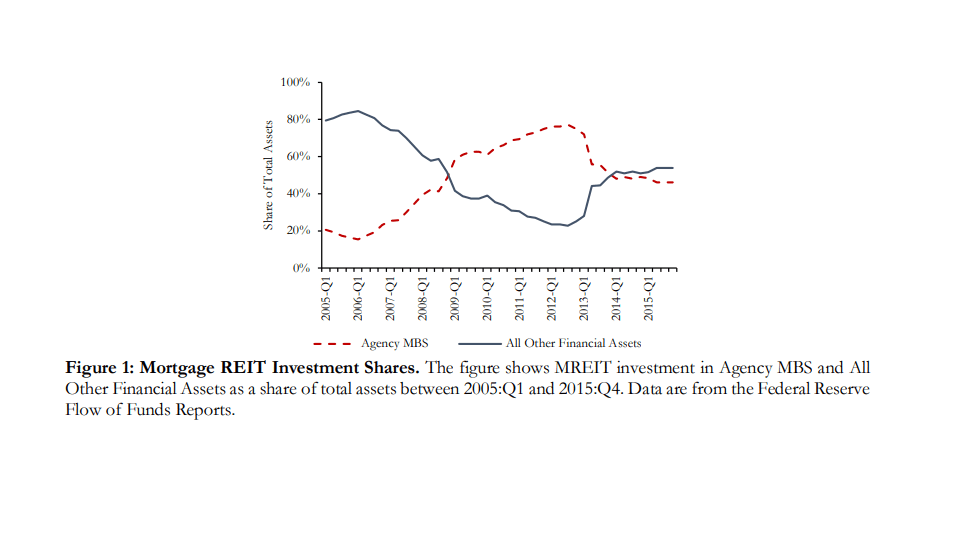
Investing more and more into Agency MBS is supposed to lower absolute returns and reduce the overall credit risk of the portfolio. All else being equal it will be harder for the average MREIT to generate precrisis returns by taking less credit and less leverage risk. It is as simple as that.
Here comes the big problem with common stock investing, returns are way too volatile even in a simple MREIT common stock. Based on the numbers presented above, one cannot determine a high probability confidence interval for his future expected returns. This leaves the sophisticated investor with 2 options:
- Depend on luck
- Do further research to determine risks and relative returns.
Since the assets of NLY have primarily been 30-year fixed-rate securities a trend of lower and lower yields is supposed to limit downside risk:
30-Yr Constant Maturity Yield (FRED Economic Data)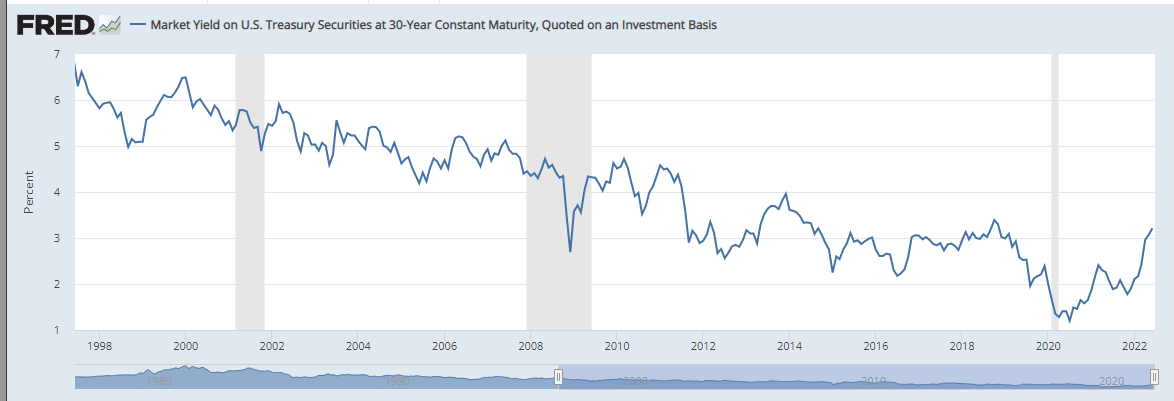
For most of the years, the management was mainly concerned about prepayment risk. Probably one of the biggest pitfalls of mortgage-backed securities for their holders is the fact that they can be refinanced at any point in time and usually, it makes sense to refinance your mortgage at a lower rate so people are doing it. This limits the upside potential of any mortgage rate but prepayment risk is not something that brings large shocks to the NAV of the MREITs. The other factor from which an MREIT benefit is low financing cost. In the last 20 years, this is the 1-month constant maturity rate:
When you have a fixed-rate 30-year asset in an environment of falling yields and a short-term financing rate close to 0% you are in a good position now, aren’t you. Of course, management did not know how these charts would look in the future and they needed to be hedged all the time. If you look closer you will notice the rising short-term rates from 2005 to 2007 have slashed ROE to 5.47% on average compared to 15.77% before 2005. 2018 -2019 brought a negative average return of (-)7%. Actually, 2014 and 2019 are the 2 big shocks in earnings. I have read the annual reports and would personally prefer to get some more information from management on billions of dollars lost but they prefer to keep it short and not to the point. In 2020 The company along with almost any asset class on the exchange experienced its biggest price shock ever:
NLY Price Chart (Seeking Alpha)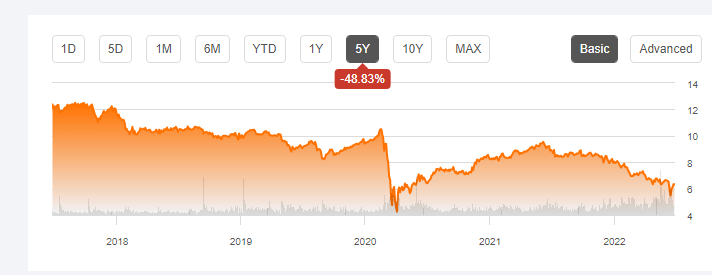
In 2 months The common went from $10 to $4. Here there are a lot of explanations but I personally think that this has to be excluded from the analysis. The valuations were all over the place at this point and there was nothing reasonable. To conclude this part of the article, I would like to point out that it will be very hard for NLY to reach a steady 9+% yield based on the historical data. This is very true in a rising interest rate environment combined with all the market uncertainty. It is not impossible but seems hard to achieve and it is hard to bet on this with a high degree of certainty.
NLY as per the last report
Assets:
Assets of NLY (NLY Earnings Presentation)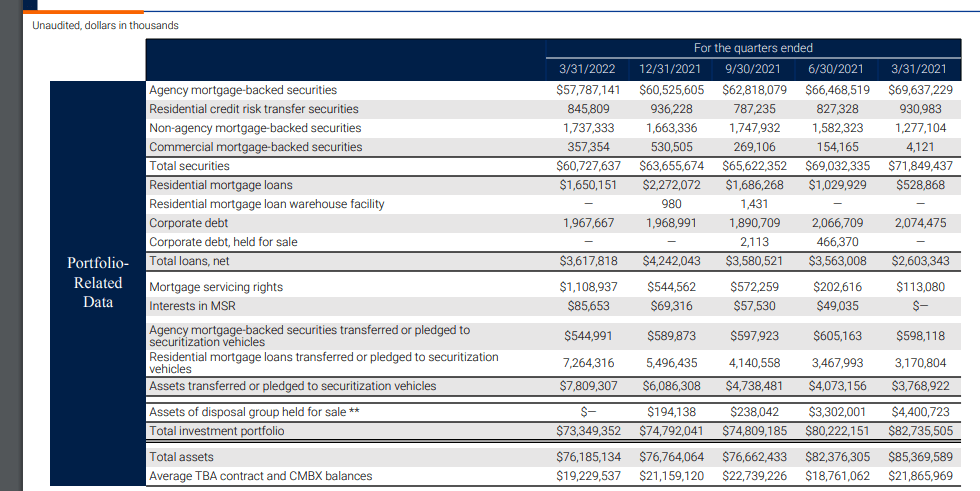
Liabilities:
NLY Liabilities (NLY Earnings Presentation)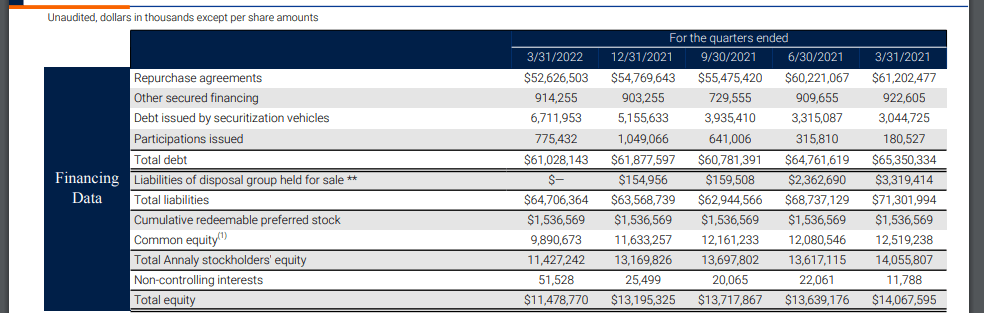
Hedging:
Hedging (NLY Earnings Presentation)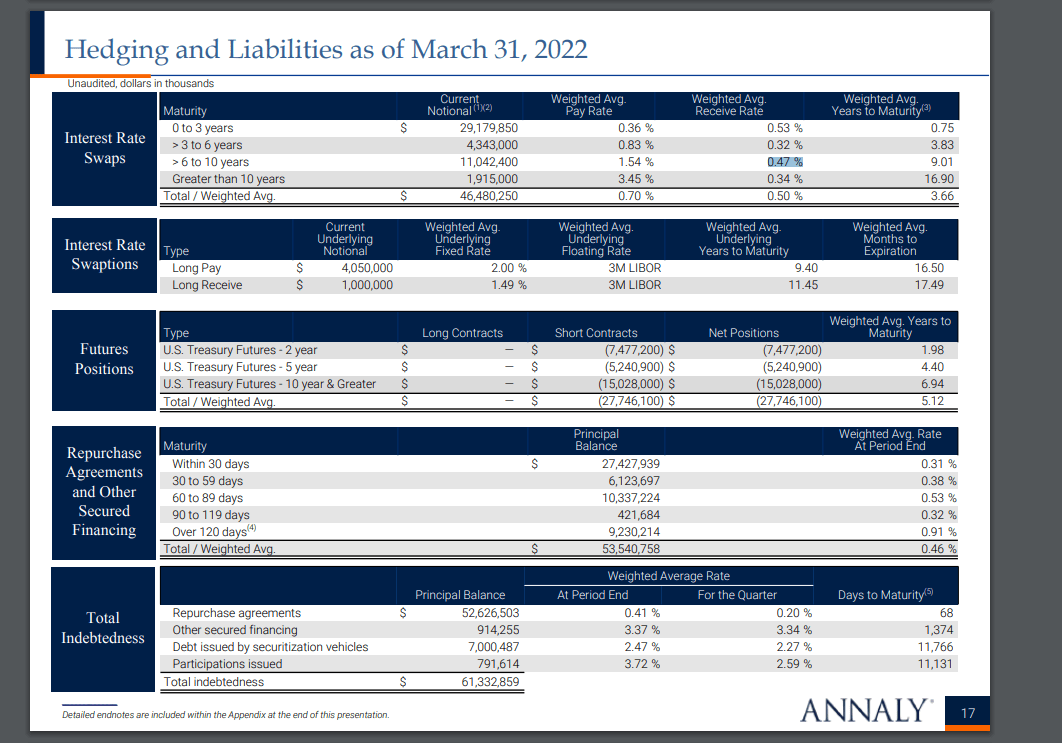
This is the raw data of NLY. To summarize we have around $73 bln. of assets (primarily Agency MBS, 30-year, fixed-rate), $61 bln. of debt consisting of $53 bln Repos, and $11.5 bln total stockholder equity that includes $1.5 bln. preferred stock. The company is hedging its portfolio by a combination of interest rate swaps, swaptions, and short positions on treasury futures which seems to be the standard for the industry. To understand the targeted return of NLY management it is most likely best to look at the “Non-GAAP reconciliations”. This is supposed to give us the real economic outlook of management without trying to comply with accounting practices. I find the following table quite useful:
Non-GAAP Metrics (NLY Report)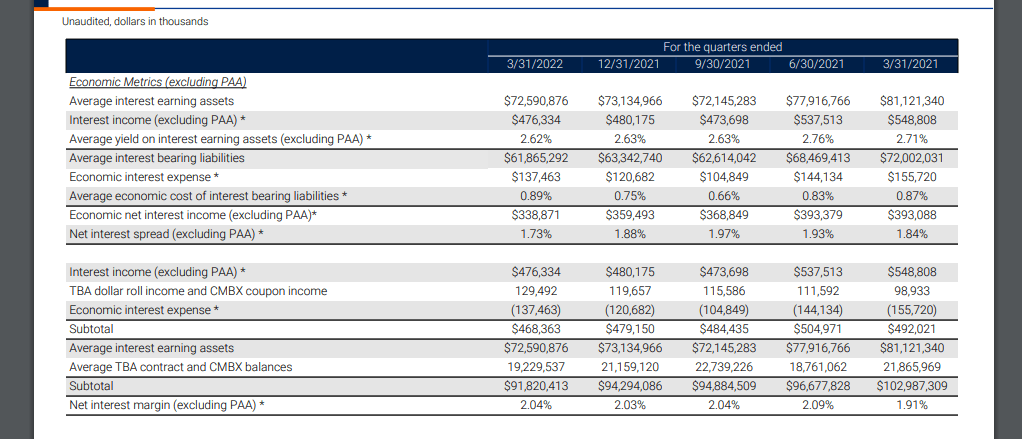
At the top of the table, we have a pretty static number of around a 2% net interest margin. This has to be the number that management is trying to achieve with all its hedging operations. Ironically this is the number I chose at the beginning of the article. An investor has to understand that anything in excess of this 2% yield spread is not to be expected which puts a cap on your upside potential when investing in any MREIT common stock. Here you can see the historical spread between the 30yr Average Mortgage rate and the 1-month constant maturity rate and the histogram of the spread
30-Yr Average Mortgage – 1-Month Rate (Personal Spreadsheet, Data By FRED Economic Data)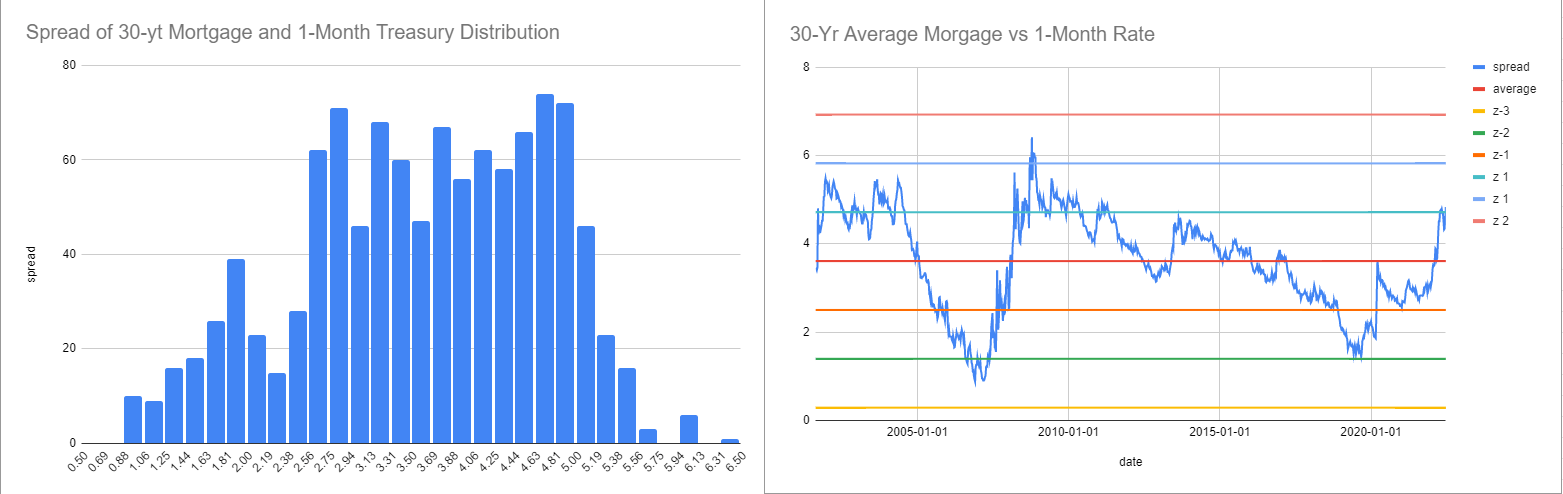
The average spread here is around 3.6%. This is as close as it gets to a perfect situation for an MREIT. As a long-term investor, it will be very hard to escape the averages from this period. What better scenario one might expect? The NLY investor has to also understand that we might be in the most unpleasant situation for an MREIT where the yield curve flattens and the long-term vs short-term spread is gone for an unknown period of time. As seen at the beginning of the article, NLY has had a real problem generating returns in periods when short-term rates are rising. To conclude this chapter I want to point out that as of the moment NLY has earned around 5% CAGR for the last 15 years, it is invested primarily in Agency MBS and is at historically low leverage. The market expectations are for the yield curve to flatten and there is overall uncertainty in fixed income and equity markets. It is up to the reader to decide if all this data suits him well when considering NLY.
Biggest risks
The risks for NLY can be divided into 2 main groups:
- Risk of not making money due to losing the interest rate spread
- Risk of losing money
On the liabilities side, the more short-term rates are getting closer to long-term yields, the less likely is for NLY to be able to generate significant profit. There is just no way to borrow money cheaper on planet Earth compared to NLY which is involved in REPO operations using some of the safest assets in the world. If you buy apples at $1 per kilogram and you sell them at $1 per kilogram it is hard to make money. This will have a devastating effect on earnings and future positive cash flow but will not put the company in a worse credit situation. From a REIT perspective, this is the situation when you don’t have tenants.
The far greater risk for NLY is to be losing a significant amount of its capitalization due to assets revaluations and hedging mismatch. The interest rate swaps implemented as a hedging tool are increasing interest income and the present value of the swap creates capital gain to compensate for NAV loss when interest rates rise. Shorting Treasury futures has no effect on interest income and is only implemented to save NAV. There is a big problem with this approach. Even though treasury futures and agency MBS are both backed by the USA, they are not the same thing. In extreme situations, these can shift directions. One such example was the Covid-19 panic of 2020:
MBB vs IEI (Proprietary Software)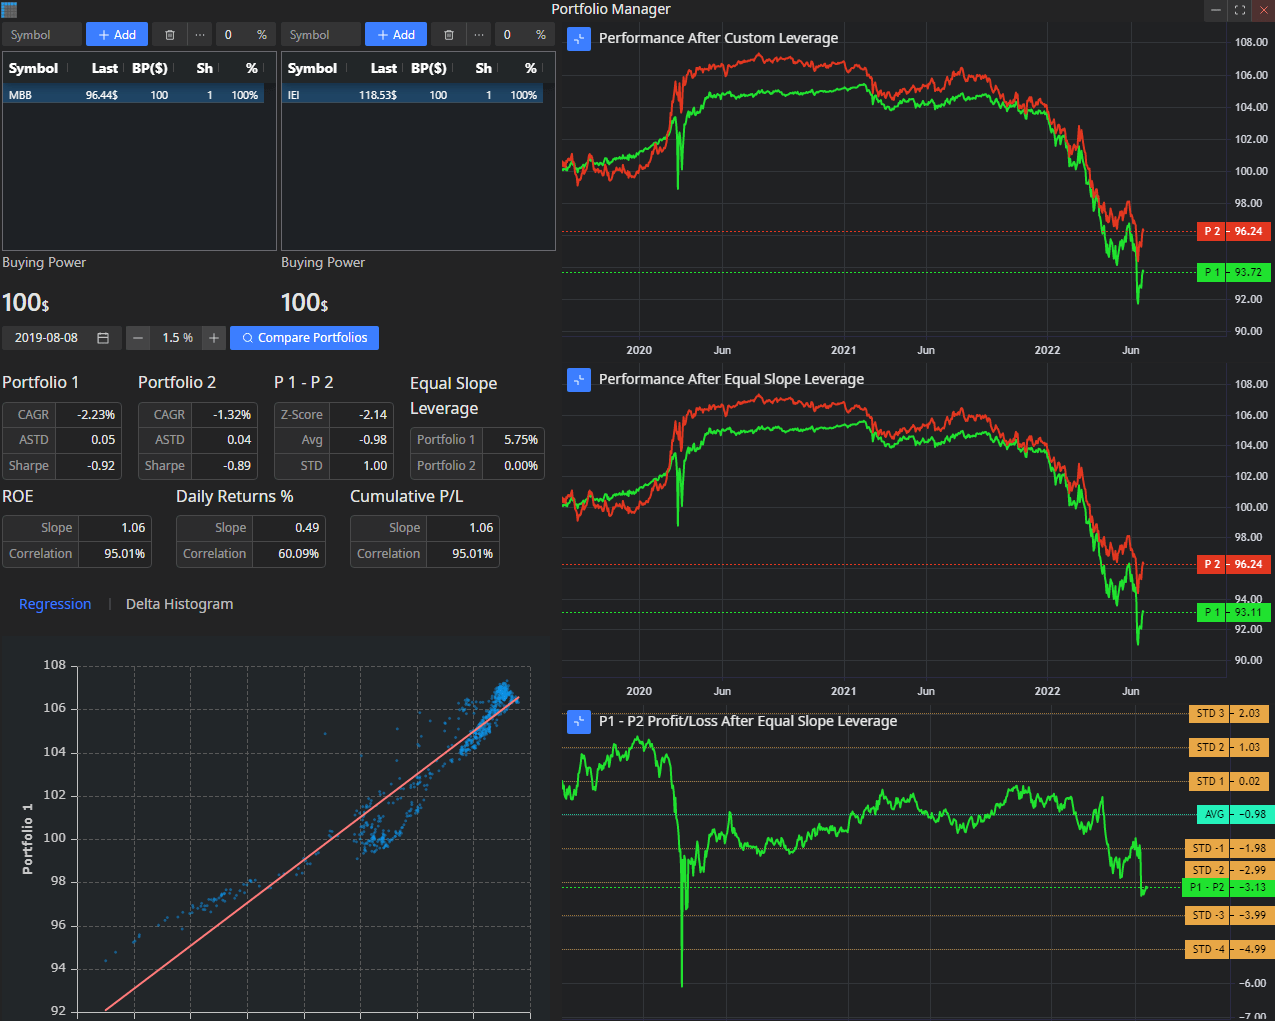
On this chart, one can see how MBB correlates with IEI. Using treasury futures to hedge MBS is pretty similar to this. The model is far from perfect. These are the 2 ETFs basic characteristics:
IEI:
IEI Characteristics (Ishares Website)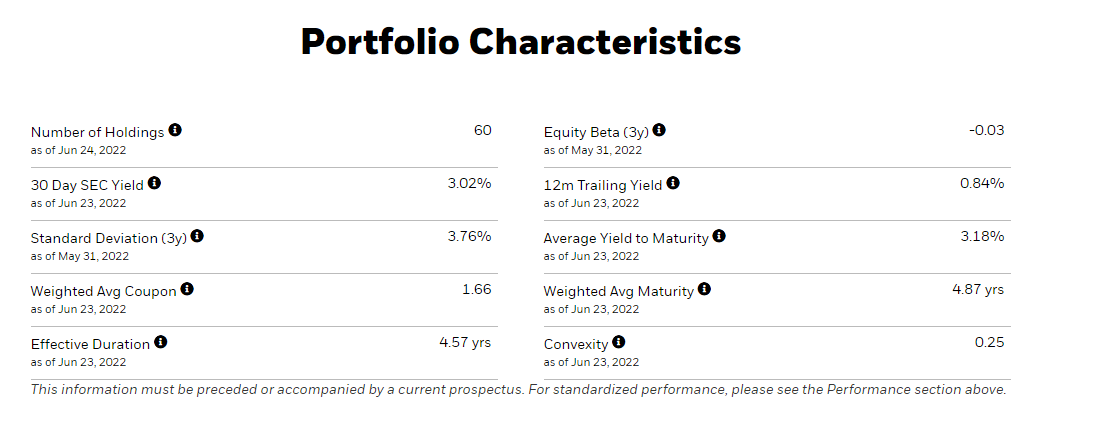
MBB:
MBB Characteristics (Ishares Website)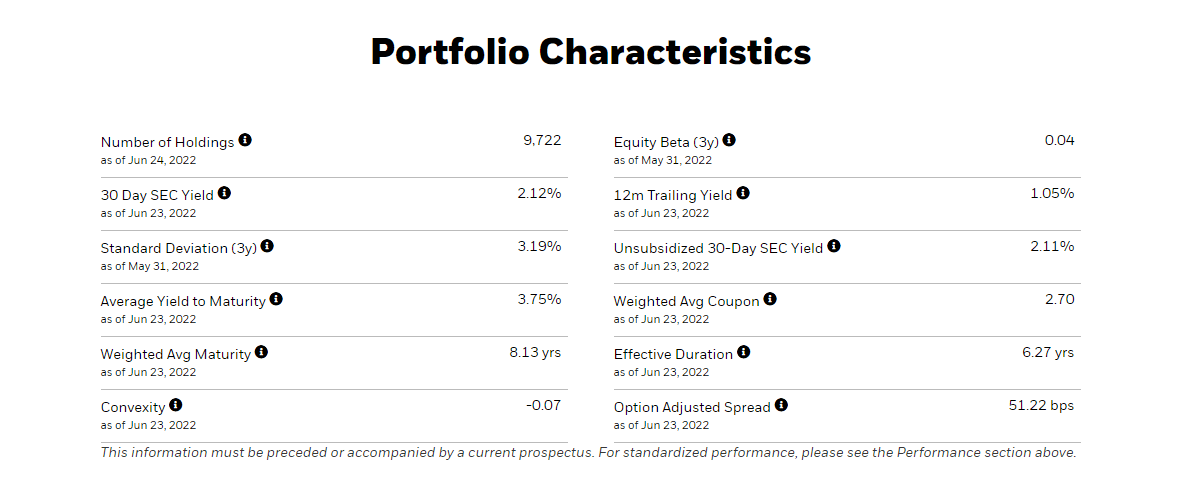
As a heavily leveraged trader, I have seen far better models causing extreme deviations. It seems pretty logical that this hedge is supposed to work most of the time but when it doesn’t, NAV is demolished in the very short term. Management has absolutely no reaction to such an event. In 2020 IEI and MBB deviated around 7%. Imagine a 7% deviation on $70bln of assets. This is around $5 bln. On around $10 bln of equity, it is like 50% being wiped out due to market inefficiencies. Actually, there is not much available literature on hedging duration risk in MBS and the models MREITs use are pretty simple and the standard for the industry is not changing. It is a pity that we as investors have no clue what model they are using when choosing their hedging strategy and since they are not sharing we can allow being harsh and claim that on average any 5 years something in the model is broken. For anyone interested in duration calculations I am posting a picture from MSCI’s blog:
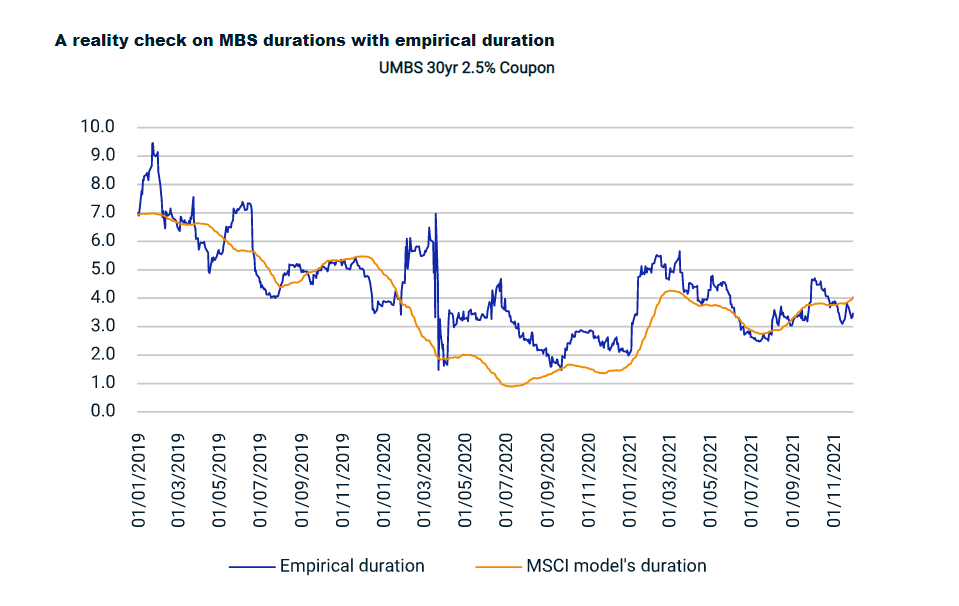
That shows how models deviate from reality. Here is the link. All of this adds further uncertainty to the expected return on investment in NLY’s common stock.
Common stock offerings and keeping a low leverage ratio
There are constant common stock offerings. This of course has its logic when the company is trading above NAV, but there is one concerning fact with all these offerings. There are periods in which NLY earns its interest margin and is cash-flow positive while its NAV gets the hit. So in this situation the leverage ratio increases. NLY management wants to distribute its high distribution per common share. It announces its dividend and makes a common stock offering. I find this rather strange. Here there are 3 of them:
It might be a better idea to just cut the distribution and show the real situation in the company. Where is the problem here? The US income investor has an obsession with distribution yields. By all metrics used in financial analysis, these distribution yields seem to be sustainable. In fact, this is not true. A simple flattening of the curve will make these distribution yields impossible. Without understanding the business model and looking at interest coverage ratios from past periods you have a big chance of ending up being misled. Higher than justified distribution yields create a constant overvaluation of the stock which further limits the reasonable investors from holding the stock when it is overvalued. This also creates bigger volatility when eventually the distribution cut is unavoidable. From a credit perspective, NLY is doing a perfect job to keep the preferred stock as safe as possible. Any time they make a common stock offering they are sending a signal to the public that they love their preferred stock and want it to have a cushion in the face of the higher market capitalization of the common stock. Once the preferred stock entered the discussion it is time for the next chapter
Dividend sustainability of preferred stock vs common stock
There are several factors that make the preferred stock dividend safer in comparison to the common stock dividend. Preferred stocks are higher in the capital structure. NLY cannot pay a common stock distribution unless it pays its preferred stock. NLY common stock distribution is enormous in comparison to preferred stock. As of the last report preferred stock is around $1.5 bln while common stock is around $10 bln. The distribution yield of the common is around 14%. NLY is expected to pay common stockholders around 12 times more money. The distribution to NLY stockholders alone is comparable to the market capitalization of the preferred stocks at the moment. As per the last report NLY pays around $107 mln of preferred stock dividends per year vs around $1.32 bln in common stock dividends. A simple cut of 9% is enough to pay the preferred stock dividends. A full distribution cut of common stock dividends is enough to redeem the preferred stocks on their respective call dates. The MREIT preferred stocks are a strange creature that almost does not depend on the profitability of the company in terms of credit risk. The earnings will eventually be distributed to common holders anyway. But as shown in the beginning, NLY has significantly cut its leverage ratio. This adds a lot of credibility to the tiny preferred stock part of the capital structure. What is extremely positive for preferred stockholders is that management is willing to dilute common equity so that it keeps its leverage ratios stable. Even if there is a shock in the common stock like in 2020, NLY will eventually issue more common stock and preferred shareholders will not take any hit as long as the company survives. This is an extreme benefit to preferred stock.
The preferred stock
There are 3 preferred stocks outstanding:
NLY Preferred Stocks (Proprietary Software)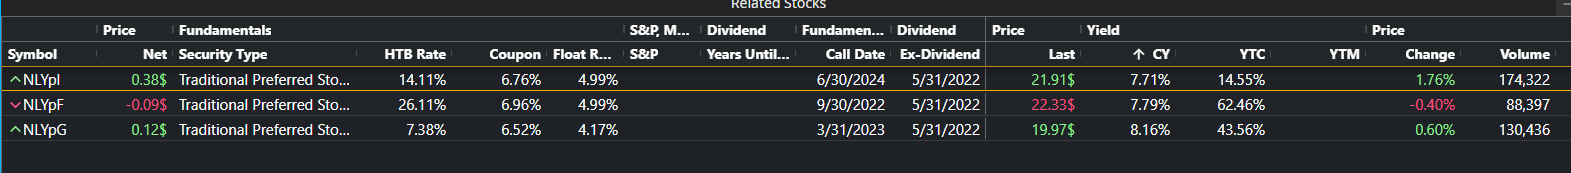
NLY-I (NYSE:NLY.PI) was added to our newest high-yield portfolio at a price around $21.3 and is the pick from the family. The logic presented about NLY-I is to be used when evaluating the other preferred stocks from the family. So NLY-I is a fixed to floating preferred stock that is fixed until its call date 5/31/2022. If not redeemed it will then have a floating rate of 3 months LIBOR + a spread of 4.99%. Its yield to call if redeemed is 14.55%. The Fed median projection for 2024 is 3.375%. LIBOR is usually following the Fed funds and since it is the interbank offering rate it is supposed to be slightly higher than FED Funds. It is extremely rare to have a spread lower than 0.15% so it will be safe to assume that if FED governors are correct LIBOR will be around 3.5% in 2024. If NLY-I is not redeemed we can assume that its dividend in 2024 will be 4.99% +3.5% floating or $2.1225 with Libor at 3.5%. As I am writing this article the biggest risk in fixed income and the biggest mover of the markets lately is interest rate risk. If the risk-free assets have a higher yield, all other assets have to shift accordingly. The floating rate feature of NLY-I makes this risk disappear. NLY-I will very soon be floating-rate security and every time the FED funds rate rises, Libor will rise so will the dividend of NLY-I. The XIRR of this investment bought today if we assume LIBOR to stay at its 3.5% level is a 9.41% perpetual floating rate. So if you buy NLY-I today and the company never redeems it the expected IRR on this investment if NLY is to survive is 9.41% and this comes without interest rate risk because of the floating nature of the security. This is the worst-case scenario as long as the company survives because when a security trades below par, its yield to worst is its perpetual current yield. NLY is at the low of its leverage. It has never had a preferred stock issued higher than 8.125%. NLY-H was issued around 5/15/2014 as a perpetual security when the 30 yr treasury yield was at around 3.33%. If NLY-H was floating-rate security it would have probably been issued at least 0.5% lower based on the lower duration risk of a floating rate instrument. There is nothing happening with NLY company at the moment that screams that there is some excessive credit risk for the preferred stock. There are 2 risks for preferred stocks, credit risk, and interest rate risk. If a preferred stock is falling without any of these two, it is supposed to be an “Alpha” event:
NLY-I Price Chart (Seeking Alpha)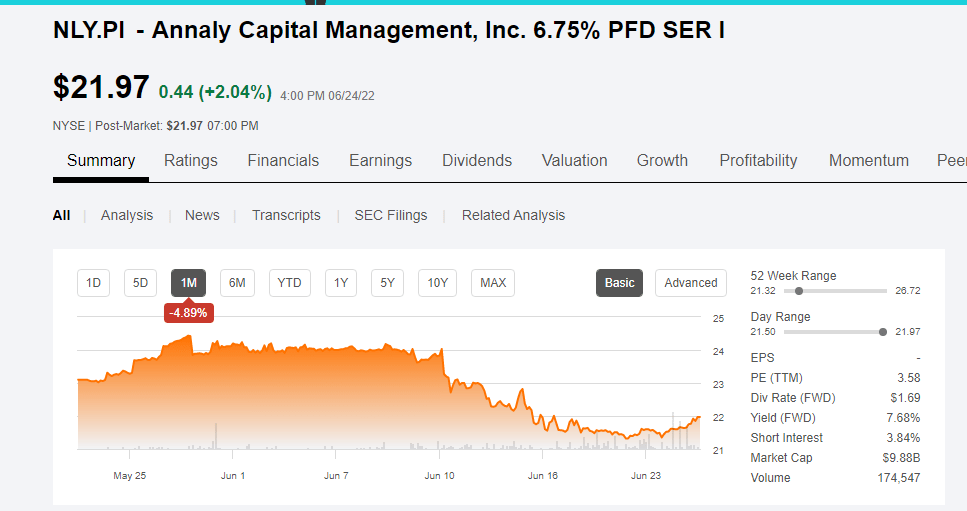
There has been some serious selling in MREIT preferred stocks recently and I find this to be a clear market mistake. To conclude this chapter I would point out that the expected yield to worst of NLY-I with Libor at 3.5% in 2024 is around 9.41% perpetual and NLY-I has a very high chance of being redeemed on its call date if its nominal coupon is at 8.5% floating all else being equal. In this case, the expected return is 14.5% annualized for the next 2 years. I will even be bold enough to claim that compared to NLY common stock, this 9.4% yield to worst is “safe”.
NLY-I vs NLY as a pair trade
The price dynamics of the 2 instruments are quite interesting:
NLY-I vs NLY Regression (Proprietary Software)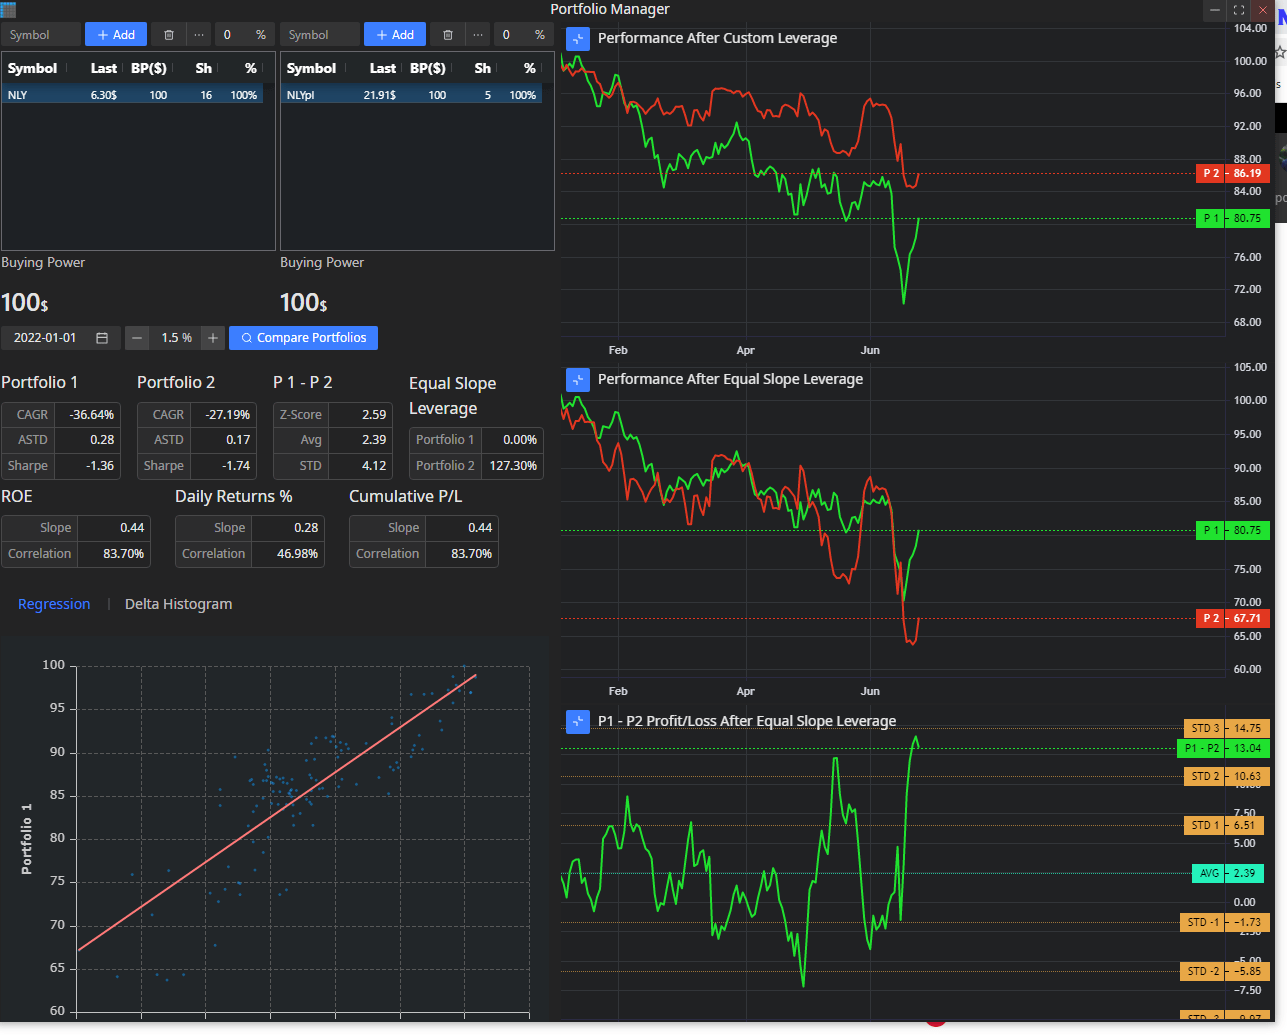
Year to date NLY is down around 36% annualized while NLY-I is down around 27% annualized. The NAV of NLY is falling and the common stock is just following its NAV. Seeking Alpha author Scott Kennedy is pretty consistent with his successful predictions of NLY NAV. I always use his articles as a reality check. So the move for the common stock has been pretty much correlated with NAV. The preferred stock has no NAV. Very soon NLY will most likely have the same leverage ratio as per the last report. There is no increased credit risk for the preferred. As Libor is rising and the yield curve is flattening, the redemption probability of NLY-I is increasing. This has to drive its price closer to $25. What is even more strange is that NLY has already retraced around 15% from its low while at the same time NLY-I has retraced something like 3% as seen in the picture above. This makes absolutely no sense. When there is a similar selloff in 2 products, the one to rise first is the one with less risk and higher embedded risk-adjusted return potential. Actually, this is not the first time market treats preferred stocks poorly compared to common stocks. I even have an old article dated 2/29/2016. At the time NLY-C and NLY-D were the mistreated ones:
NLY Preferreds From A Past Mispricing (Author’s article on Seeking Alpha)
They ended up being redeemed generating double-digit returns while NLY in the meantime has generated negative returns. History always repeats itself. As a short-term pair trade, it is reasonable to expect NLY-I to follow NLY and since historically its volatility is lower, one can use 100% leverage to replicate the beta of NLY and boost its return. I personally have the exact same trade.
Final Comparison of NLY vs NLY-I based on all the data presented
Potential return. Based on the historical spreads of the 1-month rate vs the 10 yr constant maturity one can expect an average of 1.58% interest margin. Since NLY currently has locked around 2% considering they are invested mainly in 30-year instruments with an average coupon of around 2.7% it will be very hard for them to achieve a 2% yield spread. NLY has been a lousy investment in the last 15 years and management makes a hedging mistake once every five years that causes billions of dollars to investors in the common stock. The return can be anywhere between negative 5% and a positive maximum of 10% with a very low Sharpe ratio due to extreme uncertainty. On the other hand, the worst that can happen to the preferred is to be a perpetual floater at 5% above LIBOR with a decent probability of earning something between 9.4% and 14.55% while not taking on interest rate risk.
Risks. The common stock faces all of the risks discussed in the beginning while the preferred stock faces only the risk that there will be such a market panic that the whole equity of the company will be wiped out. The preferred also faces the risk that management will do so badly in its hedging operations that will also wipe out the entire equity of the company. In neither of the cases, NLY common stock will outperform the preferred.
Recent news from the sector
A few days ago TWO announced that authorization to buy up to 1/3 of its outstanding preferred stock on the open market. TWO and all MREITs are very similar in their operations. It is extremely possible that all of the managers in the companies will want to buy their undervalued stock at such prices. This is supposed to be a big boost for the pair trade to work. Especially if the company decides to finance such a purchase with the issuance of common stock. And it will definitely make financial sense.
Conclusion
NLY-I is completely misunderstood by the market, especially in comparison to its own common stock. It provides a shelter from interest rate risk for the income investor. As a pair trade, it has a short-term gain potential for any trader and the trade is quite straightforward. 9.4% floating yield to worst is something that is not supposed to last long unless the whole MREIT sector collapses. The probability of NLY outperforming NLY-I on an absolute basis is very low and if we add the word “risk-adjusted”, the probability is close to 0.
If you are an NLY shareholder blinded by the 14% distribution yield, please comment so we can have a discussion in the comments section.
Be the first to comment