

undefined undefined/iStock via Getty Images
1. Correction-Drivers Update
- EPOL [Poland ETF] (geopolitics proxy): at a stalemate for now
- LQD [IG Credit ETF] (credit/rates): new lows as bond yields spike further
- ARKK [New Tech Fund] (tech burst): drifting further lower
Market itself just resting at support (and below both the 50 & 200dma).
@Callum_Thomas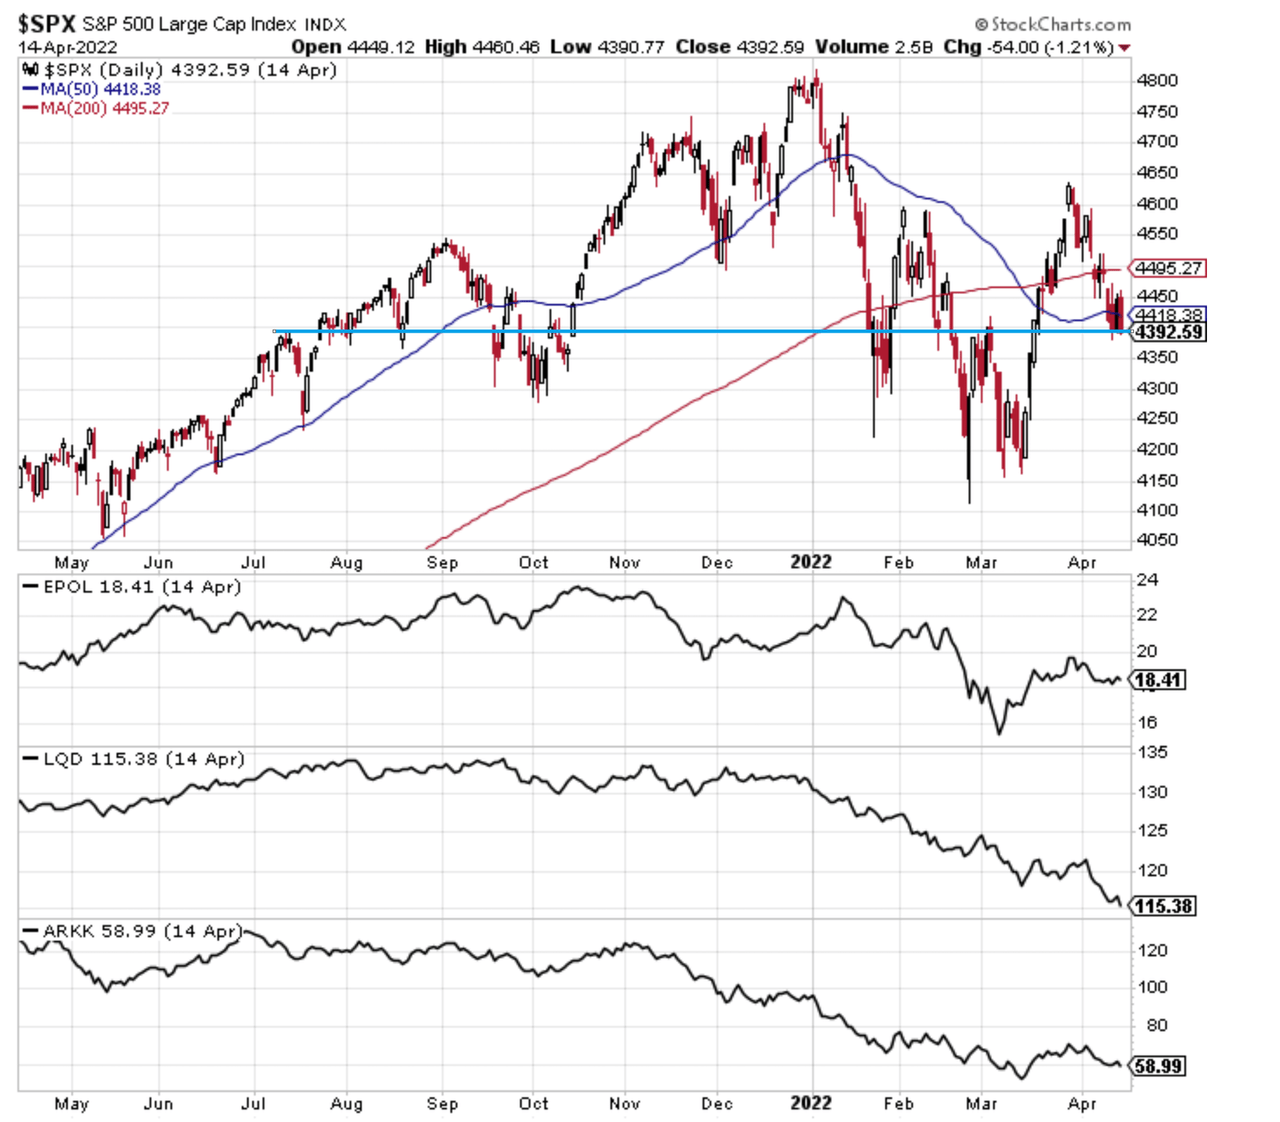
2. Amazon vs Commodities… Cycle has shifted: unfriendly regime for tech.
@exposurerisk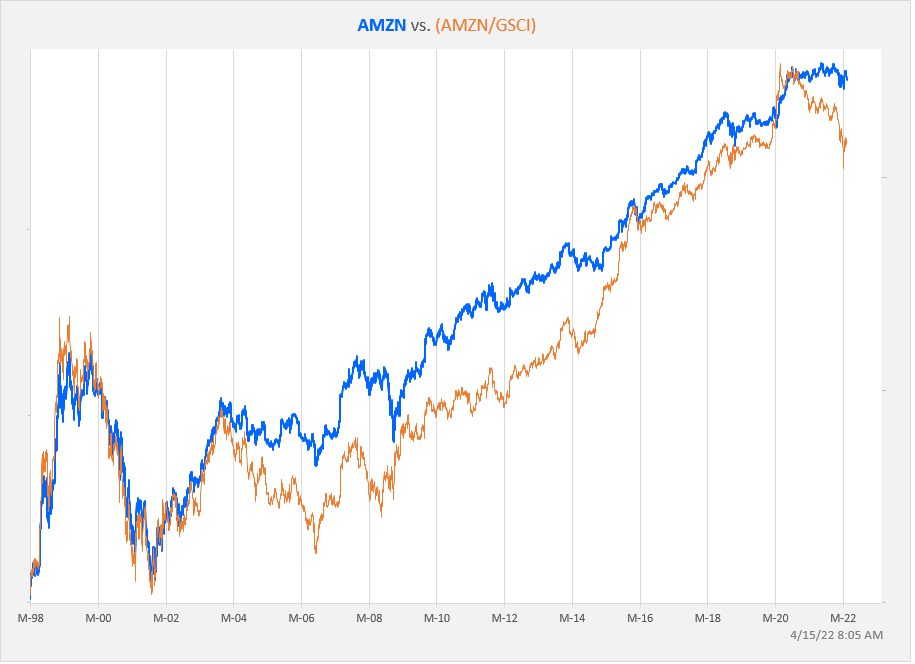
3. The rise and rise of tech… Permanently higher plateau?
@Marlin_Capital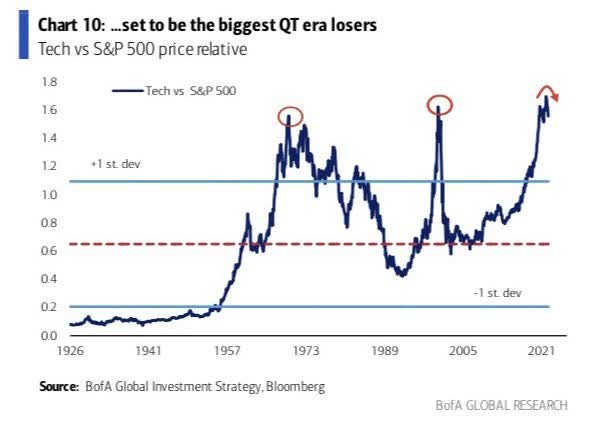
4. Retail Investor Sentiment: Decent correction in sentiment as measured by this indicator, but it’s still quite far from the bottom end of the range.
TD Ameritrade Investor Movement Index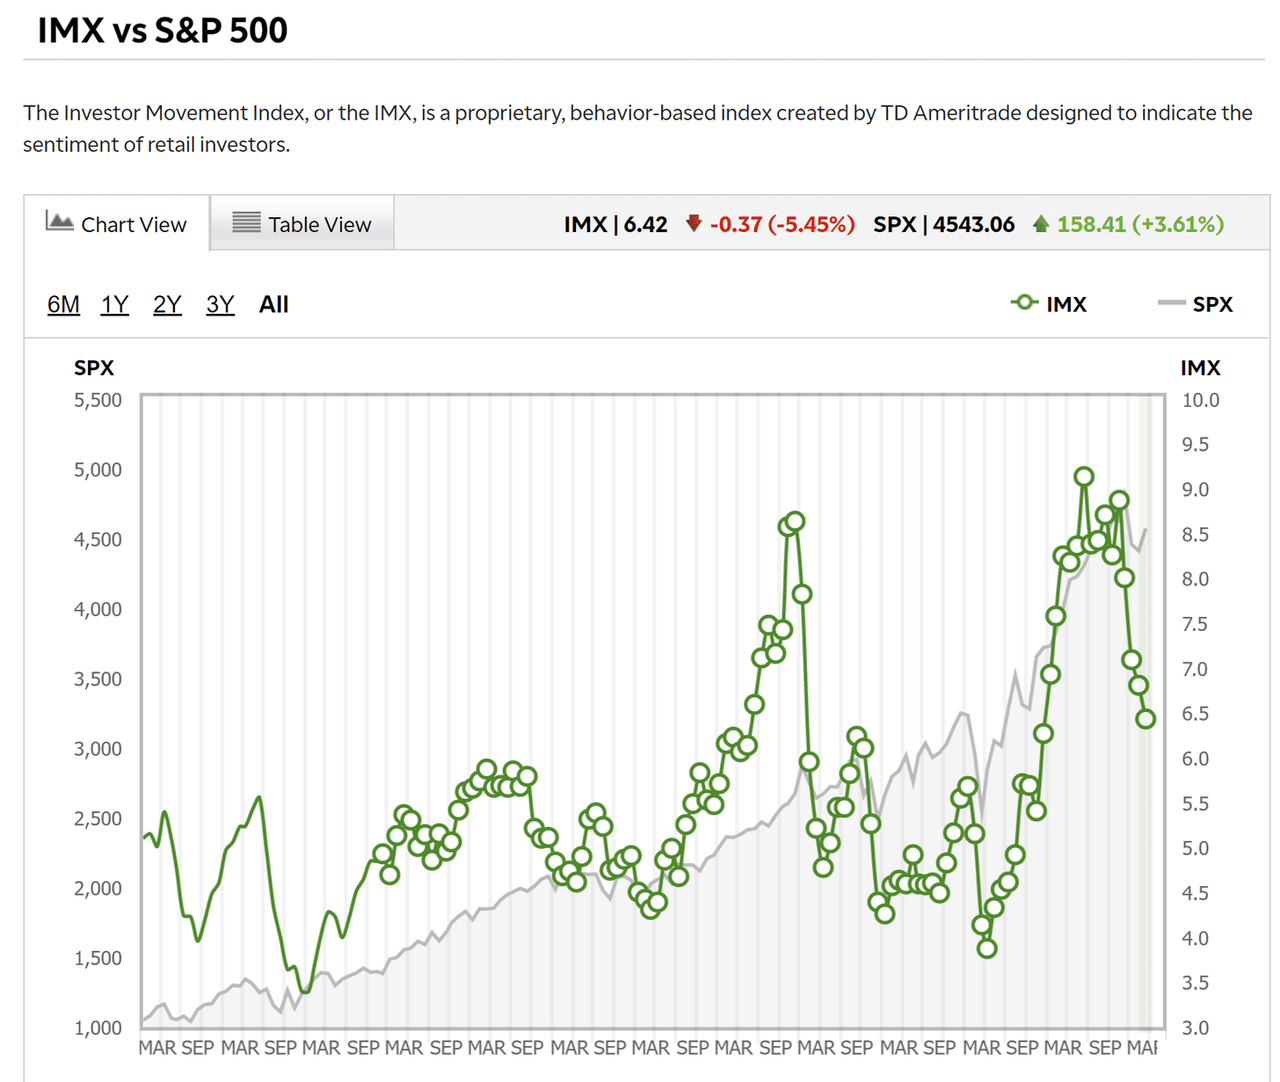
Source: TD Ameritrade Investor Movement Index
5. The hidden bear market… The headline index itself has not been much to get excited about either way, but under the surface there is a tell-tale sign of weakness and basically for all intents and purposes a hidden bear market.
@WillieDelwiche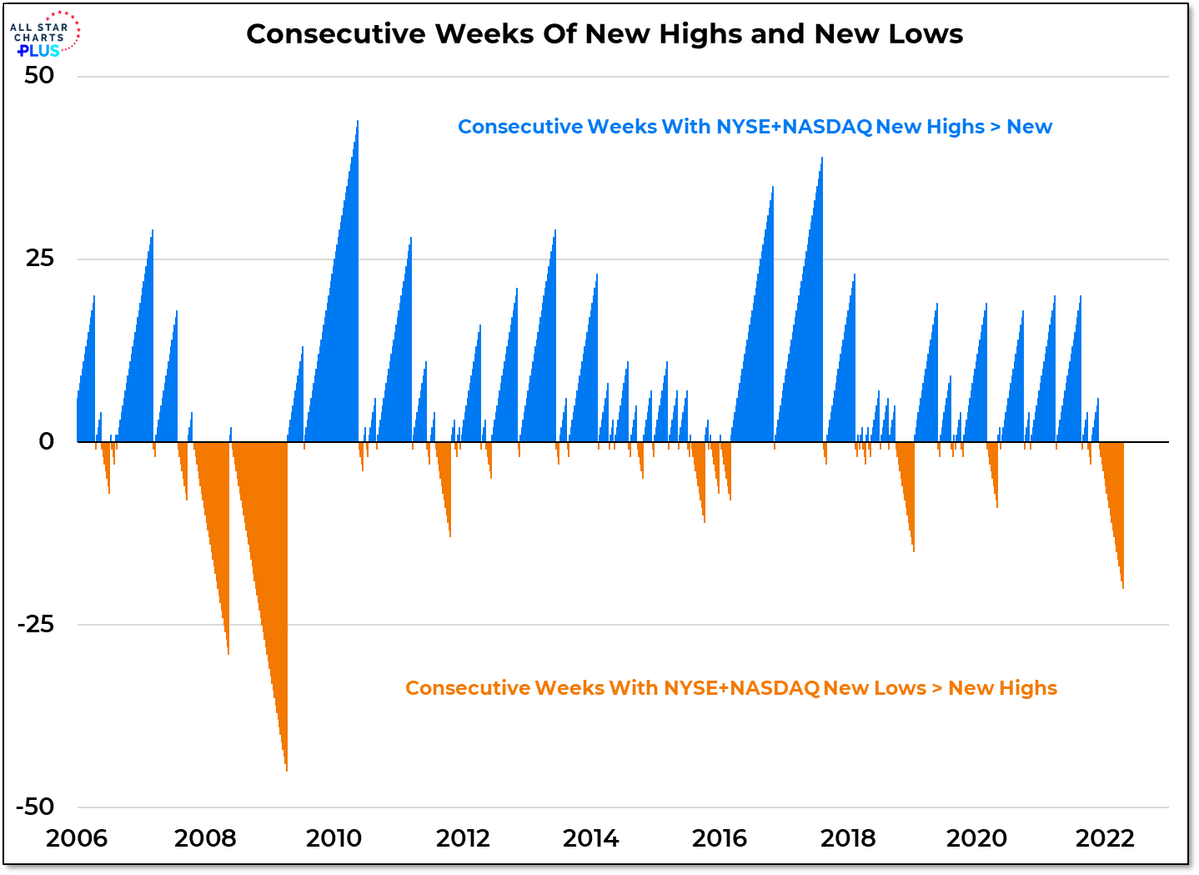
6. Utilities: Turns out Utilities… have utility in a down market.
(and extra informative that they are outperforming while bond yields are surging)
@honeystocks1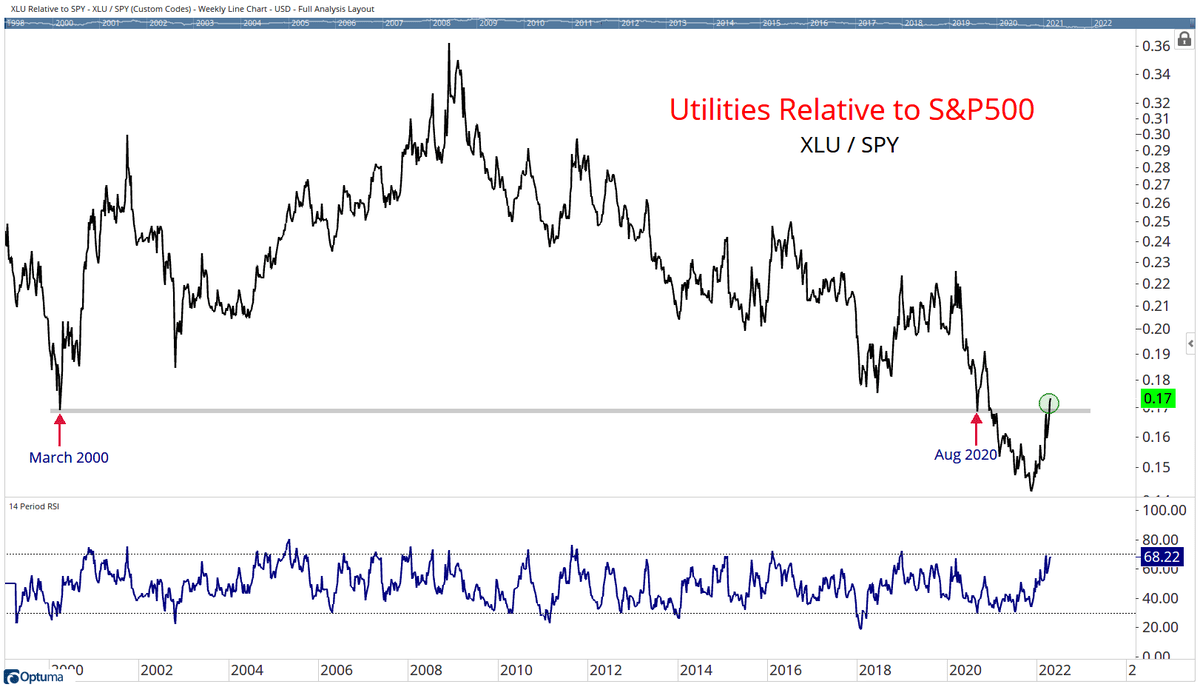
7. Agribusiness on the move: Agribusiness ETF breaking out vs the S&P500 after an extended period of chewing its cud, so to say.
@AdaptivCharts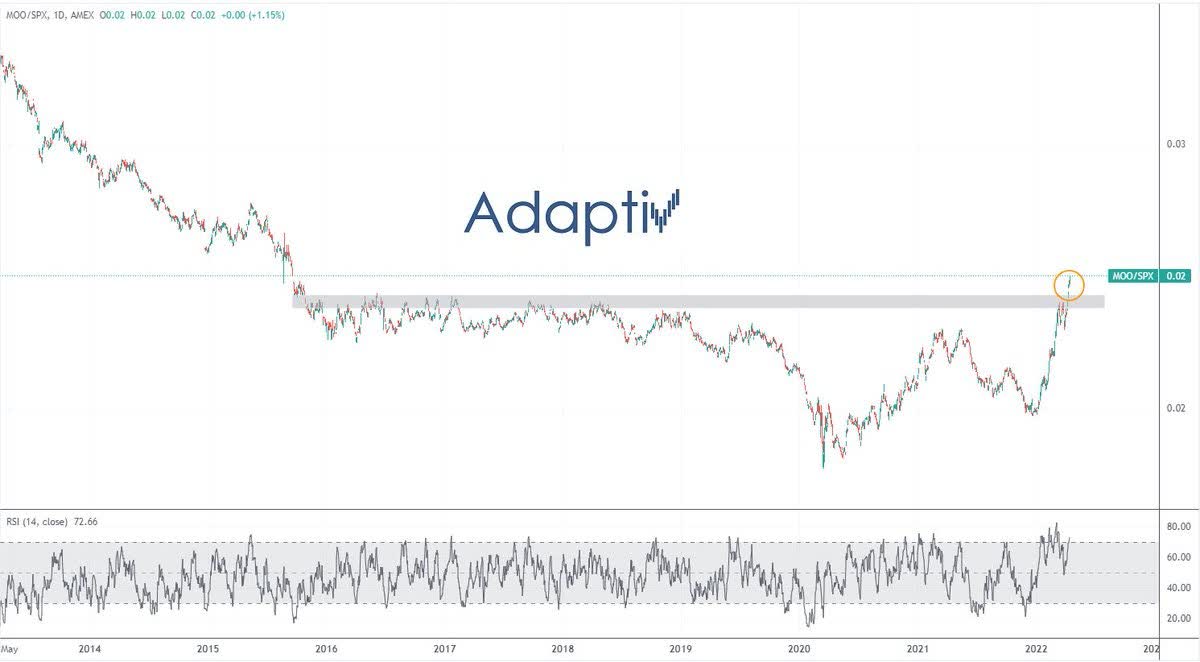
8. Supply/Cost Problems: The supposedly transitory problems of supply chain disruption/shortages/covid/rising costs are still to this day very clearly a major problem for business, based on what companies are saying during their earnings calls.
FactSet via @PriapusIQ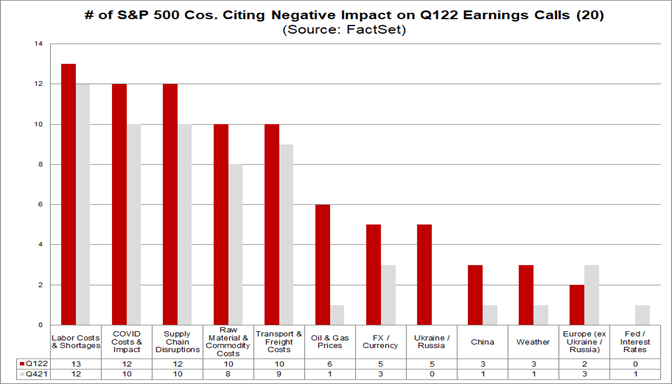
Source: FactSet
9. Economic Forecaster: The famous and clever Economist, Dr S&P500, is forecasting a slump in the ISM manufacturing PMI.
@t1alpha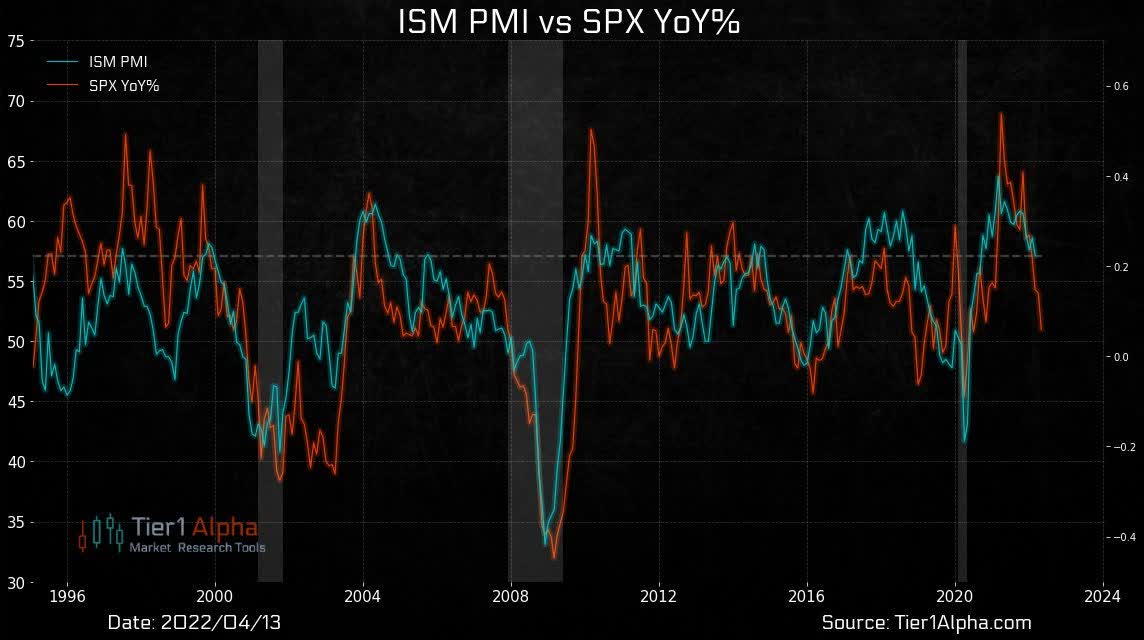
10. Asset Valuations: Commodities the least dirty shirt?
Topdown Charts, Refinitiv Datastream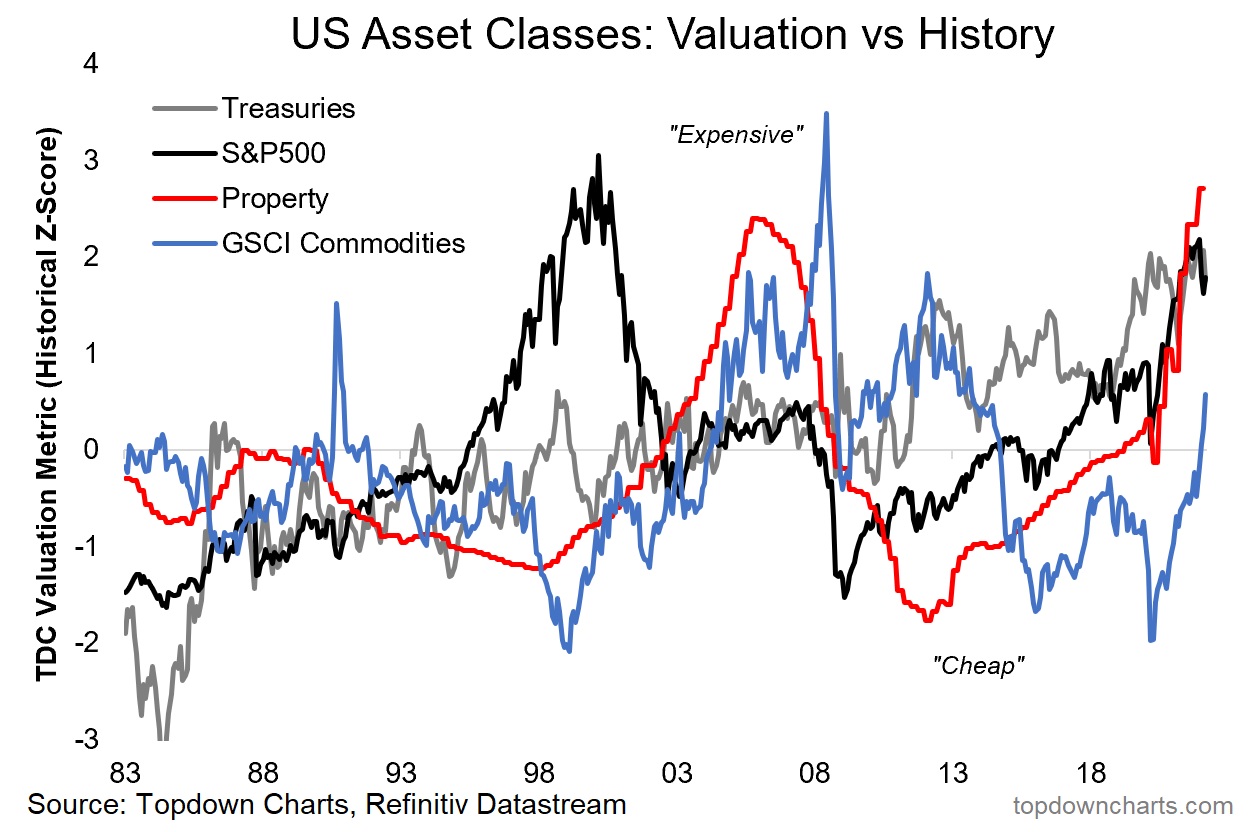
Source: @topdowncharts from The 12 Charts to Watch in 2022 [Q2 Update]
BONUS CHART >> got to include a goody for the goodies who subscribed.
Cyclicals vs Defensives: US cyclicals vs defensives have pushed deeper into new lows. Similarly, the gradual decline for EAFE has accelerated, and EM appear to have put in a lower high. All-up, around the world, cyclicals vs defensives have gone from a source of strength to a source of weakness.
Topdown Charts, Refinitiv Datastream, MSCI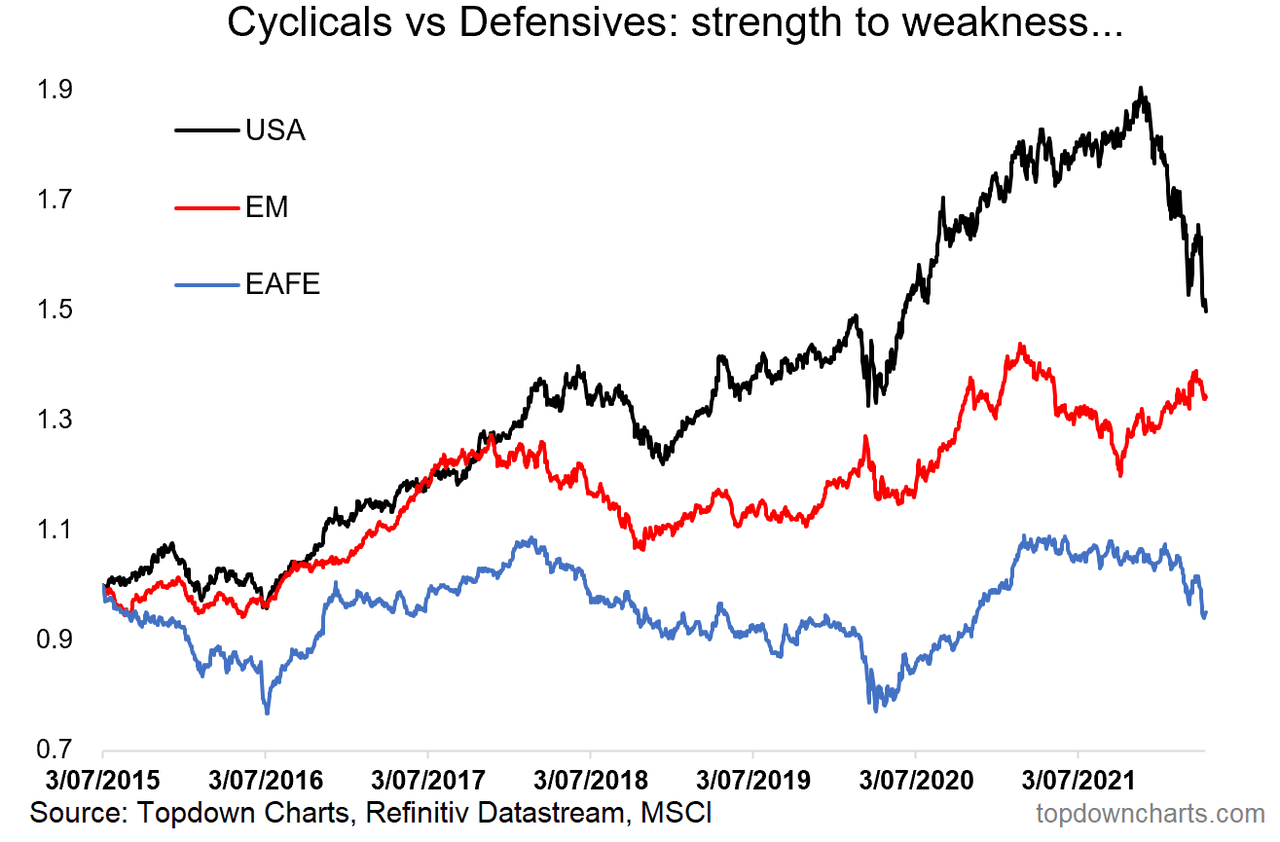
And when you zoom out at the global level it looks very clear: this is not a bullish chart. At best maybe markets go sideways, but this is not a situation where the macro/value backdrop is at best (expensive valuations, high inflation, stumbling growth, tightening monetary policy).
Topdown Charts, Refinitiv Datastream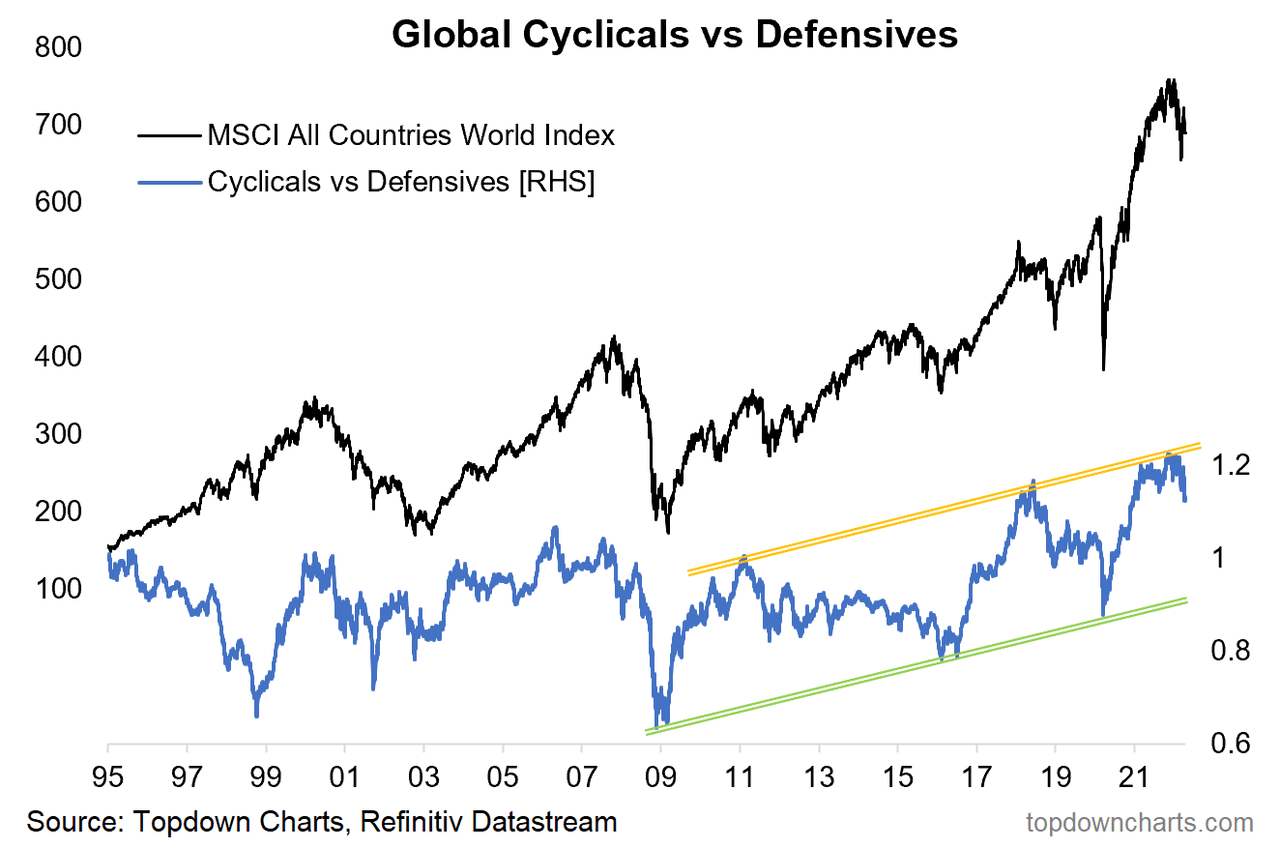
We’ve just been through a period of historical excess, and as the tides come in, so do they go out. Sorry if this is too bearish for you, but I just look at the charts and say what I see. When the facts change, my opinion will change.
Be the first to comment