

mrbfaust/iStock via Getty Images
Thesis
The ProShares UltraPro Short 20+ Year Treasury ETF (NYSEARCA:TTT) is an inverse ETF from the leverage product suite, seeking daily investment results that correspond to the -3x daily performance of the ICE U.S. Treasury 20+ Year Bond Index.
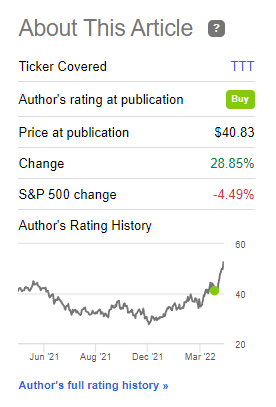
At the end of March we wrote an article detailing why we were assigning a Buy rating to TTT. The proposed trade is up more than 28% since our article, with 20-year yields having risen by more than 40 bps. Like any highly leveraged product, TTT is not a buy-and-hold investment, but rather a tool to be utilized in an aggressive tightening environment such as the one we are currently witnessing. A savvy investor needs to ensure that, like with any short term trading tool, they set profit targets and exit the trade when the target is met. TTT is not a buy and hold vehicle, exhibiting substantial negative total returns on both a 3- and 5-year basis.
Our initial target of a +30% return on the trade has now been met:
“If our target of 3.37% in 20-year rates is met, that means there are another 69 bps of rate increases to occur at the 20-year tenor point, which translates into another gain of ~+30% to be had in the ETF.“
Leveraged products work best to capture the bulk of a market move, not to squeeze every bp out of a point in the yield curve. We feel the bulk of the move in 20-year rates is now done, and while this point in the curve can widen further a more appropriate tool to utilize is the unleveraged version of TTT, namely the ProShares Short 20+ Yr Treasury ETF (TBF). We are therefore moving to Hold on TTT. Investors who believe there is still upside left in rates from this point on would be well advised to utilize the unleveraged version of the short 20 year ETF tools, namely TBF.
Performance
20-year rates have moved up significantly since our article, currently sitting at 3.09%:
20-Year Rates (The Fed)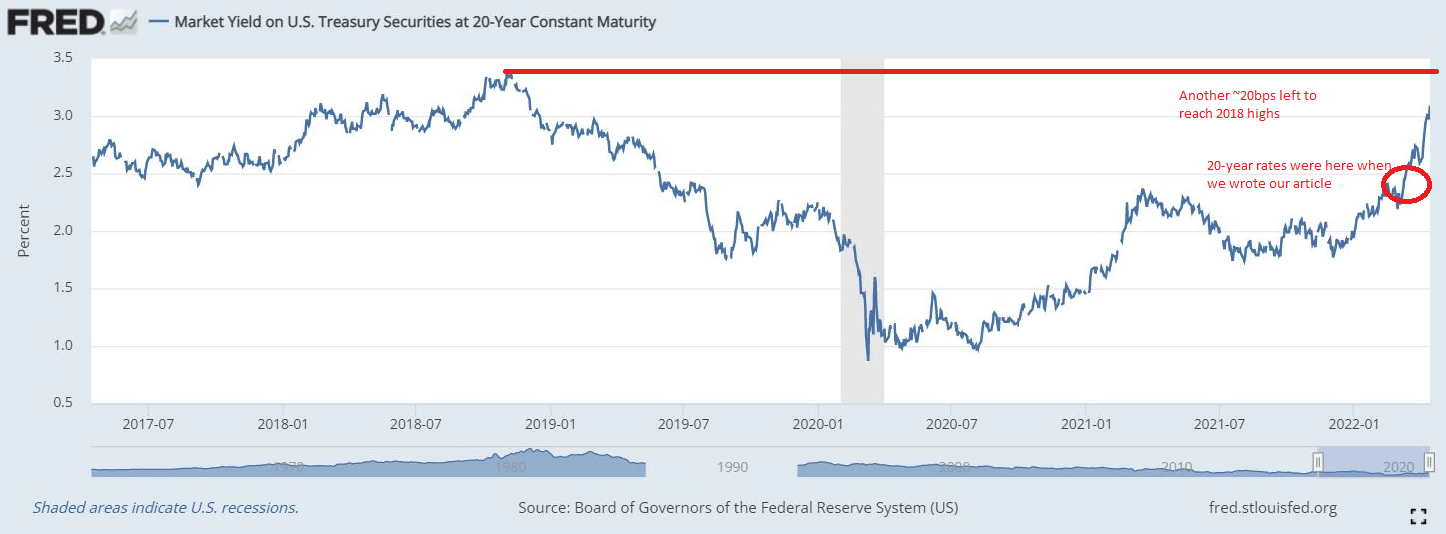
The premise of our original article was that we are going to revisit the 2018 highs in rates, specifically for this point in the yield curve. Given the aggressive recent repricing of the yield curve, we now only have approximately 20 bps left for the full retracement to occur.
TTT is up more than 70% year-to-date, and up more than 28% since our recommended Buy trade:
TTT Performance (Seeking Alpha) Author TTT Buy Rating (See)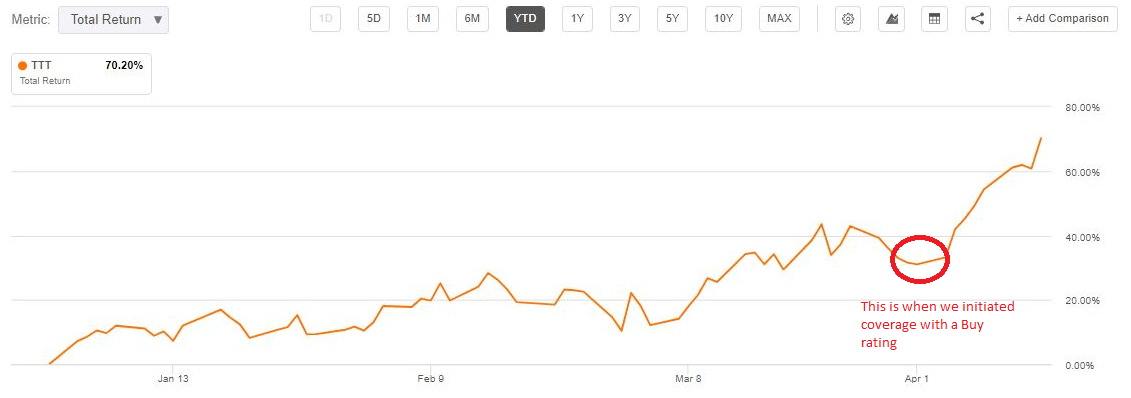
The returns are eye-watering and the reason for the massive move up in the ETF is the embedded leverage. Leverage magnifies returns, both on the way up as well as on the way down. We can see the effect of leverage when comparing TTT, a 3x leveraged product, with its unleveraged peer ProShares Short 20+ Yr Treasury (TBF):
TTT vs TBF (See)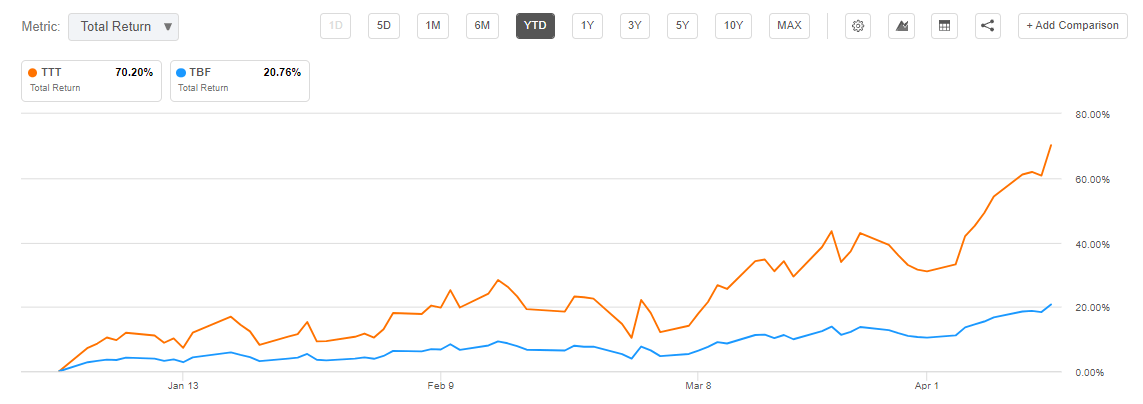
Inverse rates ETFs are great tools to be utilized in a tightening environment to hedge a portfolio that exhibits duration in both equities as well as fixed income format. However an investor needs to fully understand leveraged ETFs are not buy-and-hold vehicles, but only short term trading tools. The best way for a sophisticated investor to utilize such a tool is to set a profit target and promptly exit the trade when the target is met. A retracement of some of the move in rates can eliminate a substantial portion of the profit fairly fast given the embedded leverage in the product.
Holdings
The ETF contains only treasury securities and is credit risk free:
Top Holdings (Seeking Alpha)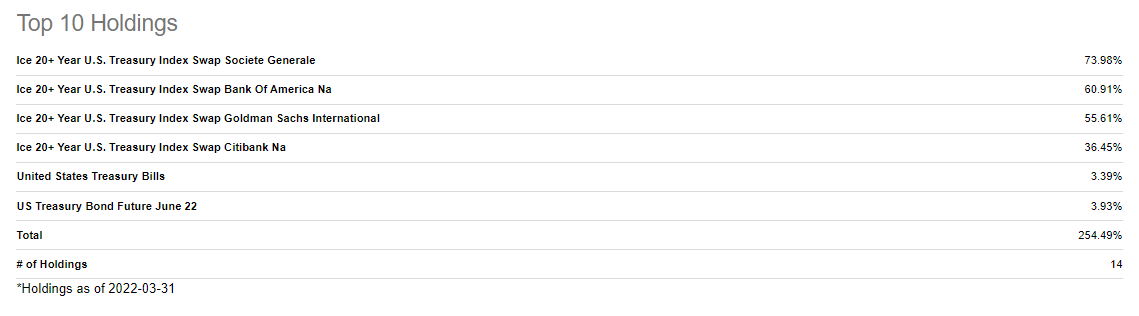
Through its make-up the fund is set to mimic the index, exhibiting a very large duration:
Fund Duration (Fund Fact Sheet)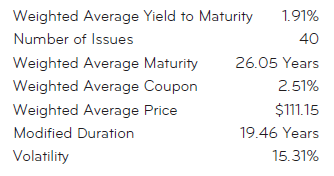
Market Developments
Since our last article the market has aggressively changed its stance, now seeing several 50 bps rate hikes by the Fed this year. Nomura is now pricing the Fed hikes as follows, with most of the Fed tightening to be done by early 2023:
Market Implied Fed hikes (Nomura)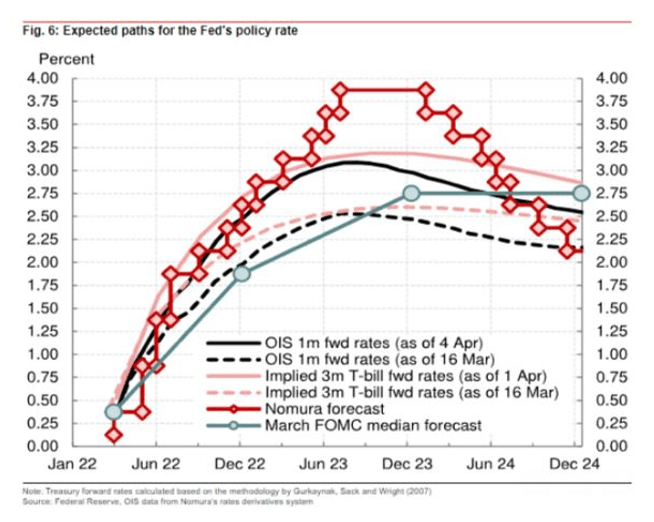
When looking at the above graph the best visual for the shift in sentiment is represented by the OIS curve. A reader can observe how the March 16 OIS 1m fwd rates curve peaks at a 2.5% level and then levels off and decreases. Given the latest readings on inflation and the Fed rhetoric we can see how the April 4 OIS 1m fwd rates curve now shifts up by 50 bps peaking at 3%.
Conclusion
TTT is an ETF which provides for a -3x return of the long dated part of the yield curve, namely the 20-year point. We wrote an article in March where we detailed why we thought 20-year yields are going to retrace the 2018 move and shift over the 3% mark. With the bulk of the move now done on the back of a very aggressive Fed we feel using a 3x leveraged product like TTT is no longer prudent. We are therefore moving to Hold on TTT. Investors who believe there is still upside left in rates from this point on would be well advised to utilize the unleveraged version of the short 20 year ETF tools, namely TBF.
Be the first to comment