

Diego Thomazini
Author’s note: This article was released to CEF/ETF Income Laboratory members on September 21, 2022. Please check latest data before investing.
The Weekly Closed-End Fund Roundup will be put out at the start of each week to summarize recent price movements in closed-end fund [CEF] sectors in the last week, as well as to highlight recently concluded or upcoming corporate actions on CEFs, such as tender offers. Data is taken from the close of Friday, September 16th, 2022.
Weekly performance roundup
0 out of 23 sectors were positive on price (down from 14 last week) and the average price return was -3.43% (down from +0.78% last week). The lead gainer was Commodities (-0.20%) while Real Estate lagged (-6.29%).
Income Lab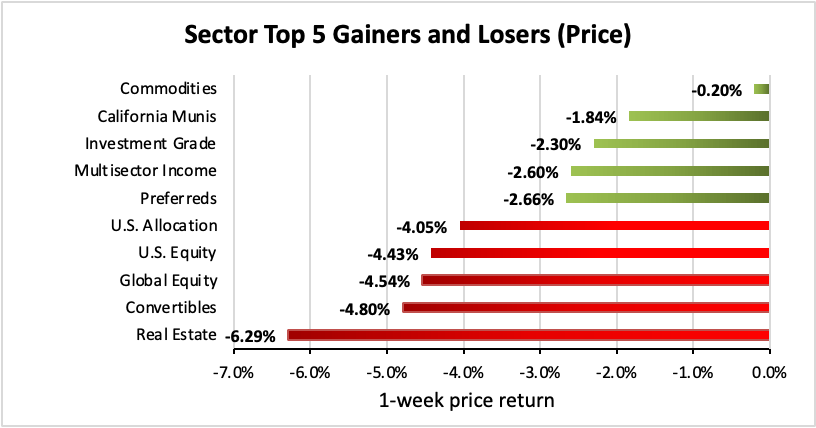
1 out of 23 sectors were positive on NAV (down from 16 last week), while the average NAV return was -2.33% (down from +1.14% last week). The top sector by NAV was Commodities (+0.30%) while the weakest sector by NAV was Real Estate (-5.86%).
Income Lab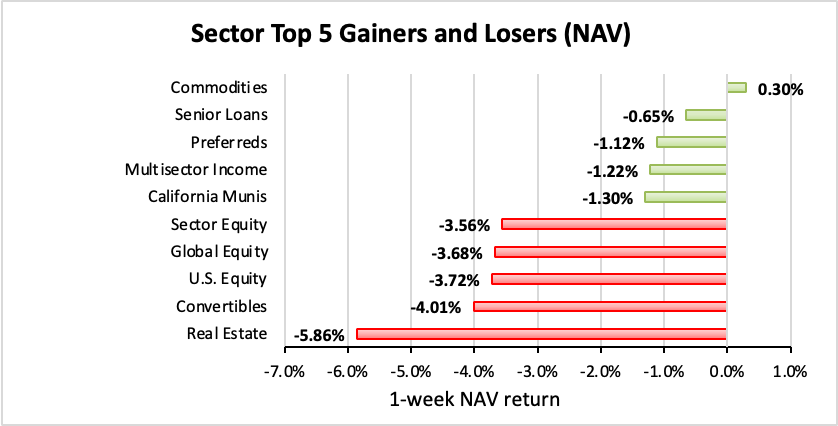
The sector with the highest premium was Covered Call (+0.76%), while the sector with the widest discount is MLPs (-15.39%). The average sector discount is -5.29% (down from -3.96% last week).
Income Lab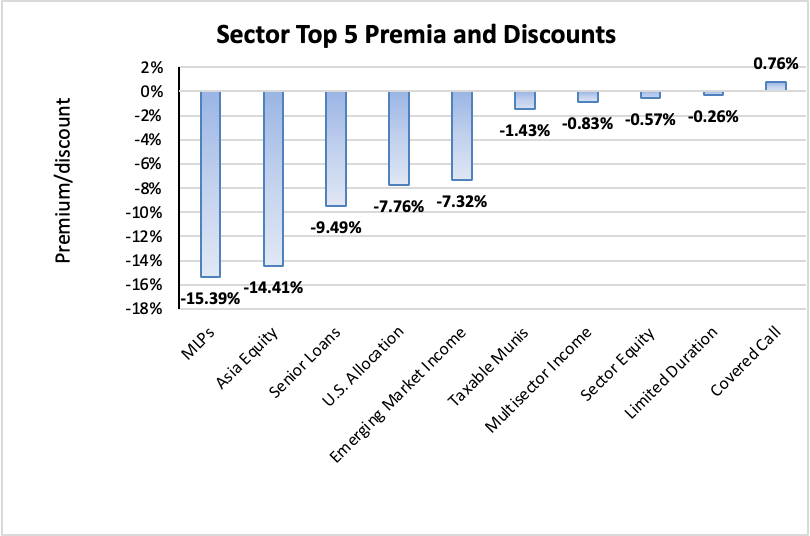
The sector with the highest premium/discount increase was Sector Equity (+0.67%), while Single-State Munis (-2.47%) showed the lowest premium/discount decline. The average change in premium/discount was -0.85% (down from +0.42% last week).
Income Lab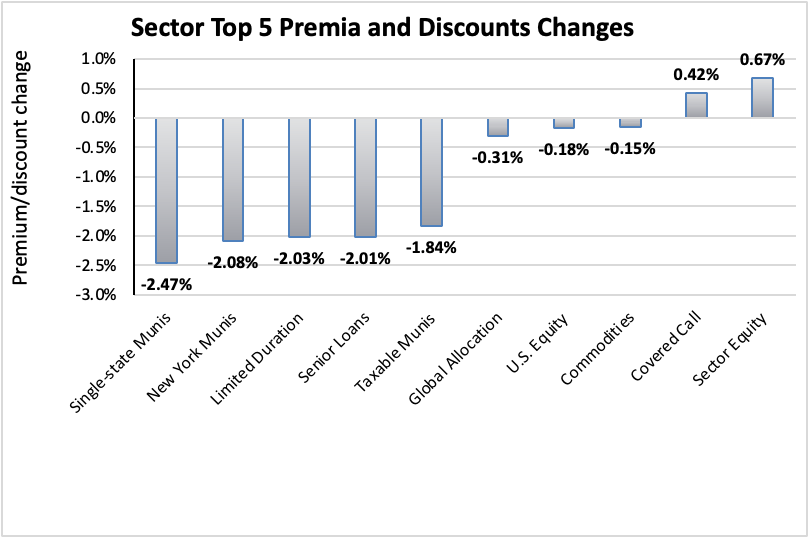
The sector with the highest average 1-year z-score is Covered Call (+0.79), while the sector with the lowest average 1-year z-score is Preferreds (-1.31). The average z-score is -0.36 (down from -0.12 last week).
Income Lab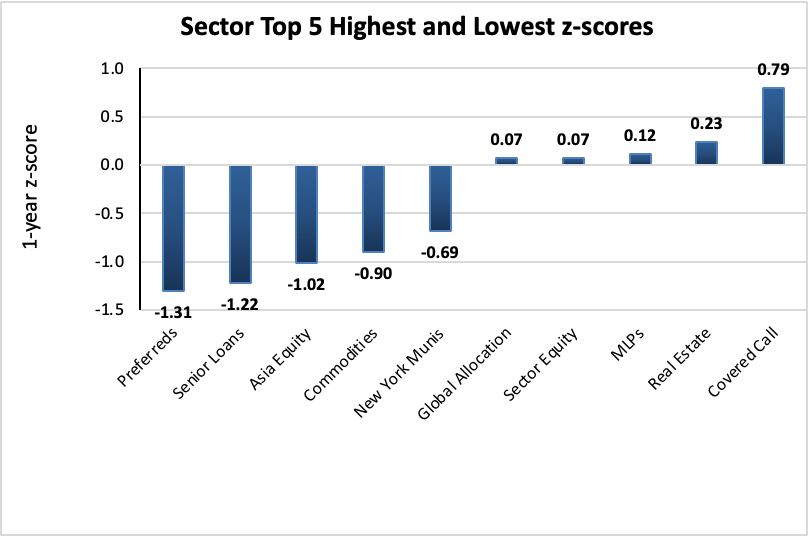
The sectors with the highest yields are Asia Equity (14.55%), Global Equity (12.25%), and Emerging Market Income (11.87%). Discounts are included for comparison. The average sector yield is +8.69% (up from +8.20% last week).
Income Lab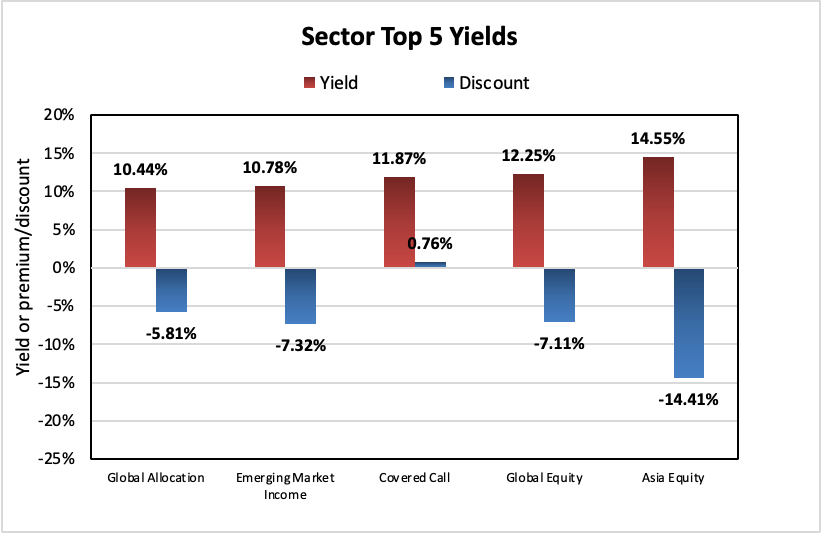
Individual CEFs that have undergone a significant decrease in premium/discount value over the past week, coupled optionally with an increasing NAV trend, a negative z-score, and/or are trading at a discount, are potential buy candidates.
| Fund | Ticker | P/D decrease | Yield | P/D | z-score | Price change | NAV change |
| BlackRock VA Municipal Bond | (BHV) | -9.78% | 4.40% | 1.64% | -1.3 | -9.82% | -1.13% |
| PIMCO NY Municipal Income | (PNF) | -9.06% | 5.59% | 1.12% | 0.3 | -9.45% | -1.33% |
| Eagle Point Credit Company LLC | (ECC) | -8.71% | 14.97% | 2.68% | -0.7 | -4.83% | 4.43% |
| Invesco Municipal Inc Opp I | (OIA) | -7.76% | 5.43% | -0.32% | 0.1 | -8.67% | -1.55% |
| PIMCO NY Municipal Income III | (PYN) | -6.79% | 5.63% | 10.83% | 0.6 | -7.00% | -1.30% |
| Eagle Point Income Co Inc | (EIC) | -5.85% | 9.86% | 11.57% | 1.0 | -8.37% | 2.25% |
| Nuveen VA Quality Muni Inc | (NPV) | -5.52% | 4.51% | 9.82% | 1.3 | -6.27% | -1.54% |
| John Hancock Hedged Equity & Income Fund | (HEQ) | -5.40% | 9.91% | 2.00% | 0.5 | -7.14% | -2.21% |
| PIMCO NY Municipal Income II | (PNI) | -5.27% | 5.82% | -2.25% | -0.1 | -6.46% | -1.40% |
| RiverNorth Opp Muni Income Fund Inc | (RMI) | -5.26% | 7.61% | -5.31% | -0.5 | -7.00% | -1.81% |
Income Lab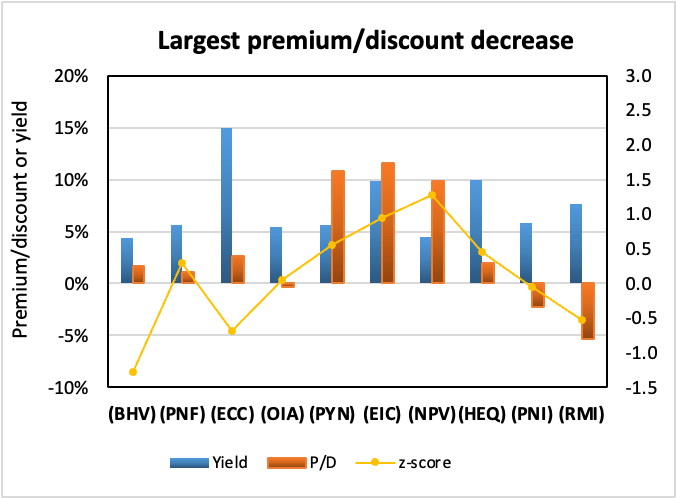
Conversely, individual CEFs that have undergone a significant increase in premium/discount value in the past week, coupled optionally with a decreasing NAV trend, a positive z-score, and/or are trading at a premium, are potential sell candidates.
| Fund | Ticker | P/D increase | Yield | P/D | z-score | Price change | NAV change |
| MQ/FT Global Infrast Util Div&Inc | (MFD) | 9.25% | 8.21% | 2.96% | 5.8 | 6.92% | -2.67% |
| The Central and Eastern Europe Fund | (CEE) | 8.07% | 11.42% | 39.37% | 0.8 | 3.55% | -2.44% |
| Gabelli Utility Trust | (GUT) | 5.21% | 7.82% | 99.74% | 1.2 | -2.17% | -4.71% |
| Gabelli Multimedia | (GGT) | 5.09% | 12.14% | 67.05% | 2.6 | -7.17% | -8.82% |
| Nuveen S&P 500 Dynamic Overwrite | (SPXX) | 5.08% | 7.29% | 6.63% | 3.7 | -1.73% | -5.77% |
| DNP Select Income | (DNP) | 4.61% | 6.95% | 16.41% | 1.1 | 0.27% | -3.70% |
| FOXBY CORP | (OTCPK:FXBY) | 4.48% | 15.63% | -29.82% | 0.6 | 0.00% | -6.37% |
| CBRE Global Real Estate Income | (IGR) | 4.08% | 10.10% | 0.00% | 2.4 | -2.46% | -6.43% |
| RENN Fund ord | (RCG) | 3.93% | % | -3.93% | -0.3 | 1.20% | 0.00% |
| EV Tax-Managed Buy-Write Strategy Fund | (EXD) | 3.45% | 8.35% | 7.27% | 1.9 | -1.07% | -2.05% |
Income Lab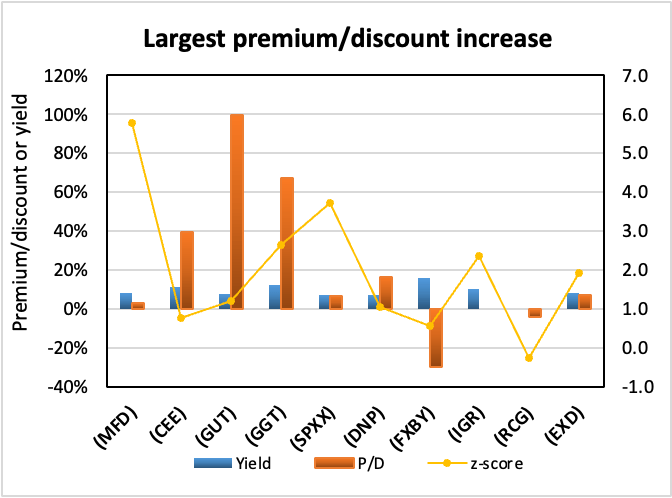
Recent corporate actions
These are from the past month. Any new news in the past week has a bolded date:
September 19, 2022 | Virtus Total Return Fund Inc. Completes Rights Offering.
Upcoming corporate actions
These are from the past month. Any new news in the past week has a bolded date:
September 8, 2022 | BlackRock Corporate High Yield Fund, Inc. Announces Terms of Rights Offering.
September 1, 2022 | SALIENT MIDSTREAM & MLP FUND ANNOUNCES SHAREHOLDER APPROVAL OF REORGANIZATION WITH SALIENT MLP & ENERGY INFRASTRUCTURE FUND.
August 11, 2022 | Abrdn’s U.S. Closed-End Funds Announce Special Shareholder Meetings Relating to Proposed Acquisition of Assets of Four Delaware Management Company-Advised Closed-End Funds.
August 11, 2022 | RiverNorth/DoubleLine Strategic Opportunity Fund, Inc. Announces Transferable Rights Offering.
Recent activist or other CEF news
These are from the past month. Any new news in the past week has a bolded date:
August 4, 2022 | Saba Capital Reaches Agreement Regarding Salient Midstream & MLP Fund.
Commentary
2. OPP rights offering expires
(Note: this section has been updated to reflect the expiration of the offer)
The rights offering for RiverNorth/DoubleLine Strategic Opportunity Fund’s (OPP) has expired on September 23, 2022. To recap, this was a transferable 1-for-3 rights offering with the subscription price being the higher of 92.5% of NAV or 95% of the average closing market price in the final 5 days of the offering. This meant that there was a floor to the subscription price at a -7.5% discount, limiting the maximum extent of dilution (–1.88% assuming full subscription).
We discussed the offering shortly after it was announced in previous CEF Weekly Roundup. We wrote a month ago:
How much lower will OPP go? As we’ve previously observed, the “floor” of the subscription formula can act as a magnet drawing the discount of the fund below it, but we shouldn’t expect the discount to breach the floor in normal circumstances. The floor for this year’s offering is a -7.5% discount, while OPP’s current discount is -3.23%. Hence, I don’t expect a huge ex-rights date drop, but it is possible for the discount to widen a few points further during the offering period.
It turns out that that prediction was accurate on both counts. The ex-rights date drop was relatively mild (from $10.72 to $10.50, or -2.1%), yet OPP’s discount has continued to widen and currently sits at -6.50%, only 1% higher than the -7.5% discount floor. As a result of the widening discount, OPP’s price has underperformed its NAV, lending further credence to the “sell and rebuy” strategy for CEF rights offerings.
YCharts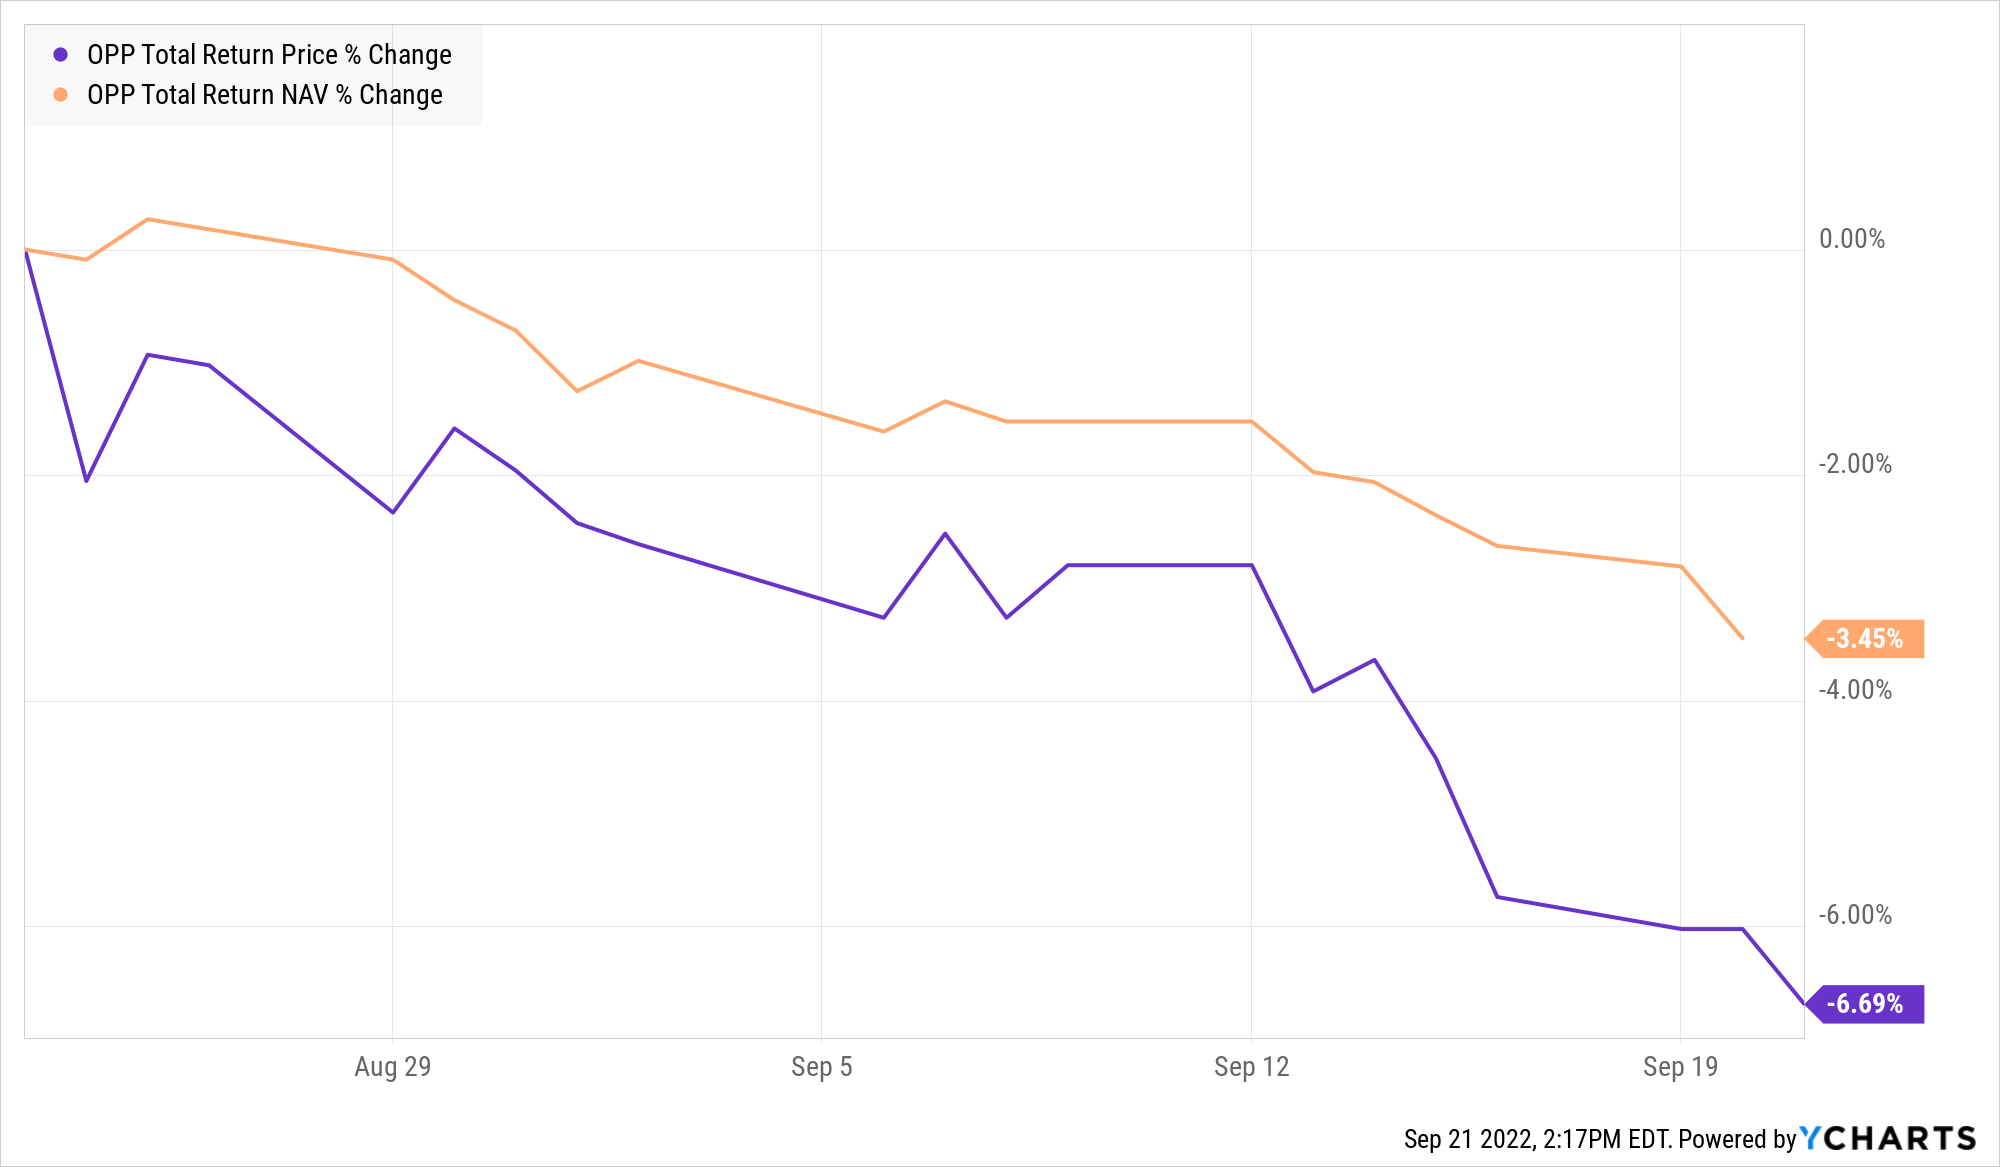
As OPP’s discount approaches the subscription price floor, it became less and less attractive to subscribe as the discount to the market price became slimmer and slimmer. Consistent with this, OPP’s transferable rights also declined in value towards the end of the offering.
It turned out that OPP closed at exactly the -7.5% discount floor on the expiry date of September 23. As a result, the subscription price of $9.70 was identical to the closing price of that day, meaning that there was no benefit to subscribing. It could have been worse though; had OPP dropped below a -7.5% discount, subscribers to the offering would have gotten a worse price than simply buying the fund on the open market at the close.
Be the first to comment