

OxAvdeenko
The next phase of the battle over the status and rights of gig workers is getting underway, and Uber (NYSE:UBER) is one of the companies for which the outcomes are of considerable importance. Uber and other gig work companies rely on the ability to classify their workers as independent contractors rather than employees, which dramatically reduces costs, taxes, and regulatory oversight for the companies. The new rules proposed by the DOL are unlikely to have immediate consequences (also see here) for Uber, but the stock price took a big hit as the news of the changes emerged. UBER closed at $27.53 on Monday, October 10th, but dropped down to almost $23 on Tuesday, as the market tried to process the potential changes to gig work business models. UBER ended the week at $24.71, down 10% from Monday’s closing price.
12-Month price history and basic statistics for UBER (Source: Seeking Alpha)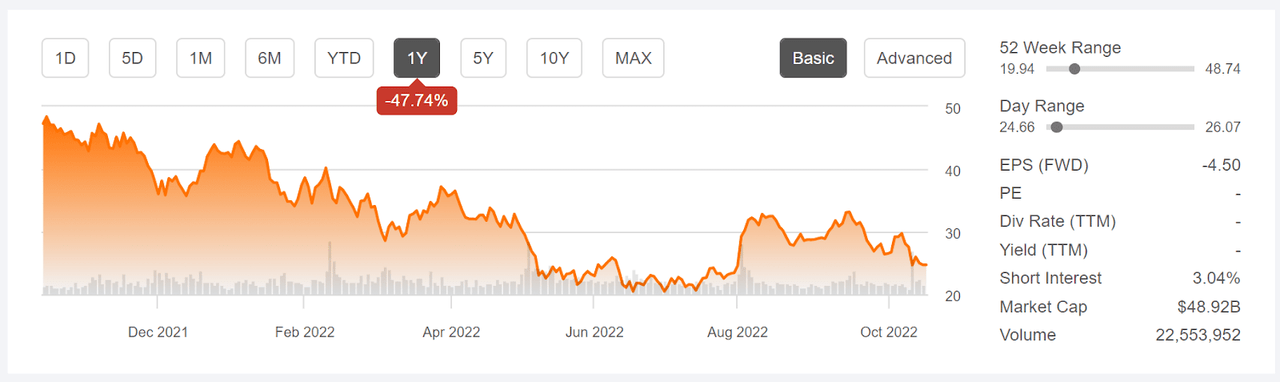
Even after last week’s decline, UBER is trading almost 21% above the 12-month low closing price of $20.47 on June 16th. The shares have fallen 25.2% over the last month and 47.7% over the past 12 months.
The potential costs associated with worker classification are just one of Uber’s substantial challenges. Customers are unhappy because of the rapid gains in the costs of getting a ride. High prices for gasoline have raised overhead costs for drivers, even with fuel surcharges. Uber has been successful in recruiting more drivers to the platform in recent months, which should bring down the costs of trips because the company uses a dynamic pricing model (aka surge pricing) in which fares decline as the number of available drivers increases. The problem with surge pricing, however, is that riders face considerable uncertainty in the fares that they can expect to pay from day to day, although Uber provides an upfront price when a ride is ordered. Uber is also contending with legal action from riders who say that they were sexually assaulted by drivers.
UBER’s earnings for 2022 have been surprisingly bad, starting with a massive earnings miss for Q1 (although revenues beat expectations). The consensus estimated EPS for Q1 was -$0.21 per share and the actual EPS was -$3.03. Q2 EPS was also substantially worse than expectations (-$1.3 reported vs. -$0.26 expected). Q3 results will be reported on November 1st. Although the consensus estimates for EPS in the coming quarters are somewhat encouraging, the large disconnect between expected and realized earnings in recent quarters suggest that some skepticism is warranted with regard to the analyst outlook.
Historical (3 years) and estimated future quarterly EPS for UBER. Green (red) values are amounts by which quarterly EPS beat (missed) the consensus expected value (Source: ETrade)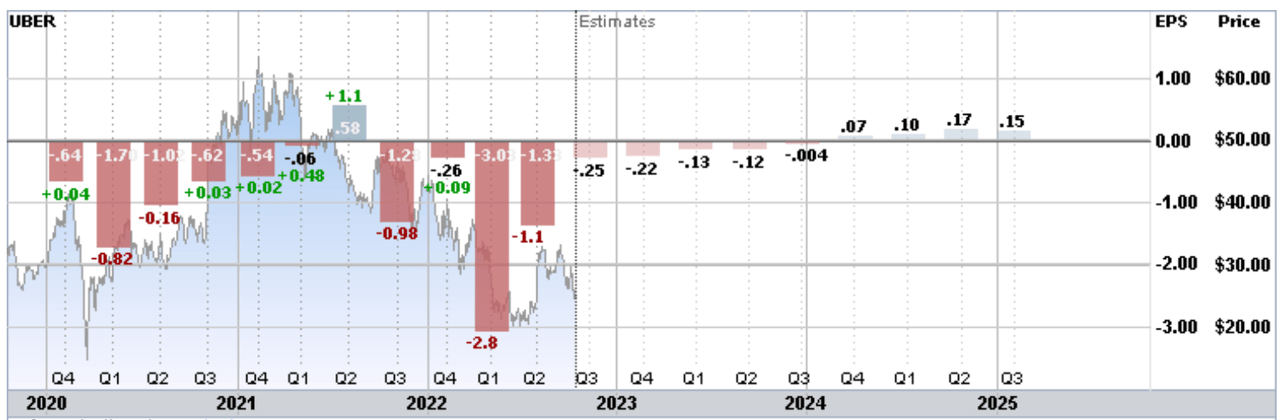
I last analyzed UBER on May 16th, 5 months ago, and I downgraded UBER from neutral / hold to bearish / sell. At that time UBER was trading at $24.49, slightly below the current price of $24.71. At that time, the Wall Street consensus rating on UBER was a buy and the consensus 12-month price target was more than double the prevailing share price. One concern, not least because of the huge difference between expected and realized Q1 earnings, was that the analysts were collectively too optimistic about the company’s growth trajectory. A related concern was the wide dispersion among the individual analyst price targets. A research study found that there was a negative correlation between the return implied by the consensus price target and subsequent realized returns when this dispersion was high. On the basis of these research findings, the high consensus price target combined with the large dispersion would actually be a bearish indicator for UBER. When analyzing a stock, I also rely on the market-implied outlook, a probabilistic price forecast that represents the consensus view among buyers and sellers of options, as reflected in options prices. The market-implied outlook for UBER to mid-January of 2023 was substantially bearish, with expected volatility of 60%. This outlook was similar to the outlook from my earlier analysis in October of 2021.
For readers who are unfamiliar with the market-implied outlook, a brief explanation is needed. The price of an option on a stock is largely determined by the market’s consensus estimate of the probability that the stock price will rise above (call option) or fall below (put option) a specific level (the option strike price) between now and when the option expires. By analyzing the prices of call and put options at a range of strike prices, all with the same expiration date, it is possible to calculate a probabilistic price forecast that reconciles the options prices. This is the market-implied outlook. For a deeper explanation and background, I recommend this monograph published by the CFA Institute.
With UBER’s Q3 results coming at the start of November, along with the market trying to process the recent DOL proposal, I have calculated updated market-implied outlooks for UBER and compared these with the current Wall Street consensus outlook in revisiting my overall rating.
Wall Street Consensus Outlook for UBER
ETrade calculates the Wall Street consensus outlook for UBER by aggregating the views of 23 ranked analysts who have published price targets and ratings over the past 3 months. The consensus rating is a buy and the consensus 12-month price target is 92.2% above the current share price. The spread among the individual price targets continues to be high, reducing confidence in the predictive value of the consensus. As a rule of thumb, I strongly discount the consensus price target when the highest individual price target is more than twice the lowest. This ratio is 2.3 for UBER ($75 / $32). The consensus rating has been a buy for all of the past 12 months.
Wall Street analyst consensus rating and 12-month price target for UBER (Source: ETrade)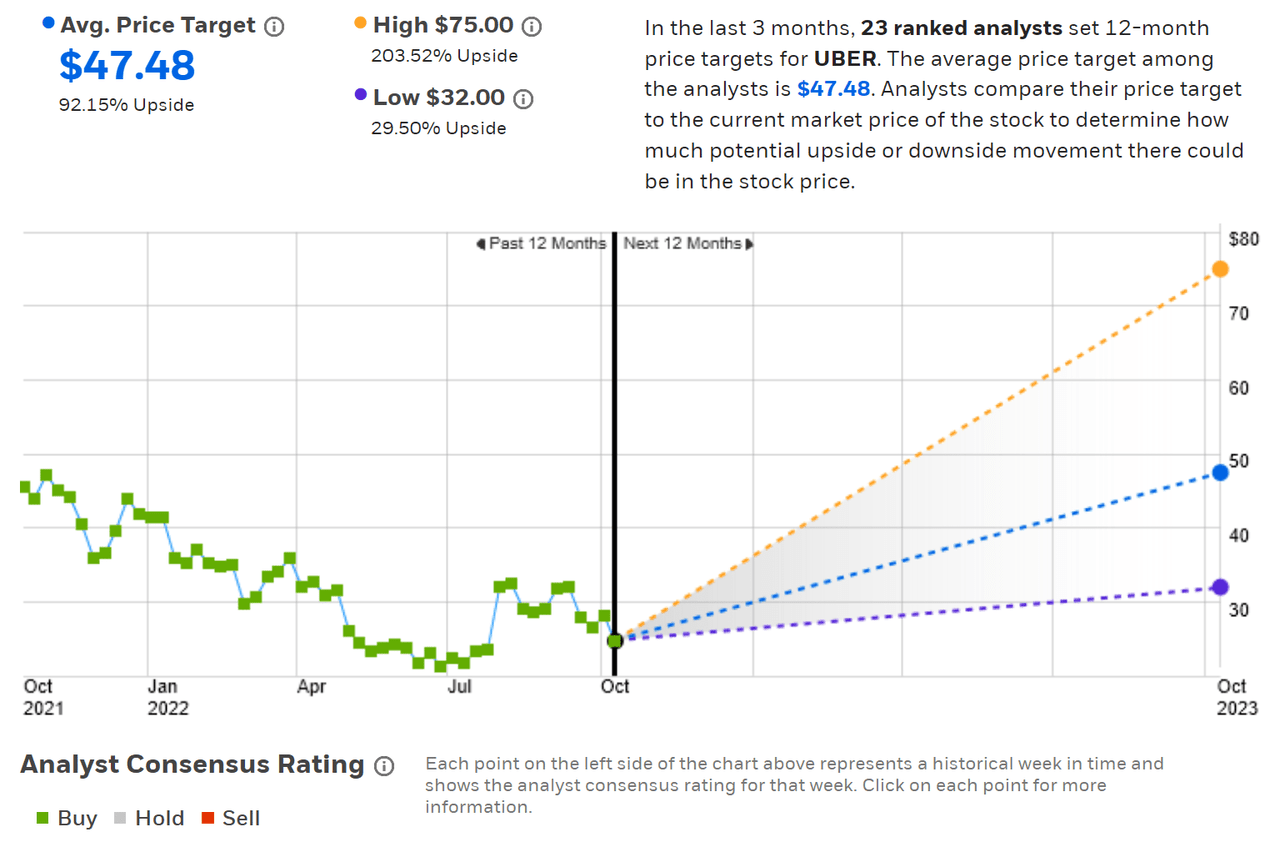
Seeking Alpha’s version of the Wall Street consensus outlook is based on price targets and ratings from 46 analysts who have published their views within the past 90 days. The consensus rating is a strong buy and the consensus 12-month price target is 88.1% above the current share price. It is notable that the consensus rating changed from a buy to a strong buy on December 3, 2021, when the shares were trading at $35.85, 45% above the current level.
Wall Street analyst consensus rating and 12-month price target for UBER (Source: Seeking Alpha)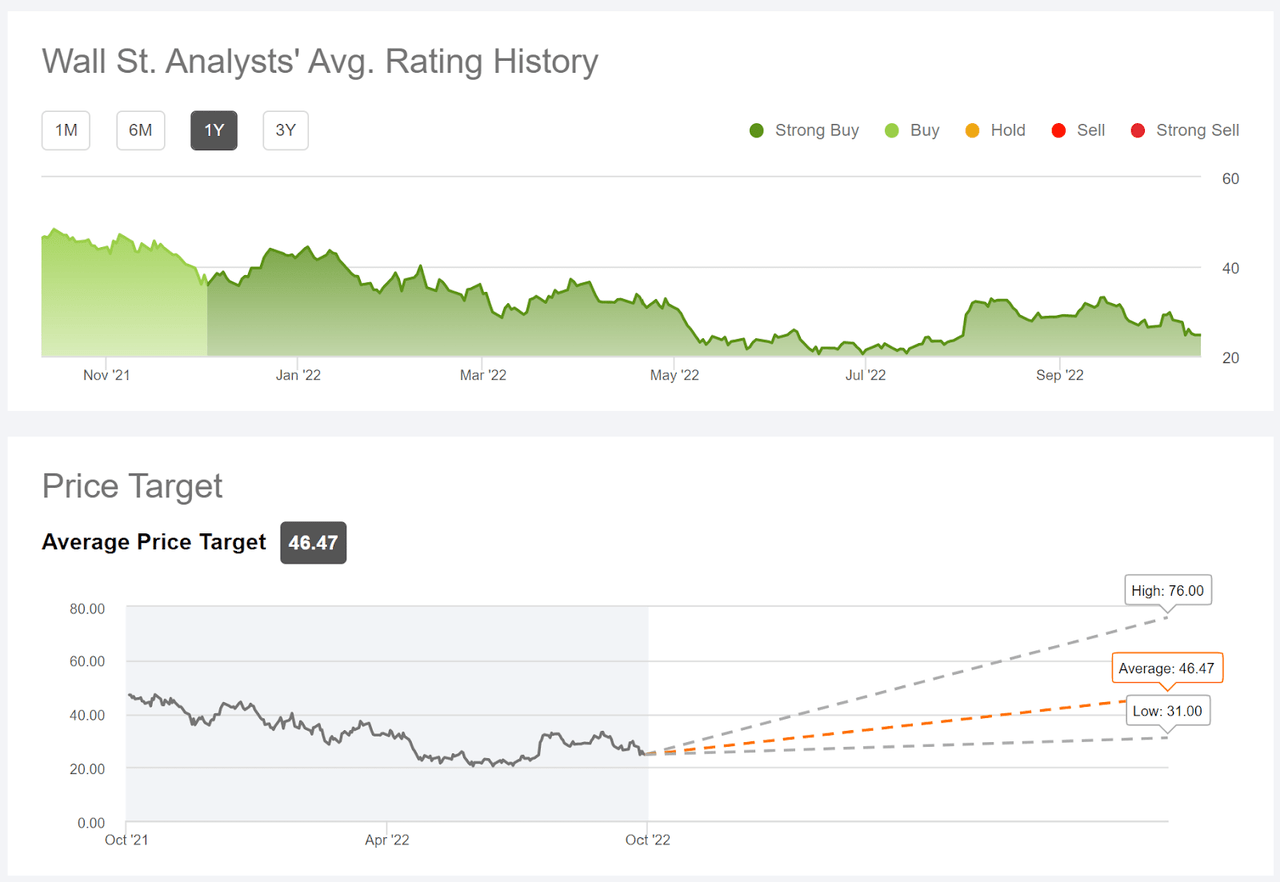
I am concerned that the prevailing Wall Street view is simply too optimistic about UBER’s growth prospects and the unwavering bullish consensus outlook over the past year is consistent with this view. In addition, the high dispersion in the individual price targets is a red flag.
Market-Implied Outlook for UBER
I have calculated the market-implied outlook for UBER for the 3.1-month period from now until January 20, 2023 and for the 8-month period from now until June 16, 2023, using the prices of call and put options that expire on these dates. I selected these specific expiration dates to provide a view through the end of 2022 and to the middle of 2023. In addition, the options that expire in January and June tend to be among the most liquid, adding confidence in the representativeness of the outlooks.
The standard presentation of the market-implied outlook is a probability distribution of price return, with probability on the vertical axis and return on the horizontal.
Market-implied price return probabilities for UBER for the 3.1-month period from now until January 20, 2023 (Source: Author’s calculations using options quotes from ETrade)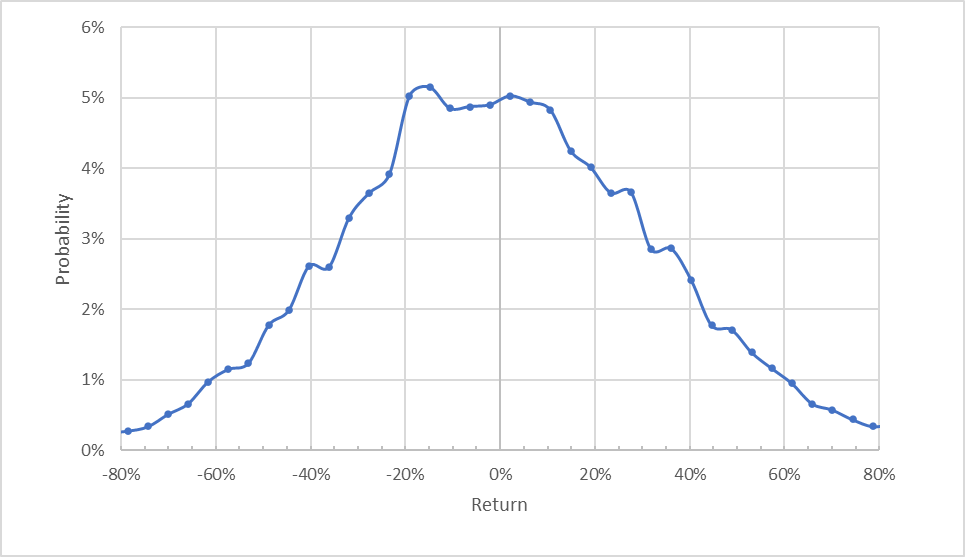
The market-implied outlook for the next 3.1 months is generally symmetric, although the peak in probabilities (the most-probable outcomes) is slightly shifted to favor negative returns. The expected volatility calculated from this distribution is 69% (annualized), as compared to 60% in my May analysis, an increase of 15%. Overall market volatility (VIX) is up 16% since May 16th.
To make it easier to compare the relative probabilities of positive and negative returns, I rotate the negative return side of the distribution about the vertical axis (see chart below).
Market-implied price return probabilities for UBER for the 3.1-month period from now until January 20, 2023. The negative return side of the distribution has been rotated about the vertical axis (Source: Author’s calculations using options quotes from ETrade)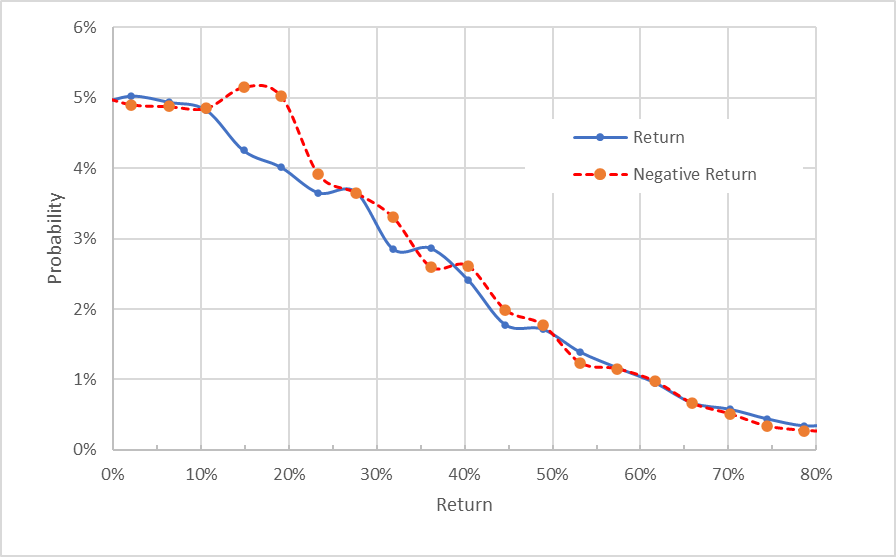
The probabilities of a range of medium-sized negative returns are higher than the probabilities of positive returns of the same magnitude (the dashed red line is above the solid blue line for returns from 10% to 20% on the chart above). To be clear, this chart suggests that the probability of having a return in the range of -10% to -25% is higher than that probability of having a return in the range of +10% to +25%. Outside of this range, the probabilities of positive and negative returns match very closely. The maximum probability corresponds to a price return of -15% over the next 3.1 months.
Theory indicates that the market-implied outlook is expected to have a negative bias because investors, in aggregate, are risk averse and thus tend to pay more than fair value for downside protection. There is no way to measure the magnitude of this bias, or whether it is even present, however. The expectation of a negative bias leads me to interpret this outlook as predominantly neutral, with a bearish tilt.
The 8-month outlook is markedly bearish, with substantially elevated probabilities for negative returns. The maximum probability corresponds to a price return of -26% over this period and the expected volatility is 65% (annualized). Even considering the potential for a negative bias, this market-implied outlook is bearish and is similar to the 8.2-month outlook to January 20, 2023 calculated back in May.
Market-implied price return probabilities for UBER for the 8.0-month period from now until June 16, 2023. The negative return side of the distribution has been rotated about the vertical axis (Source: Author’s calculations using options quotes from ETrade)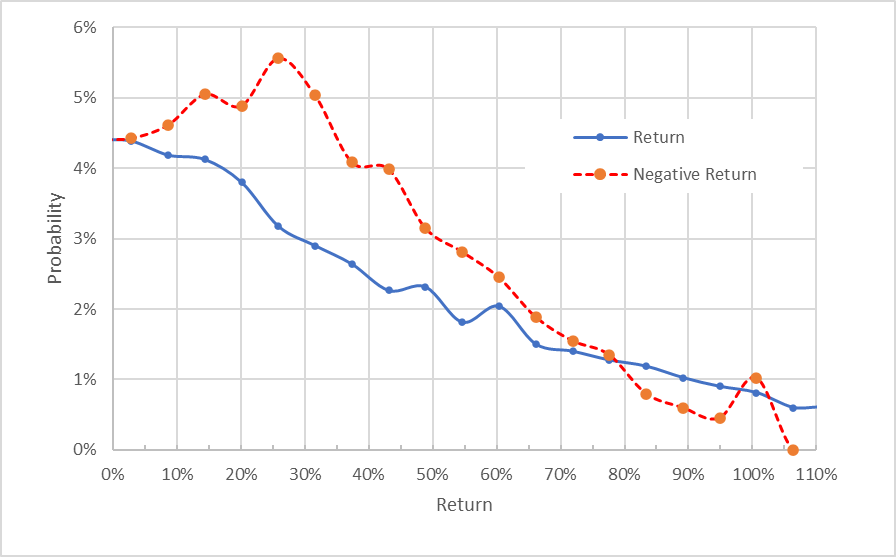
The market-implied outlook is neutral with a bearish tilt for the next 3.1 months but bearish for the 8-month period to June 16, 2023. The 3.1-month period includes the reporting of Q3 results but not the Q4 results. These results suggest that the options market anticipates that the current share price already reflects the market’s expectations, so that the probable outcomes to January 20, 2023 are only slightly bearish. The longer-term outlook to the middle of 2023 continues to be bearish, indicating that the probabilities favor price declines. The expected volatility is expected to decline slightly, probably reflecting settling in the broader market, but remains very high.
Summary
The gig-based ride hailing business model has had a global impact on taxi services, but there are significant questions as to whether this approach will be attractive for the long term. The big picture strategies for Uber and Lyft were based on having self-driving cars gradually supplementing, and then replacing, human drivers, although the realities of having a fleet of autonomous vehicles has had some notable setbacks. With the realistic implementation of fully autonomous taxis and delivery vehicles now pushed out into the future, can Uber thrive? The company will need to figure out how to build earnings with human employees, and the recent DOL announcement on worker classifications is just the most recent manifestation of the hurdles involved. The Wall Street analysts have been too optimistic about the company’s prospects for quite some time, making me skeptical about the consensus outlook. The large spread in the individual prices targets also leads me to discount the consensus. The market-implied outlook has been consistently bearish since mid-2021. The current market-implied outlook to mid-January of 2023 has only a slight bearish tilt, but the 8-month outlook is substantially bearish, with continuing high volatility. I am maintaining my bearish rating for UBER.
Be the first to comment