jetcityimage/iStock Editorial via Getty Images
Intro
Walgreens Boots Alliance, Inc. (NASDAQ:WBA) announces its fiscal second-quarter earnings numbers at the end of this month where $1.38 is the consensus EPS estimate on revenues of $33.23 billion. Being a low beta stock, an opportunity may be brewing in WBA as its implied volatility is above average at present. Suffice it to say, IV should continue to expand going into the announcement so we will most likely not sell any option premium until we get closer to the earnings date.
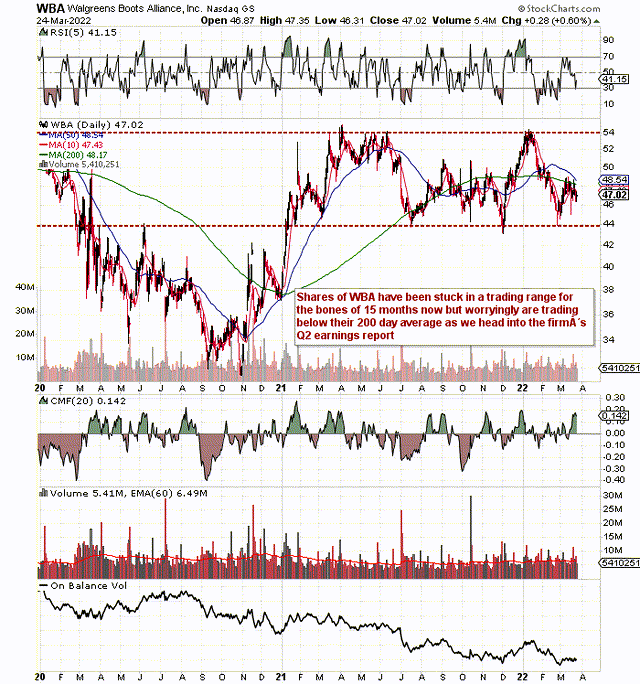
On the technical chart, we can see that shares have been trading in an approximate $10 range since the start of calendar 2021. However, since shares are now trading below their 200-day moving average of approximately $48.17, we would be in fact slightly bearish if indeed shares continue to break down ( As they have been doing since the start of calendar 2022) going into the report. Suffice it to say, if we put on something neutral pre-earnings like an iron condor or a strangle, it is imperative that we have confidence in rolling if indeed shares break to the downside. For example, if the $44 level was not to hold, shares could easily make a b-line for the 2020 lows of approximately $34 a share.
A good way to ascertain how much downside risk exists in a stock is to study the key trends which make up the dividend. Strength is this department usually lends itself to strong fundamentals in the company overall.
WBA’s Trading Range (StockCharts.com)
Dividend Yield
Walgreens Boots Alliance’s dividend yield currently comes in at 4.09% which is well above the average 2.3% in this sector. Furthermore, WBA’s yield is well above its average yield over the past five years (3.17%). Many investors use the yield as a barometer on whether shares are inexpensive so we are off to a good start here. Income-orientated investors usually snap up dividend aristocrat stocks such as WBA when their yields are trading at elevated levels. This case is even more so in the present environment with bond yields sharply on the rise in recent months. Suffice it to say, WBA could well experience heavy inflows on a pullback due to the “certainty” element that the dividend will indeed continue to grow.
Dividend Growth
In an inflationary environment, growth in the payout is essential. As we can see from the table below, growth in the payout has been waning over the past 10 years. Not only is growth important to protect purchasing power but it also fosters confidence with respect to projected growth. In effect, when management raises the dividend significantly, it usually means the forward-looking fundamentals are attractive.
| Period | 10-Year Growth Rate | 5-Year Growth Rate | 3-Year Growth Rate | 1-Year Growth Rate |
| WBA Dividend Growth Rate | 8.38% | 5.05% | 3.37% | 2.16% |
Pay-Out Ratio
Although many investors like to base the dividend pay-out ratio off net profit, we prefer to calculate it off free cash flow due to the fact that cash pays the dividend. Over the past four quarters, $1.62 billion of dividends was paid out of a free-cash-flow purse of $4.05 billion giving us a pay-out ratio of approximately 40%. Although the ratio has inched higher in recent years, WBA still has ample cash flow to keep on growing the pay-out.
Debt To Equity Ratio
WBA’s debt to equity ratio came in 0.37 at the end of its most recent first quarter. Management has managed the balance sheet well and if we were to add for example the company’s treasury stock of almost $21 billion back into shareholder equity of $33.36 billion, the adjusted debt to equity ratio would come in at a very attractive 0.23. Suffice it to say, leverage should not deter the company from keeping its dividend growth record intact.
Interest Coverage Ratio
We see the ramifications of WBA’s leverage on the income statement. $430 million of net interest expense was paid from an operating profit of $3.93 billion over the past four quarters. This means the interest coverage ratio came in at 8.45 over the past four quarters. An interest coverage ratio above five is crucial in order to facilitate dividend growth which means WBA is doing well in this department also.
Projected Earnings Growth
WBA’s consensus EPS estimate for fiscal 2022 comes in at $5.02 per share on revenues of $131.6 billion. Although the bottom-line estimate is just over 5% down on fiscal 2021, the company’s forward earnings multiple of 9.38 still looks very attractive compared to historic multiples. Furthermore, the forward cash-flow multiple of 6.06 illustrates that management believes more operating cash flow will be generated this fiscal year over fiscal 2021.
Conclusion
Therefore, to sum up, WBA’s dividend looks in solid shape despite the fall-off in growth which makes us believe downside risk is limited here. Suffice it to say, any meaningful increase in implied volatility would certainly bring opportunity to this play prior to the announcement of WBA’s second-quarter earnings. We look forward to continued coverage.


Be the first to comment