

shapecharge/E+ via Getty Images
How’s your portfolio handling the ups and downs of this volatile year? Although the Energy is having a banner year so far in 2022, most other sectors are down, as are many asset classes.
With the Fed recently embarked upon a new rate-raising regimen, many investors are re-balancing their portfolios, trying to move into assets which will do well in a higher rate environment.
We began covering the Guggenheim Strategic Opportunities Fund (NYSE:GOF), a closed end fund, a CEF, which offers a mix of fixed income and equity strategies at the start of 2022. While you’d expect fixed income investments to struggle in a rising rate environment, GOF has had a positive return of 4.45% so far in 2022, due mainly to its monthly distributions:
Hidden Dividend Stocks Plus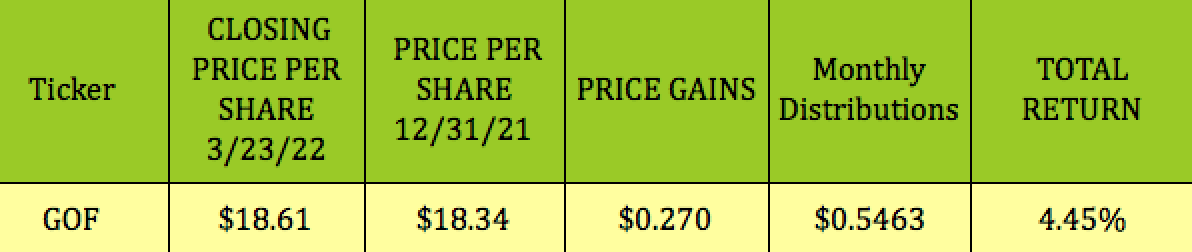
While GOF has lagged the 2 bond ETFs listed below, and the S&P 500 over the past year, it has outperformed them over the past month, quarter and so far in 2022:
Hidden Dividend Stocks Plus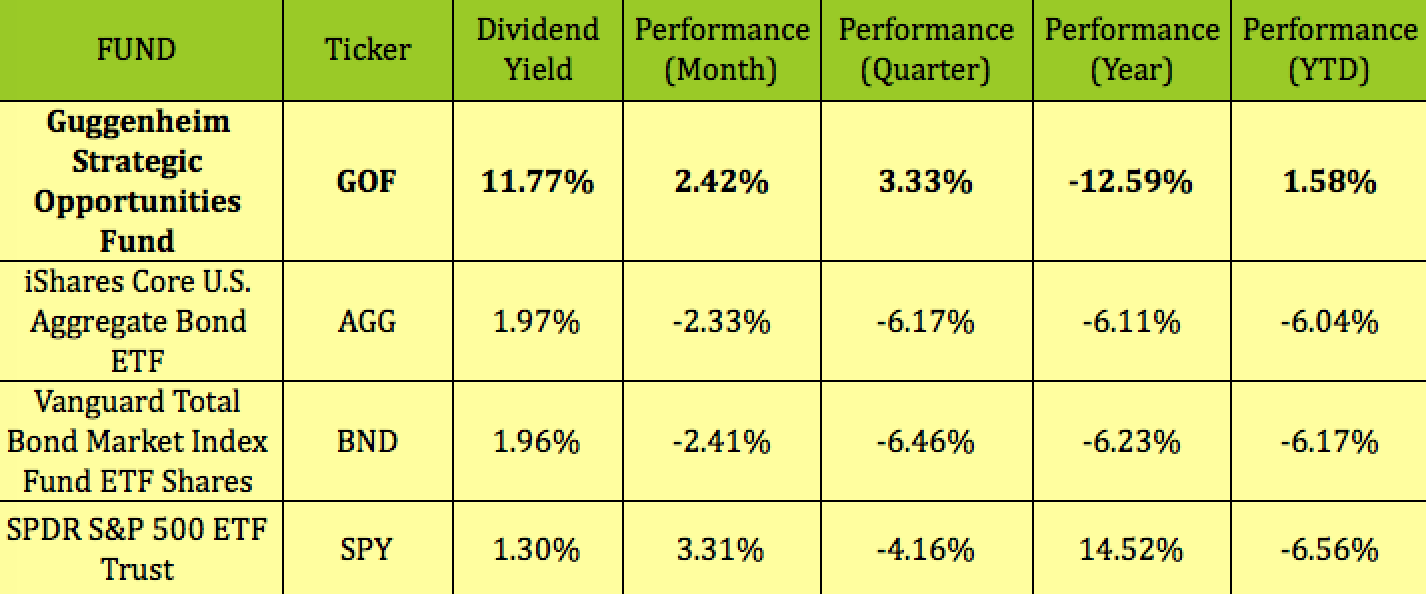
Profile:
“The Fund’s investment objective is to maximize total return through a combination of current income and capital appreciation. The Fund will pursue a relative value-based investment philosophy, which utilizes quantitative and qualitative analysis to seek to identify securities or spreads between securities that deviate from their perceived fair value and/or historical norms.
The Fund’s sub-adviser seeks to combine a credit managed fixed-income portfolio with access to a diversified pool of alternative investments and equity strategies.” (GOF site)
GOF has $2.22B in managed assets, with 89.5% of its holdings US-based. Management uses 30.4% leverage, and the Expense Ratio is 1.74%. Average daily volume is 601K, with 101M shares outstanding. The Assets/Debt ratio is 3.29X:
Hidden Dividend Stocks Plus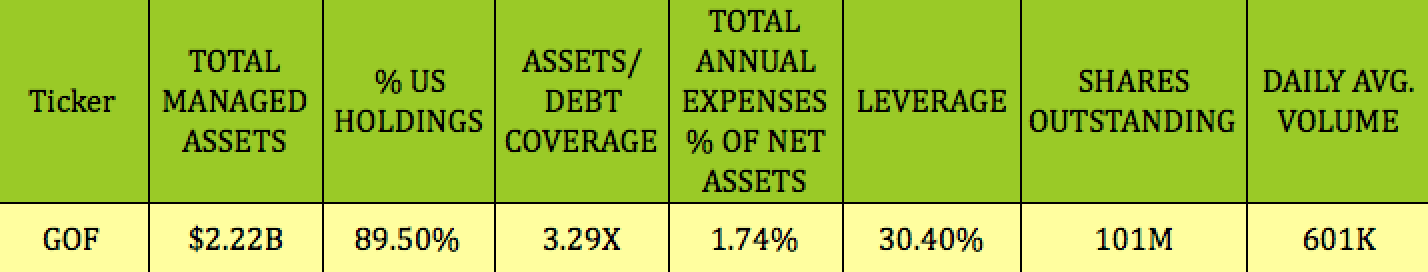
Holdings:
~48% of GOF’s holdings are rated investment grade, (AAA – BBB) while ~67% are rated non-investment grade, (BB and lower):
GOF site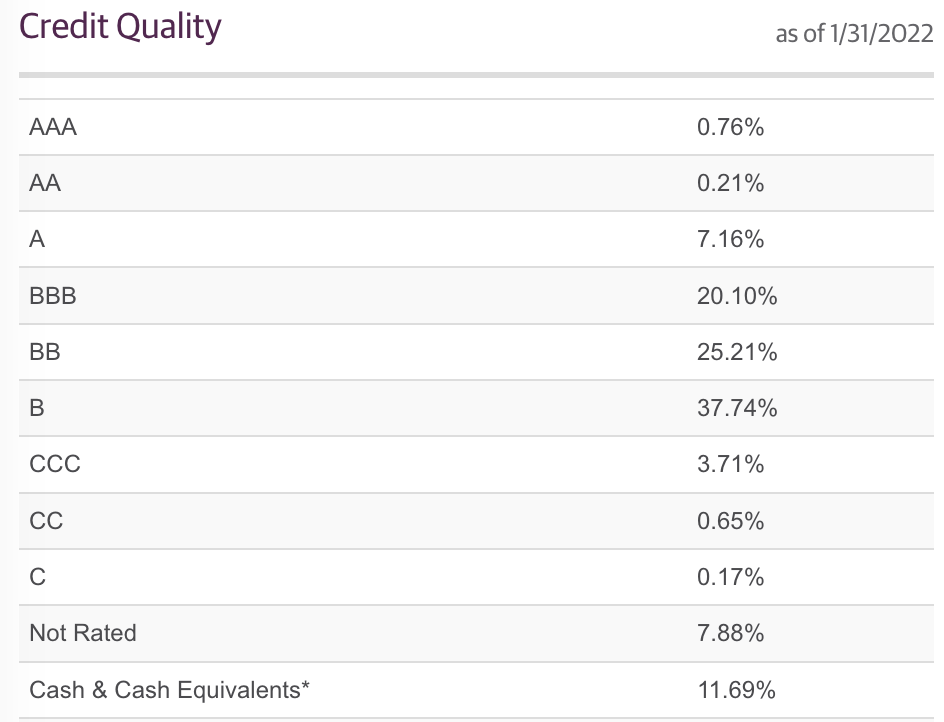
Fixed Income forms ~79% of GOF’s portfolio, with a weighted average duration of 4.59 years; while Equity Strategies form ~12%, and Cash forms ~9%.
GOF site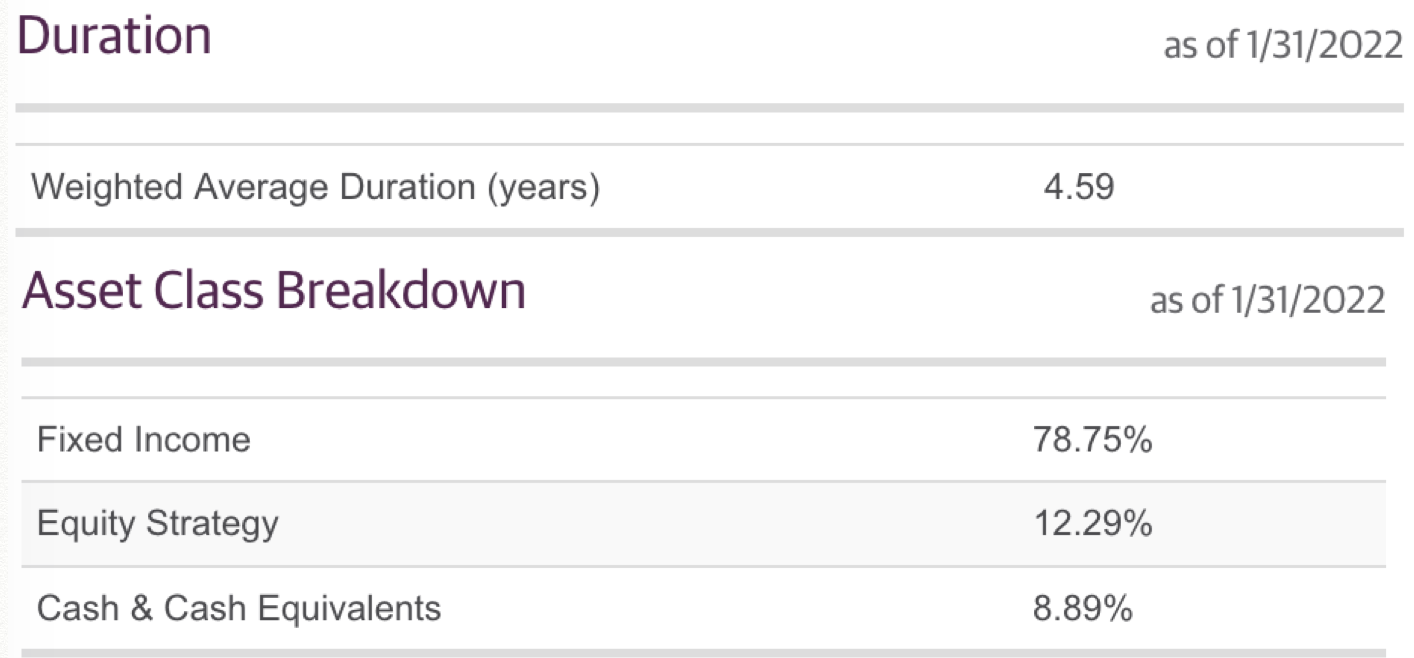
GOF’s holdings include 35% in high yield Corporate Bonds, 11% in Corporate Bonds, and 34% in Bank Loans; while Equity Strategy, was at ~16%, and Preferreds were at 5%, as of 1/31/22.
GOF site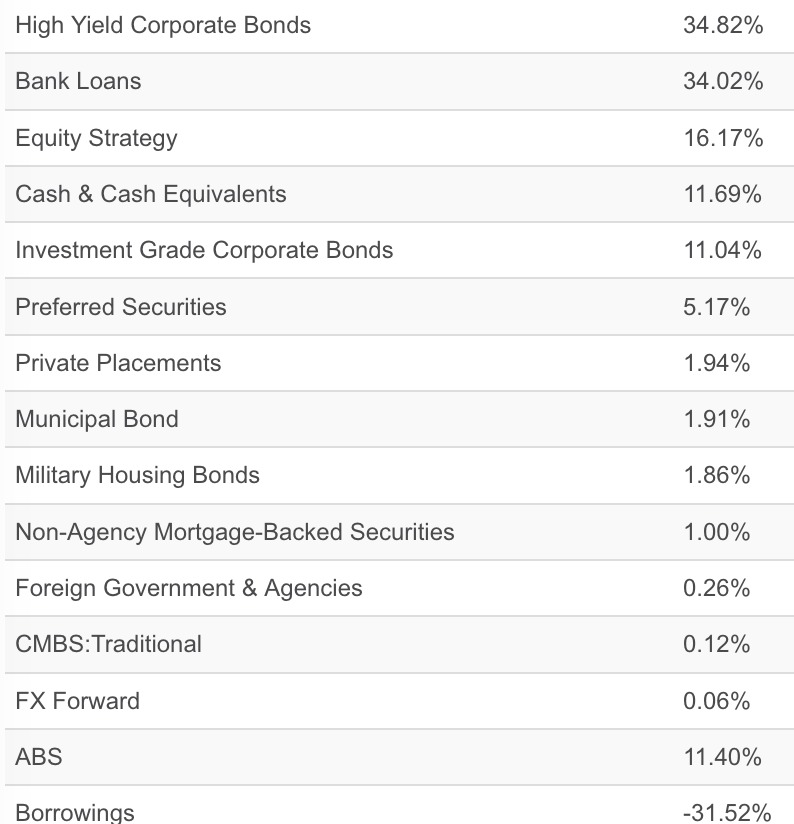
The ABS sub-category is comprised of CLOs and ABSs in several sectors, with Transportation being the top industry concentration, at 5.28%
GOF site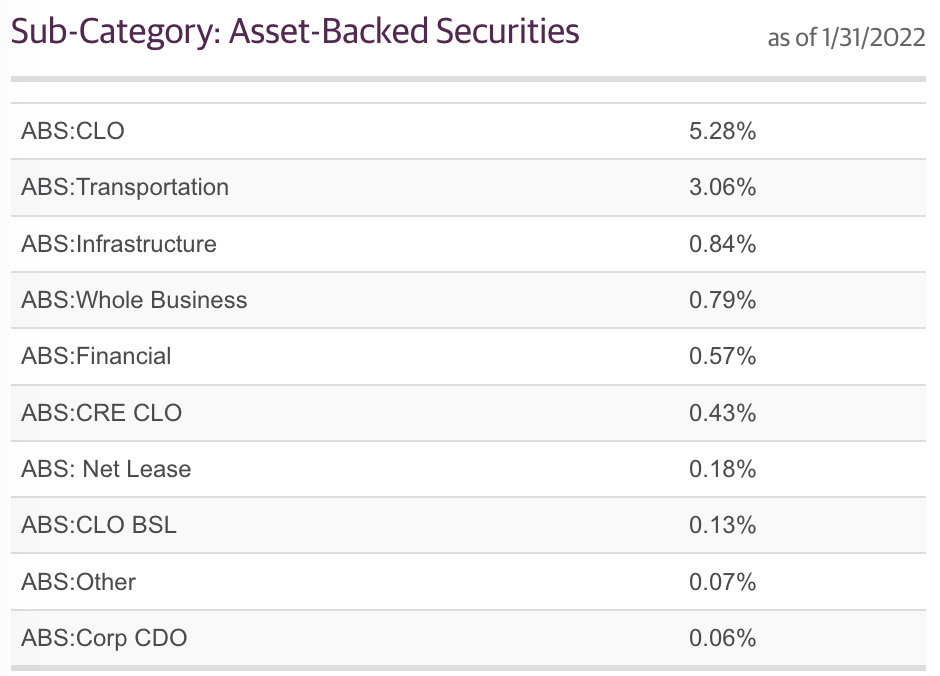
GOF’s top 10 holdings were mostly in corporate bonds, and only comprised ~7% of its holdings, as of 1/31/22:
Hidden Dividend Stocks Plus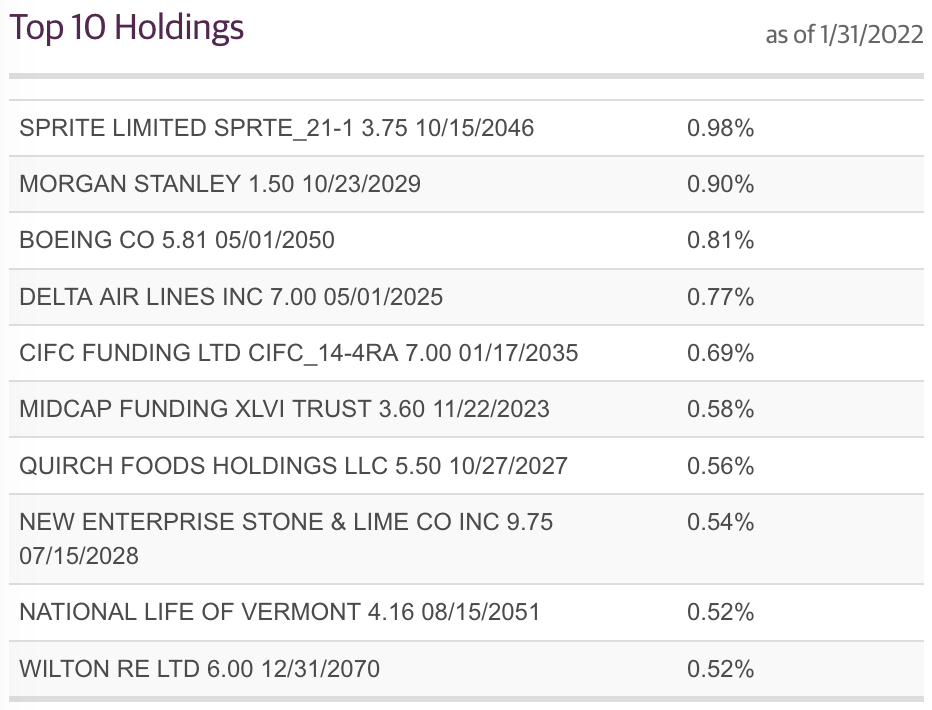
Distributions:
At its 3/23/22 closing price of $18.61, GOF yielded 11.74%. Its next ex-dividend date should be ~4/14/22, with a pay date of ~5/2/22. Management has kept the monthly distribution at $.1821 since Q2 2013.
Hidden Dividend Stocks Plus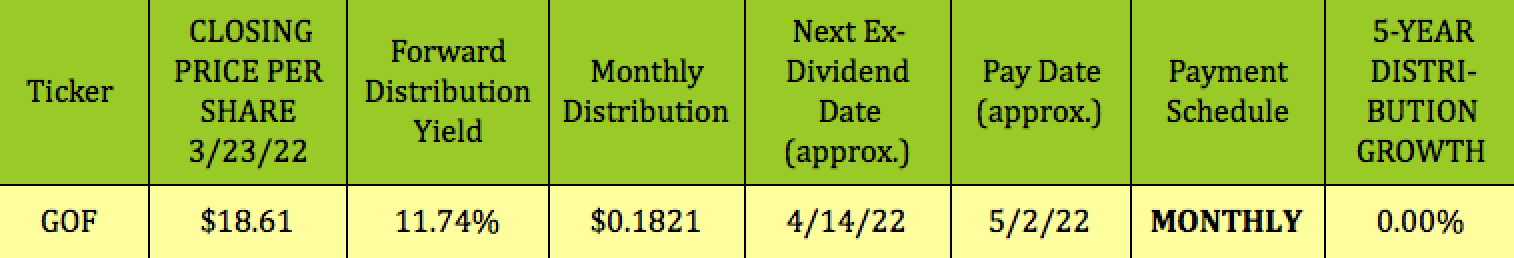
Looking “under the hood” of this CEF, shows outstanding distribution coverage for its most recent fiscal year, ending 5/31/21, with a coverage factor of 1.51X.
For the next 6 months, though, period ending 11/30/21, GOF’s NII+Realized Gains only generated 40% of the $66M in distributions paid for the period.
However, there was also $105.72M in ATM proceeds, which more than covered the -$39M shortfall. In addition, there was a one-off merger share issuance, which had major proceeds of $644M. Adding these 2 items to the mix shows distribution coverage of 11.76X:
Hidden Dividend Stocks Plus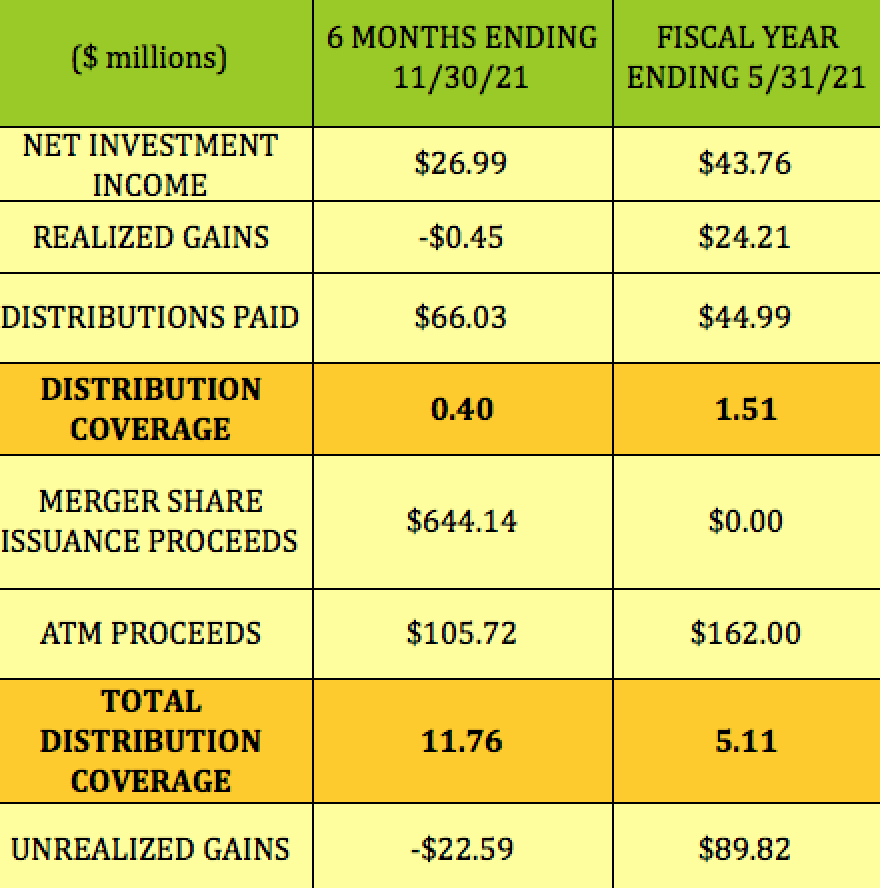
Taxes:
GOF’s 2021 distributions included 60% in Return of Capital, with 40% classified as Ordinary Dividends. Return of Capital offers a deferred tax advantage, but it does lower your basis, so that, if and when you sell, your tax bite would be higher.
GOF site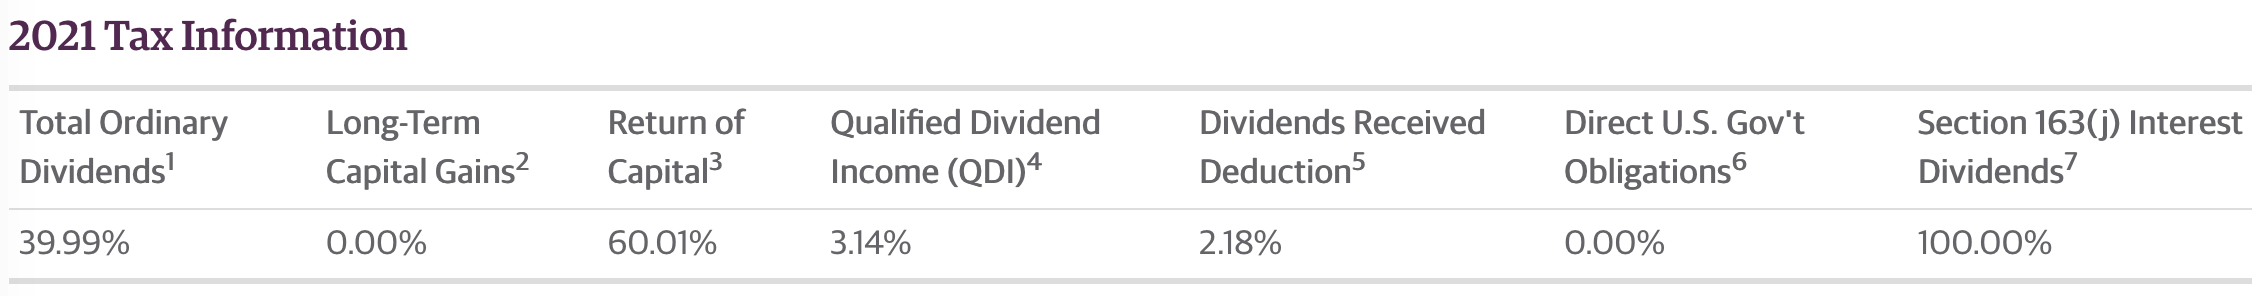
Pricing:
At $18.61, GOF is selling at a 21.87% premium to its 3/22/22 NAV/Share of $15.27, a bit higher than its 1 year average premium of 20.28%, and much higher than its 3-year average premium of 14.24%, and its 5-year average premium of 11.81%.
A useful strategy for investing in CEFs is to try to buy them at a deeper discount or lower premium to NAV than their historical averages.
Hidden Dividend Stocks Plus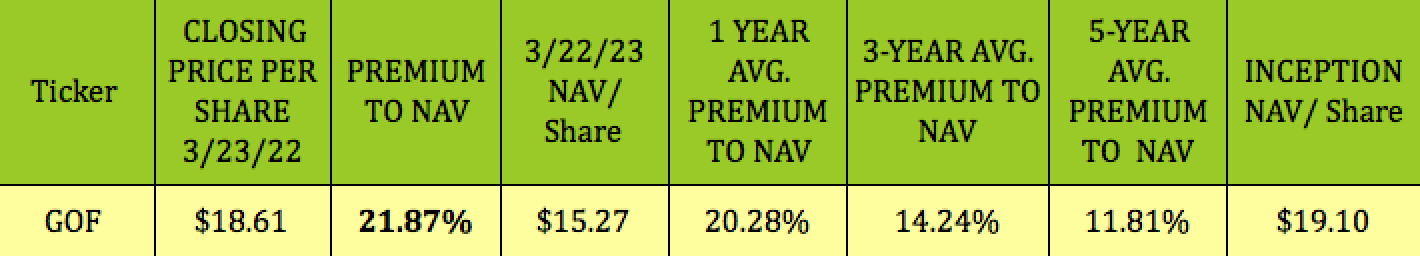
Looking back over the past several years shows a mixed record for GOF vs. the Morningstar US CEF Multi-Sector category. GOF outperformed on a price and NAV basis in 2020, 2017, and 2016, and outperformed on a NAV basis in 2021. It lagged in price and NAV in 2019, price in 2018, 2015, and slightly lagged in 2014:
cefcnct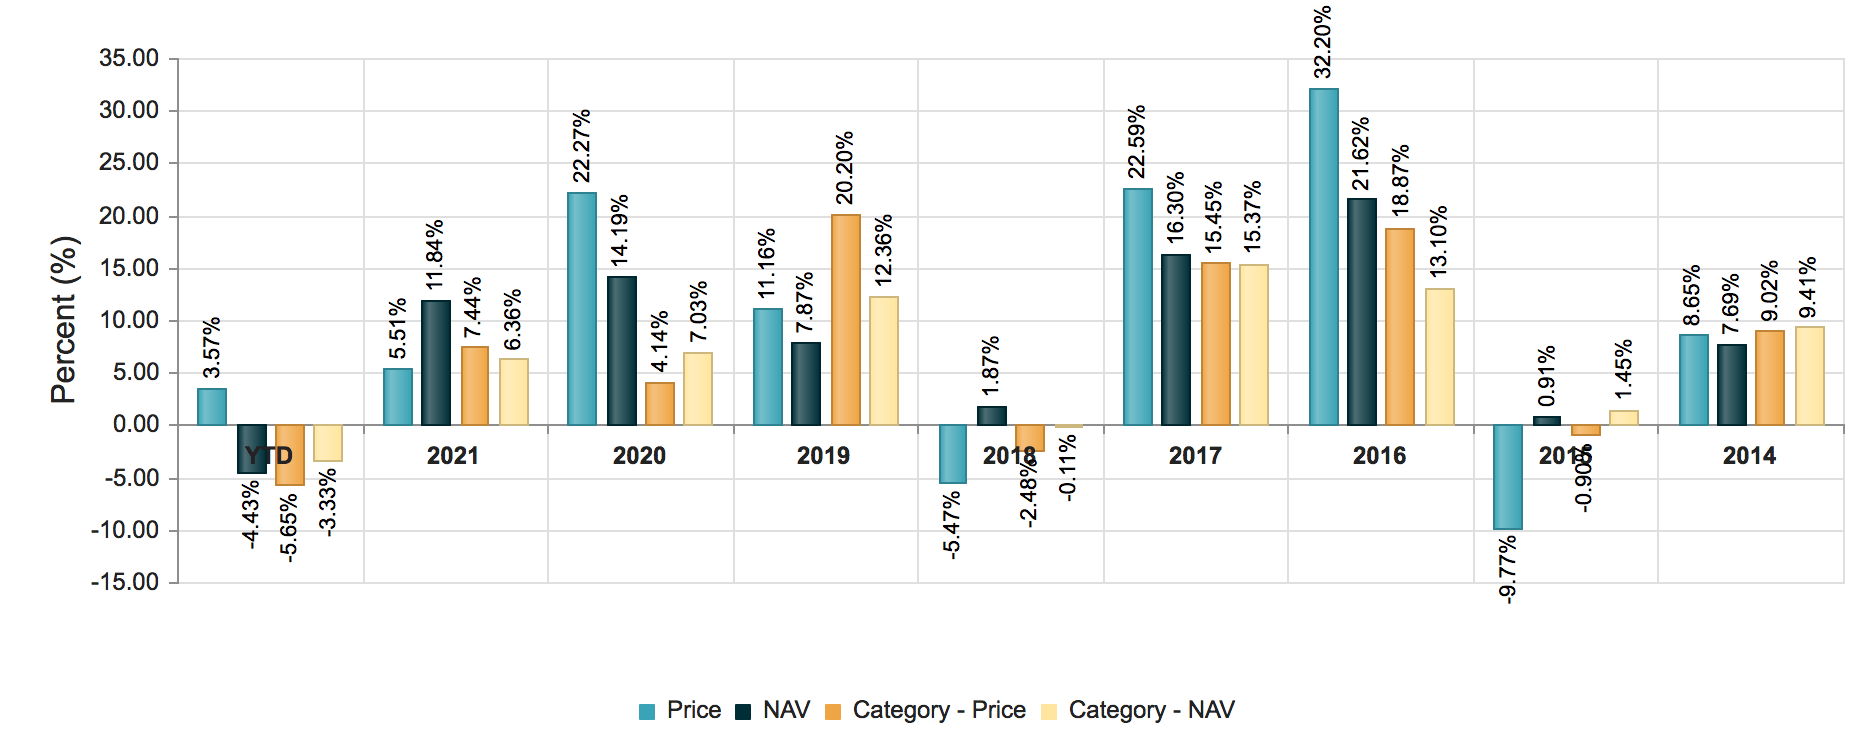
Parting Thoughts:
While GOF has outperformed so far in 2022, you may want to wait for the next market pullback before wading into some shares, at which point you may be able to buy them at a lower premium.
All tables by Hidden Dividend Stocks Plus, except where otherwise noted.
Be the first to comment