

Stas_V/iStock via Getty Images
Q2 recap and thesis
My last AT&T (NYSE:T) article was co-produced with Envision Research earlier this month. That article, entitled “AT&T: Lower Debt And Higher Margin Ahead” analyzed how its lower debt can help it in the long run. Our analysis projected that the lower interest expense alone will expand its margin by about 115 bps. At the same time, it will also allow T to better focus on 5G and fiber. T reported its Q2 earnings shortly after my last article. And here I wanted to shift the view to the short term and examine its Q2 results more closely.
After it reported its Q2 earnings, its stock price plunged by about $20.8 to as low as $18.25 during intraday trading, a drop of more than 12%. There are reasons to be concerned as you will see. The market should be rightfully concerned about the free cash flow (“FCF”) issues. However, you will see next the concern is overblown (something the market does frequently) once viewed under a broader context (something the market does not usually do).
Overall, the Q2 results are mixed in my view. Topline showed healthy growth. Its Q2 standalone revenues came in at $29.6B. On a comparable basis, its standalone revenues were up ~$640M, or 2.2%. It also kept gaining subscribers, especially for its 5G and fiber services. Its fiber subscribers grew from 6.3 million last quarter to 6.6 million this quarter, a healthy net addition of 316K new subscribers.
However, the bottom line is under pressure as you can see from the following chart. Adjusted EPS stood flat ($0.65 vs. $0.64) for the standalone T and decreased by $0.08 when the U.S. Video and other segments were included. What is more concerning is the FCF. The FCF plunged from $5.2 billion in Q1 to $1.4 billion this quarter. And management had to lower the full-year guidance by about $2B, from the $16B range before to the current $14B range. And the focus of the remainder of this article is to examine closely what are the implications of the FCF issue.
T Q2 earnings report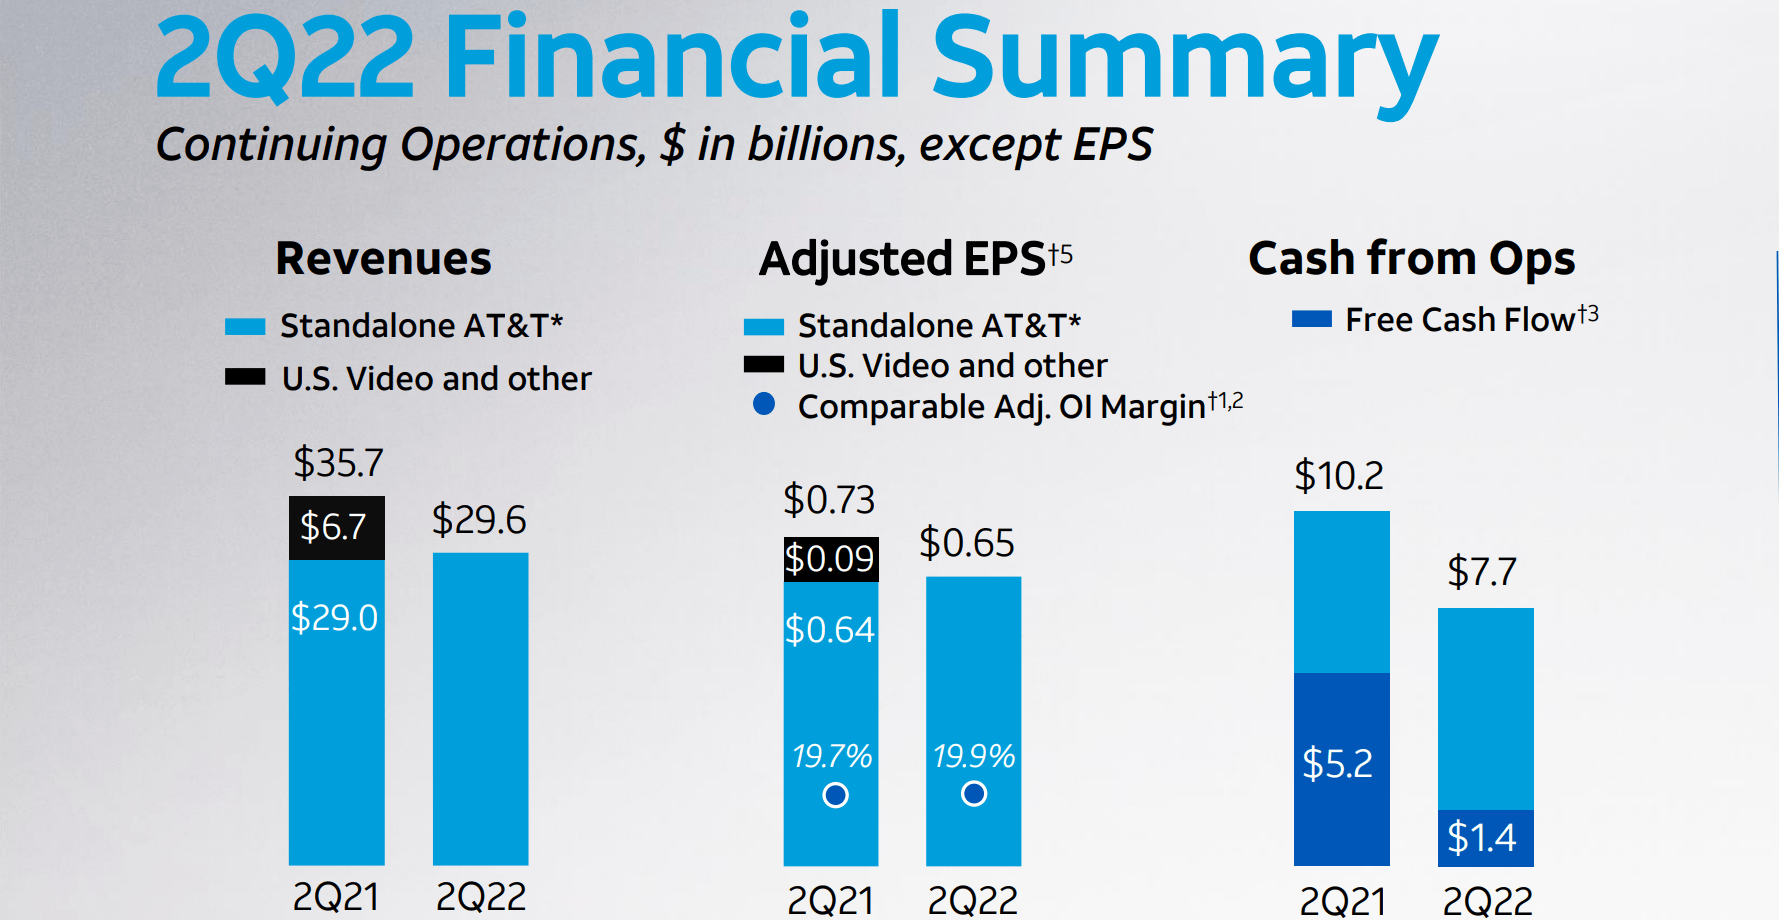
The updated/reduced FCF guidance
Management quotes several reasons for the $2B cut in the FCF guidance, as commented in the Outlook Update section of its press release (abridged and emphases added by me). I view some of these reasons as temporary (like the timing of customer collections) and some of them as more chronic (the wireline income for example). I don’t view the increased capital investment as a negative in the long term, but it can stretch short-term capital allocation freedom as detailed in the dividend section next.
The company is updating its 2022 free cash flow outlook… Factors affecting second-quarter free cash flow include $1.7 billion higher capital investment year over year, an impact of approximately $1 billion due to timing of customer collections, incremental success-based investment tied to higher subscriber growth and lower Business Wireline operating income.
Given these factors, the company is lowering full-year free cash flow guidance from the $16 billion range to the $14 billion range. Accordingly, the company expects to generate approximately $10 billion of free cash flow in the second half of the year.
T Q2 earnings report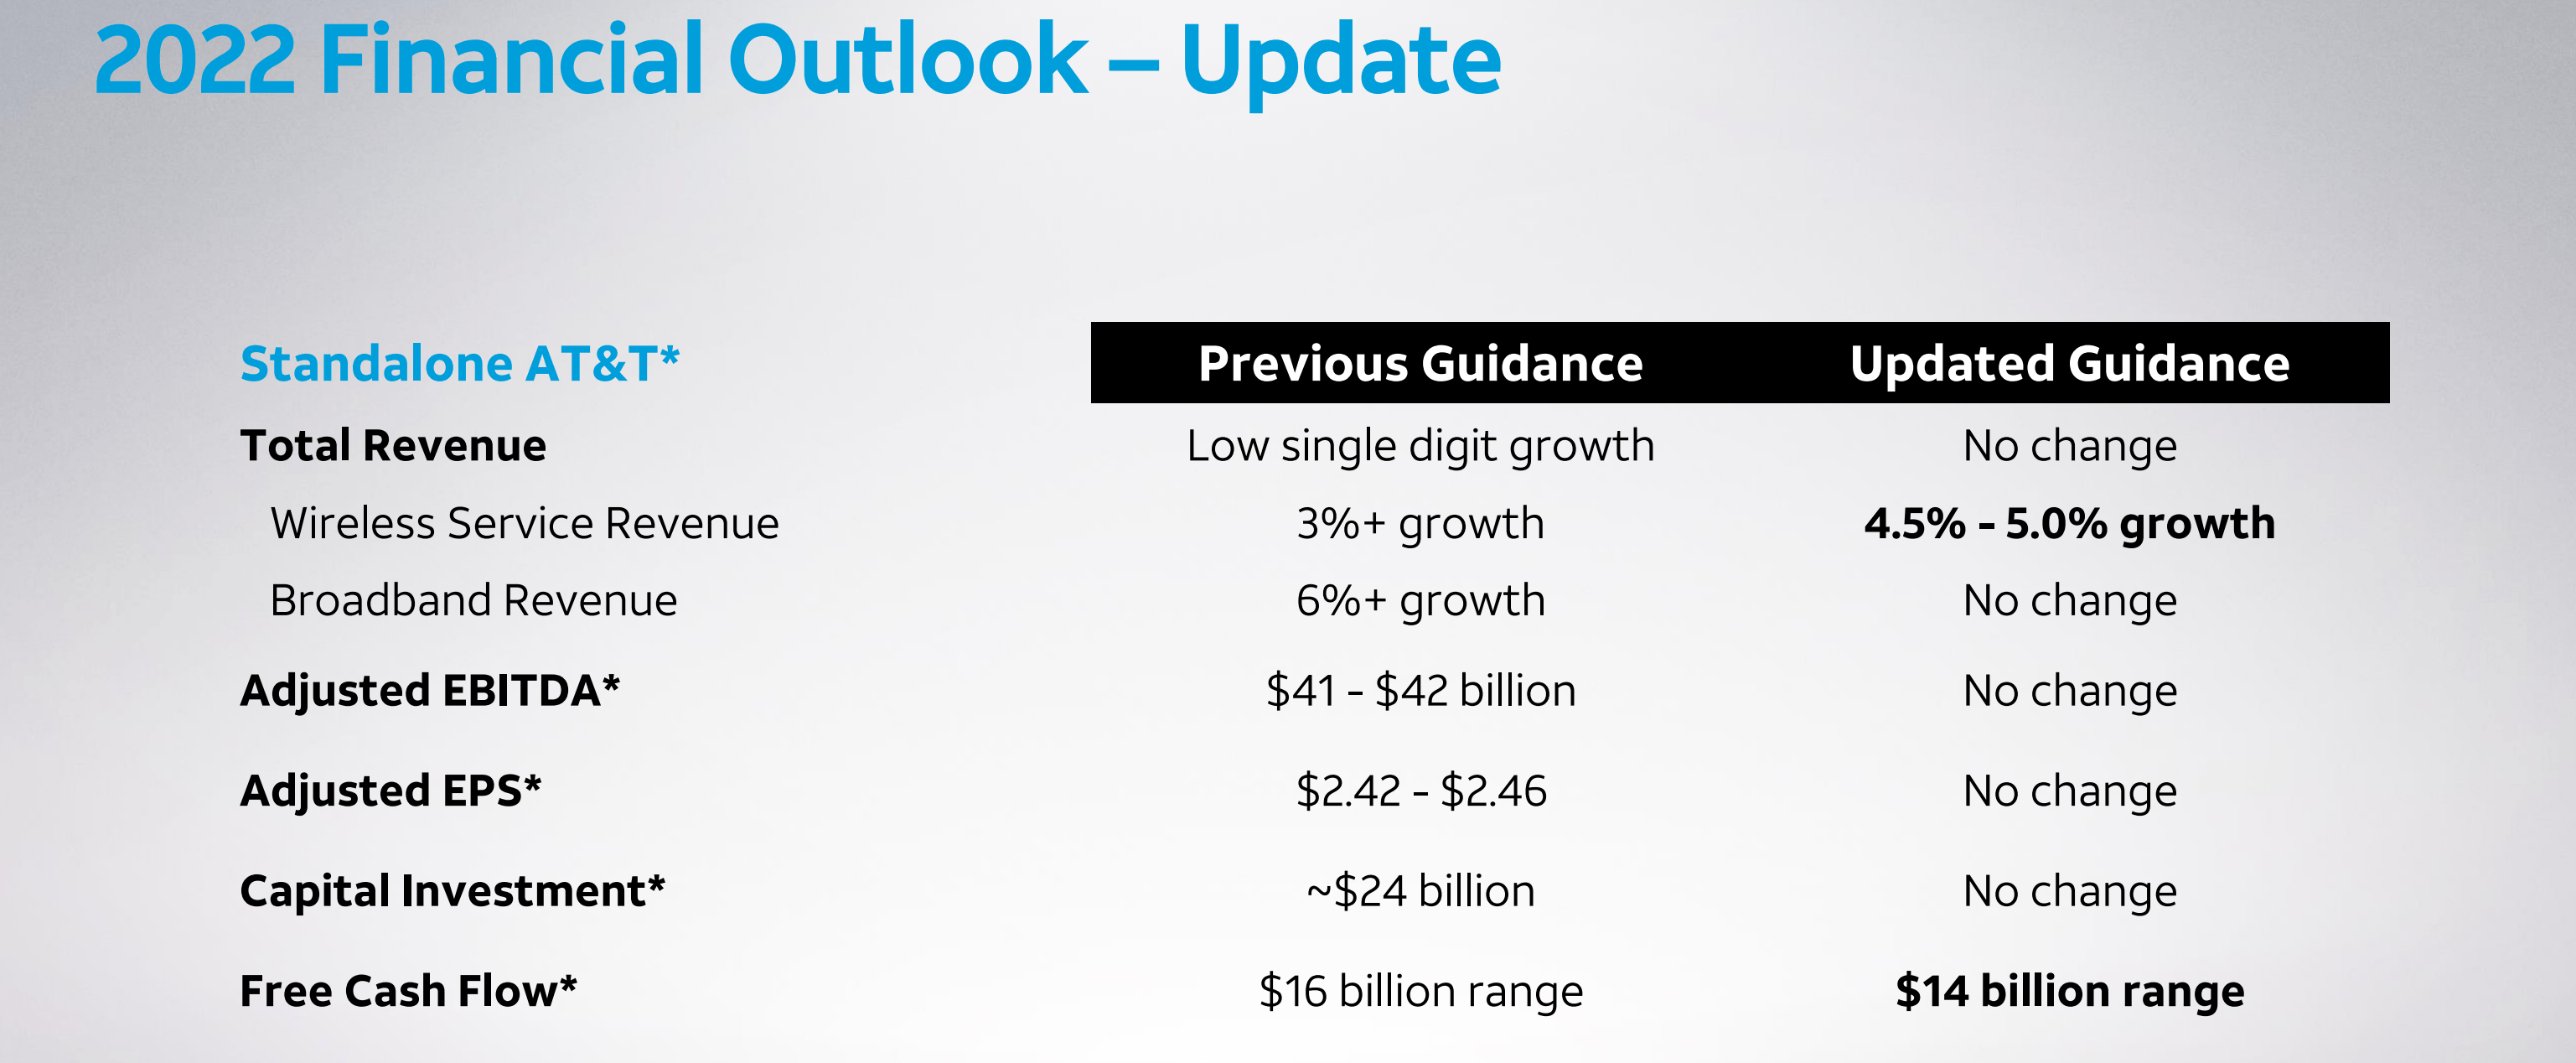
The next chart puts the lower guidance into a broader context. It shows the price to FCF multiple in the past decade. As you can see, the multiple has been fluctuating in a quite wide range of 5.3x to 13.0x with an average of 8.9x in the past 10 years. Its $14B guidance translates to about $1.84 of FCF per share. And at its current price ($18.5 while I am typing this line), its FCF multiple based on the lowered guidance is almost exactly 10x. It is admittedly a bit above its historical average by about 11%. But considering the range of the fluctuation (almost 2.5x), I view such a premium as quite small and within the noise level.
Seeking Alpha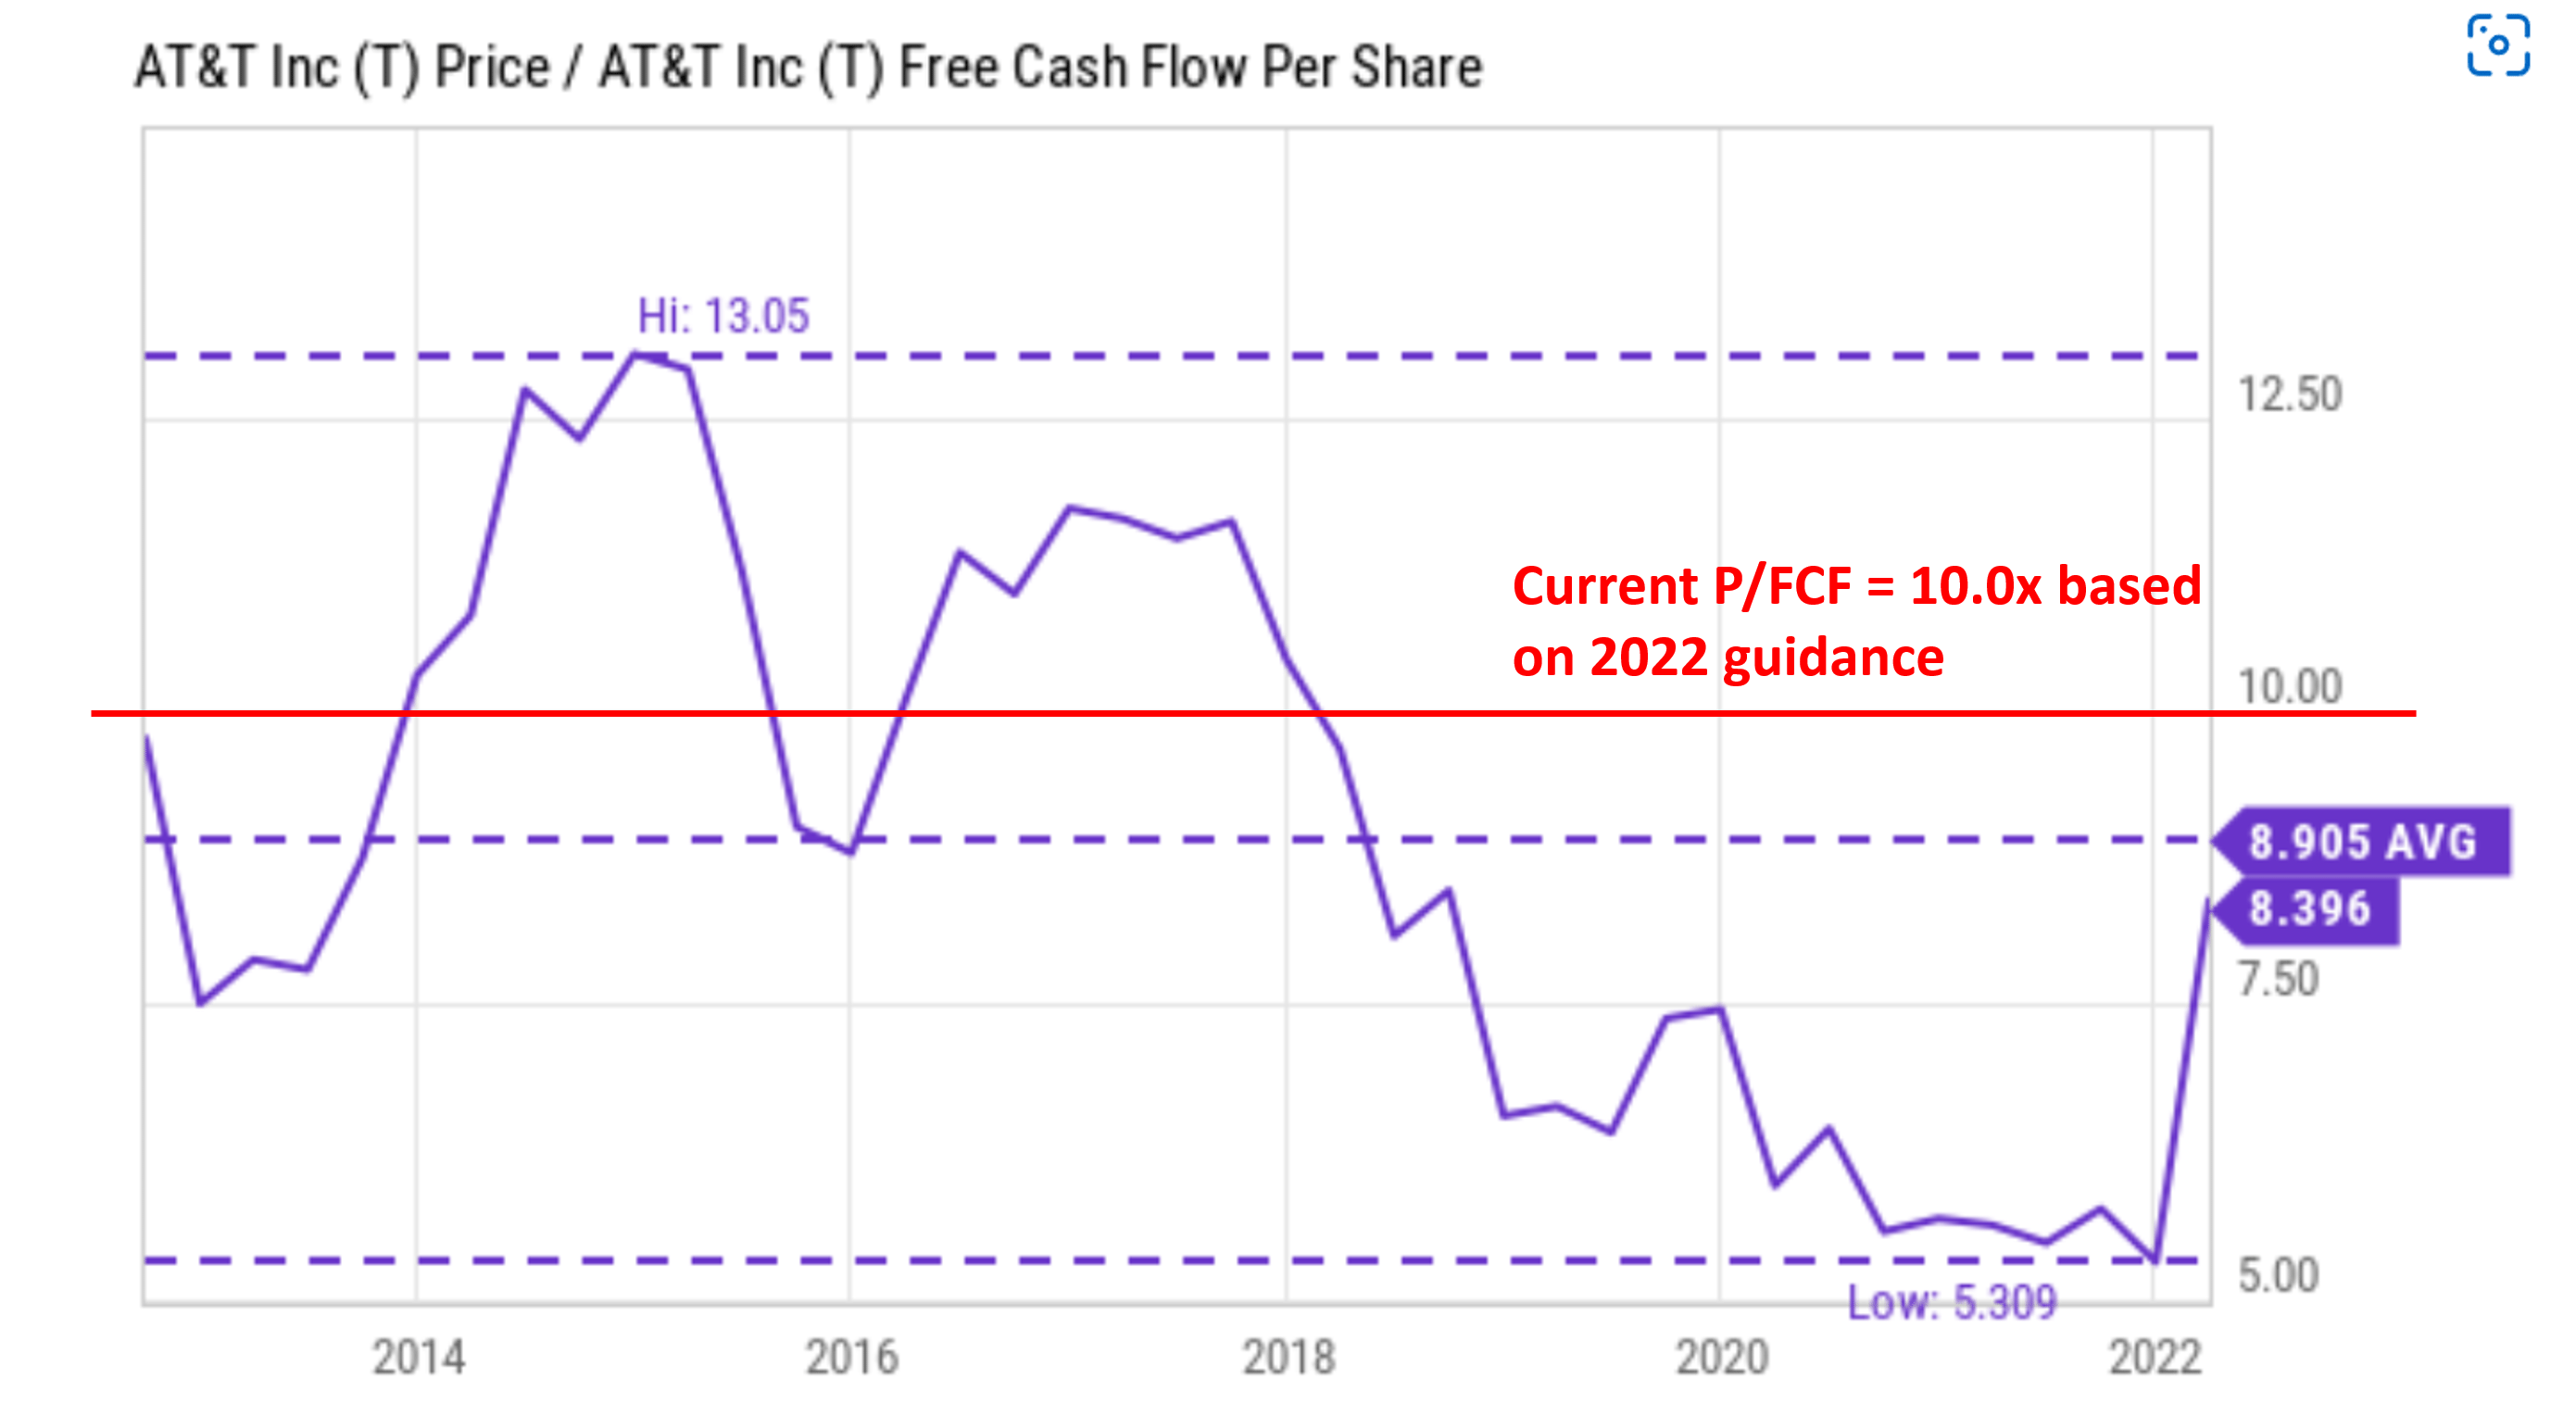
Dividend
In the near term, there is a chance, although a slim one, for dividend cuts due to the lower FCF and higher CAPEX expectations. As you can see from the chart below, FCF after dividends has been at a healthy $1B+ level last year. However, this year, it is deep in the red: negative $702M for the quarter and negative $1.64B for the past 6 months.
Many T investors are drawn to the stock because of its dividend. However, when asked about the prospects of the dividends, the CEO does not directly answer the question and kind of danced around it. As you can see from the Q&A exchange below (abridged and emphases added by me):
Question from Frank Louthan (Raymond James): Can you comment a little bit on your dividend policy going forward? Is it a priority to grow the dividend by various amounts?
Answer from John Stankey (CEO of T): Frank, look, we’ve been pretty clear on the dividend policy as to what we’re doing… As I said, the Board will evaluate dividends, along with other choices in front of us to return to shareholders. As we’ve indicated, our priority right now is to get the balance sheet where we want it, which is a full rush and push to getting to 2.5x, and then we can evaluate what other options are at that point in time.
T Q2 earnings report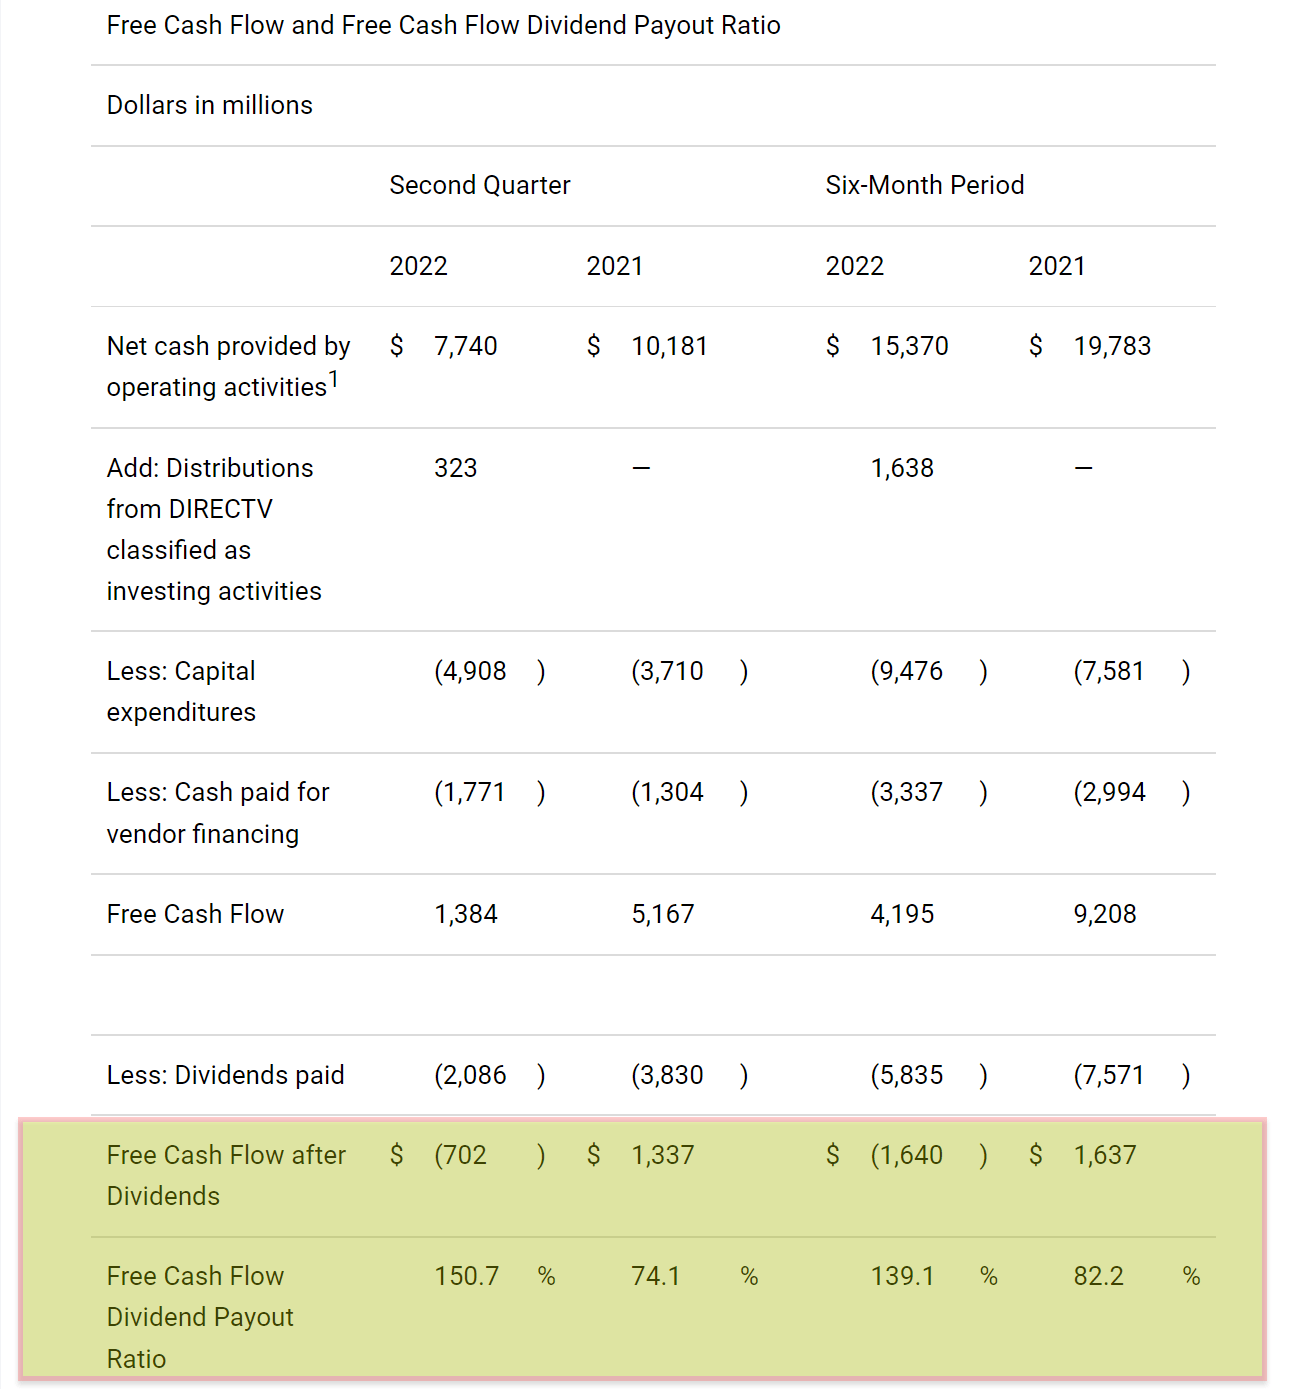
The next chart presents the issues from a broader point of view in three ways. First, it examines T’s financial obligations more holistically using the dividend cushion ratio. As detailed in my earlier article here, the cushion ratio considers factors beyond dividends, CAPEX, and cash flow. It also includes other considerations such as debt, receivables, payables, cash positions, et al. Second, it examines T’s cushion for the past decade to add a historical context. And finally, it also compares T to a close peer, Verizon (VZ), to add a horizontal comparison.
As you can see, based on the most recent financials, its dividend cushion ratio currently stands at 1.39x. The bad news is that it is both below its long-term average of 1.61x and also below VZ’s 2.0x. However, the good news is that it is above the threshold of 1x by a good margin.
So again, as aforementioned, I see a realistic chance of a dividend cut in the near future. But I view the chance to be relatively low. Going forward, investors should closely monitor its financials, not only the simple payout ratios but also other financial assets and obligations.
Author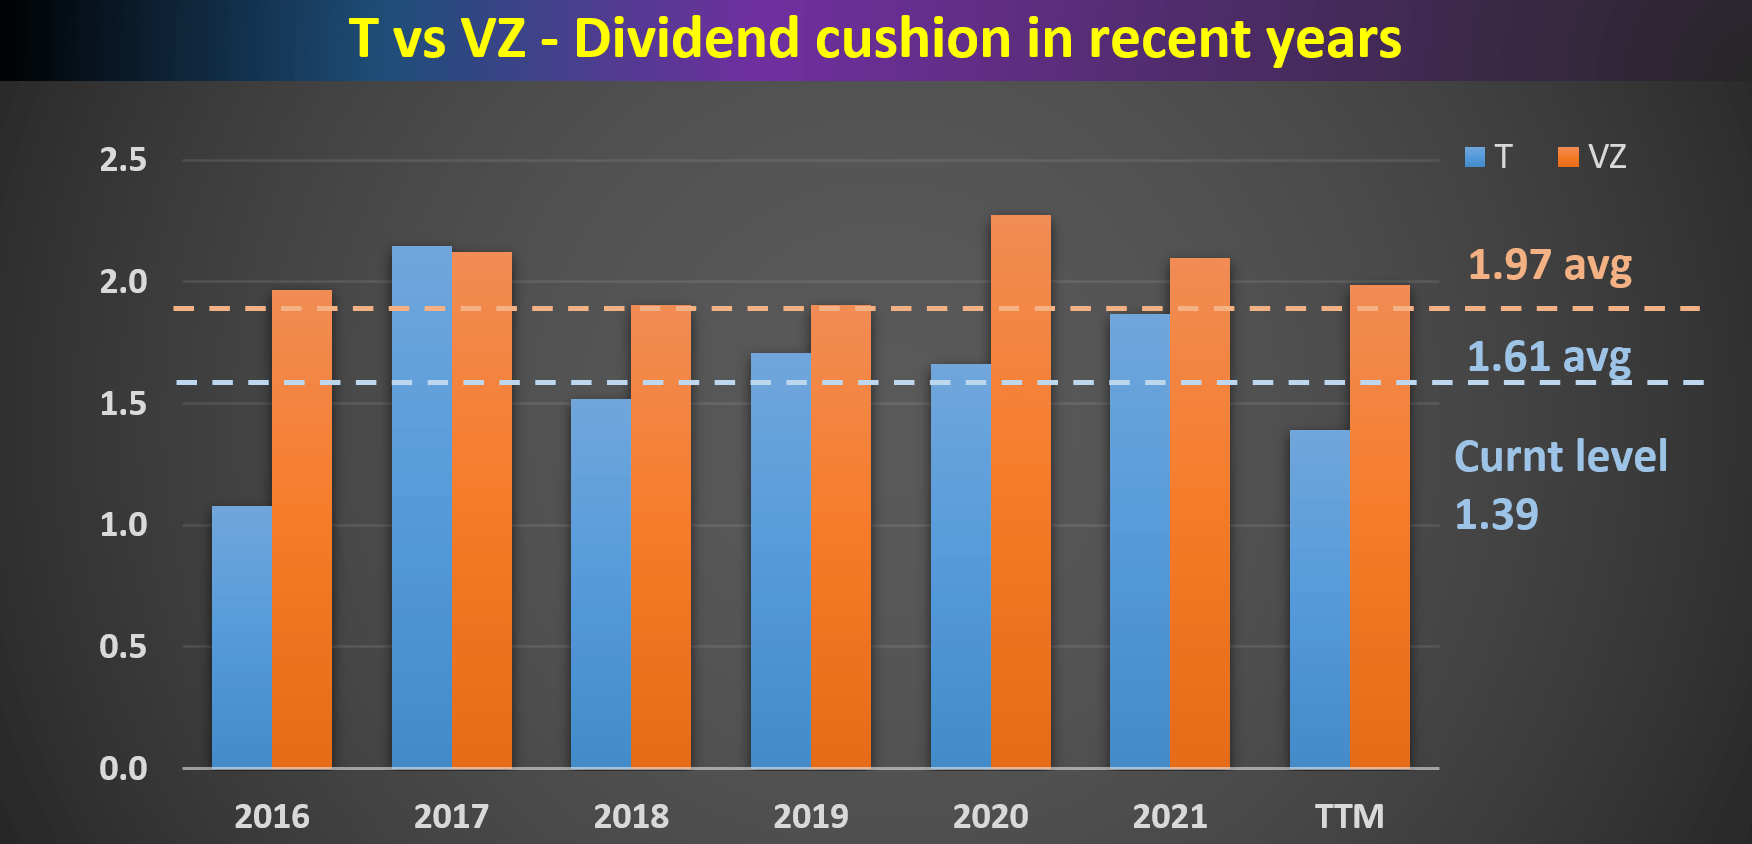
Final thoughts and risks
T posted mixed Q2 results. Topline showed a healthy growth of 2.2% in terms of standalone revenues. It also kept gaining subscribers at a healthy pace. Its fiber subscribers grew from 6.3 million last quarter to 6.6 million this quarter, a healthy growth rate of about 5%. However, the bottom line is under pressure. Management had to lower the FCF guidance by about $2B due to increased CAPEX expectations, the timing of billing, et al.
Overall, I see the ~10% price plunge as a knee-jerk reaction from the market. Its FCF multiple based on the lowered guidance is ~10x. It is a very reasonable level both in absolute terms and relative terms. It’s only above its historical average by about 11%, totally within the noise level in my view given the variance. Furthermore, I do not view the increased CAPEX expenditures as a negative (not entirely at least). As argued in my earlier articles, I expect healthy returns down the road from such investments.
In terms of risks. I do see a realistic chance for a dividend cut in the near term (though a small one). Its FCF is not enough to cover its dividends currently. Furthermore, a holistic assessment of all its financial obligations also shows its dividend cushion ratio to be on the lower end both compared vertically and horizontally.
Be the first to comment