

Igor Kutyaev
(This article was co-produced with Hoya Capital Real Estate)
Introduction
My guess, by the AUM size differences between some Large-Cap funds and those focused on smaller stocks, means that many investors could be underweight stocks below those held by ETFs like the Vanguard S&P 500 ETF (VOO). ETF sponsors like Vanguard, iShares, and SPDR offer many ETFs for those interested, and they come in many varieties.
This article will cover two from Vanguard:
- Vanguard Russell 2000 ETF (NASDAQ:VTWO), which invests based on a well-known index.
- Vanguard Extended Market ETF (NYSEARCA:VXF), which uses an S&P index that excludes the S&P 500 stocks.
Vanguard Russell 2000 ETF review
Seeking Alpha describes this ETF as:
The Vanguard Russell 2000 ETF invests in growth and value stocks of small-cap companies. It seeks to track the performance of the Russell 2000 Index that measures the investment return of small-capitalization stocks in the United States. VTWO was formed on September 20, 2010 and is domiciled in the United States.
Source: seekingalpha.com VTWO
VTWO has $5.7b in assets and shows a 1.4% TTM yield. Vanguard charges 10bps in fees.
Index review
FTSE Russell describes their Index as:
The Russell 2000® Index measures the performance of the small-cap segment of the US equity universe. The Russell 2000 Index is a subset of the Russell 3000® Index representing approximately 7% of the total market capitalization of that index, as of the most recent reconstitution. It includes approximately 2,000 of the smallest securities based on a combination of their market cap and current index membership. The Russell 2000 is constructed to provide a comprehensive and unbiased small-cap barometer and is completely reconstituted annually to ensure larger stocks do not distort the performance and characteristics of the true small-cap opportunity set. The Index start in 1984.
Source: research.ftserussell.com index
The next tables compare the R2000 Index to the R3000 Index, which includes the larger stocks excluded from the R2000.
research.ftserussell.com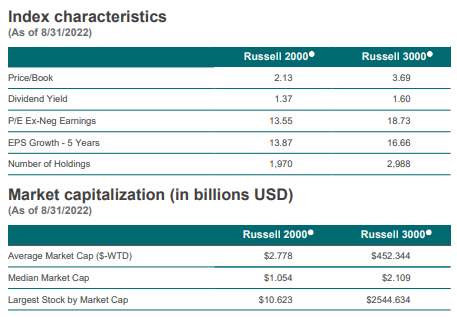
The comparison shows how the inclusion of Large-Cap stocks stretches both the PE and PBV ratios and drastically changes the market-cap values.
VTWO holdings review
Vanguard’s data looked more like Industry, not Sector weighted as there were over 140 entries. I used Fidelity for more concise sector weights.
Fidelity.com VTWO
Unlike Large-Cap ETFs, Information Technology is not the top sector, nor does one sector dominate the portfolio. Using Vanguard’s classifications, which I re-title Industry, the Top 10 are:
advisors.vanguard.com; compiled by Author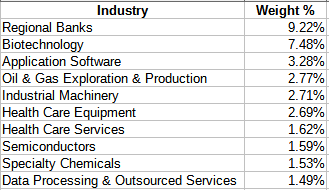
Top 20 holdings
advisors.vanguard.com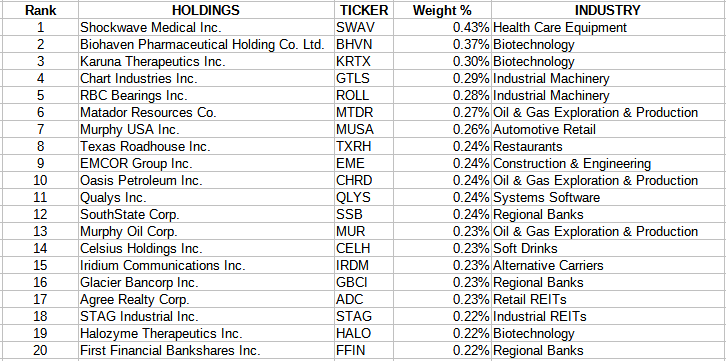
VTWO holds almost 1900 stocks, with the Top 20 only accounting for 5.2% of the weight. Along with these stocks, VTWO hold about 2.4% in cash for liquidity purposes.
VTWO distribution review
seekingalpha.com VTWO DVDs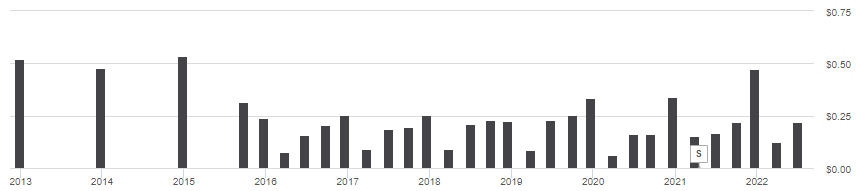
A low yield and little payout growth likely eliminate this ETF for dividend investors. Even so, Seeking Alpha gives VTWO a B+ dividend rating.
seekingalpha.com VTWO scorecard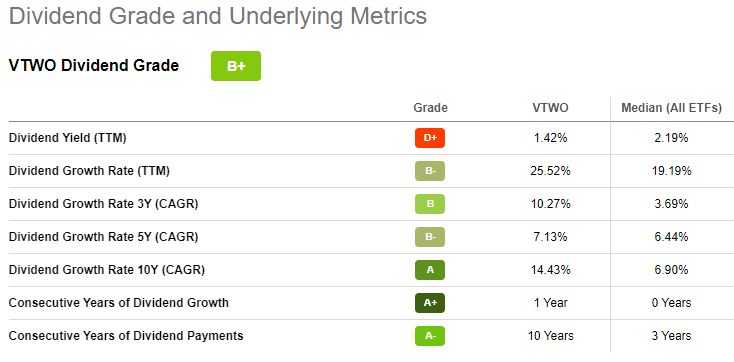
Vanguard Extended Market ETF review
Seeking Alpha describes this ETF as:
The Vanguard Extended Market ETF invests in growth and value stocks of companies across diversified market capitalization. The fund seeks to track the performance of the Standard & Poor’s Completion Index, a broadly diversified index of stocks of small and mid-size U.S. companies.
Source: seekingalpha.com VXF
VXF has $83.4b in assets and shows a TTM yield of 1%. Vanguard charges 6bps in fees.
Index review
S&P provides this description of the Index:
S&P Completion Index comprises all members of the S&P TMI Index except for the current constituents of the S&P 500®. The index covers approximately 3000 constituents, offering investors broad exposure to mid, small, and micro cap companies.
Source:spglobal.com index
spglobal.com index PDF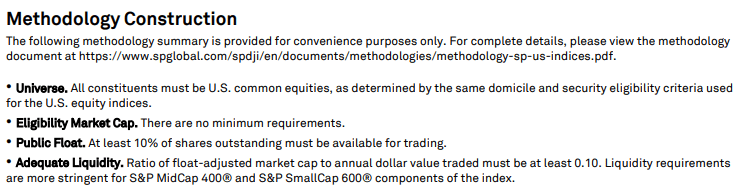
That process results in an Index with these characteristics.
spglobal.com index PDF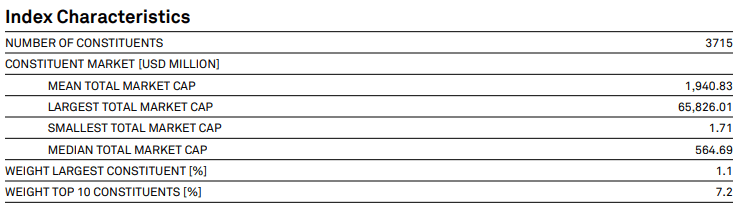
Despite including Mid-Cap stocks, the inclusion of more Small-Cap stocks results in this Index having a Median Market-Cap half that of the R2000 Index. The S&P index hold almost twice the number of stocks as the R2000 does.
VXF holdings review
I used the same process for VXF as I did for VTWO, so data is comparable.
Fidelity.com VXF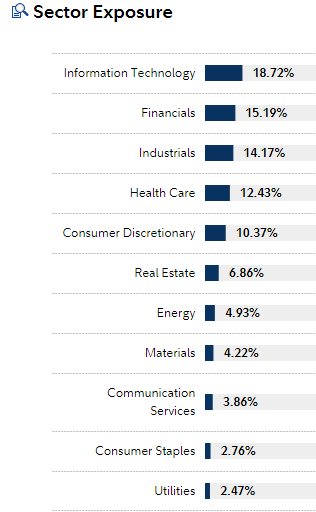
With the addition of Mid-Cap stocks, Information Technology moves up to being the largest sector allocation. I will compare sectors in more detail later.
advisors.vanguard.com; compiled by Author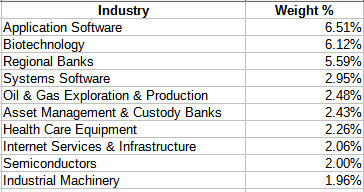
Top 20 holdings
advisors.vanguard.com; compiled by Author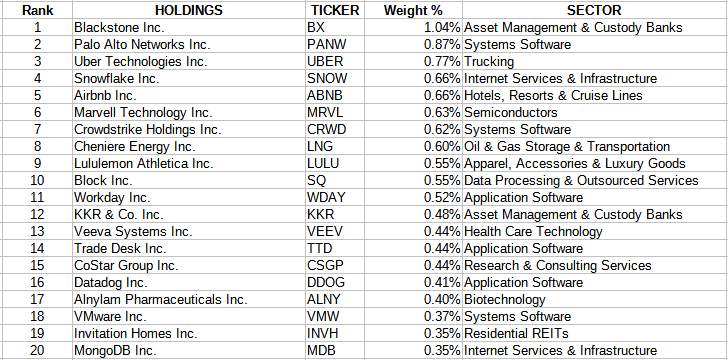
Here, with over 3600 stocks, the Top 20 come to only 11.2% of the portfolio. VXF holds 2.7% in cash assets.
VXF distribution review
seekingalpha.com VXF DVDs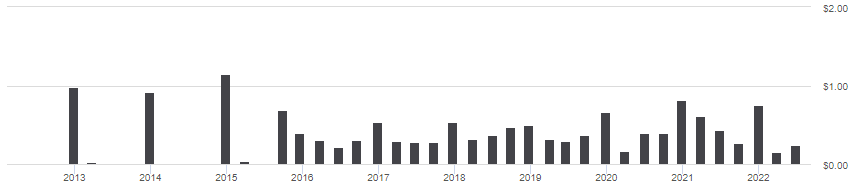
With a similar payout pattern to VTWO, VXF also gets a B+ rating.
seekingalpha.com VXF scorecard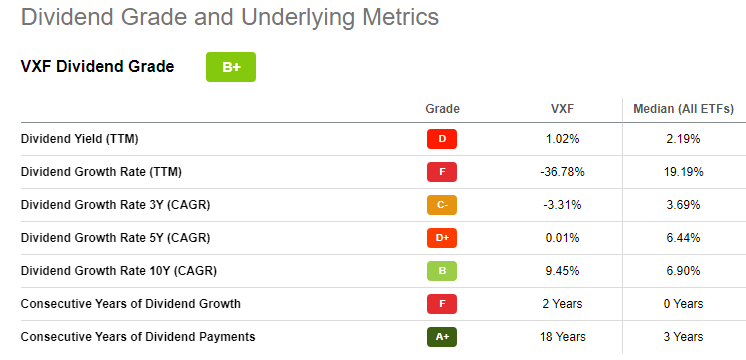
Comparing the ETFs
Advisors.vanguard.com; compiled by Author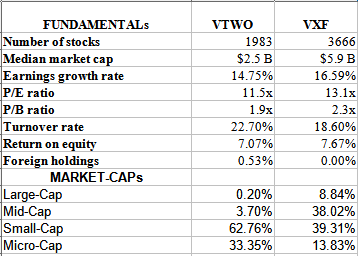
Vanguard classifies VTWO as a Small-Cap Blend ETF and VXF as a Mid-Cap Growth ETF, which becomes clear looking at the above data points and those classifications are also reflected in the Vanguard Equity Style boxes.
advisors.vanguard.com ETF compare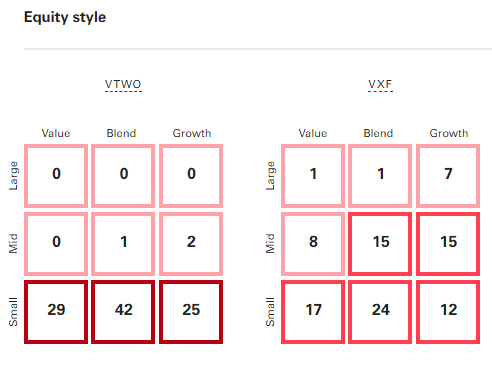
Investors can tell from the Style boxes, these are not interchangeable ETFs. As mentioned earlier, VXF has large percent in Mid-Cap (38% vs 3%). Despite Vanguard labeling VXF as a Growth ETF, its percent there (34%) is not that much higher than VTWO’s (27%), especially when the Value percentages differ by only 3%.
ETFRC.com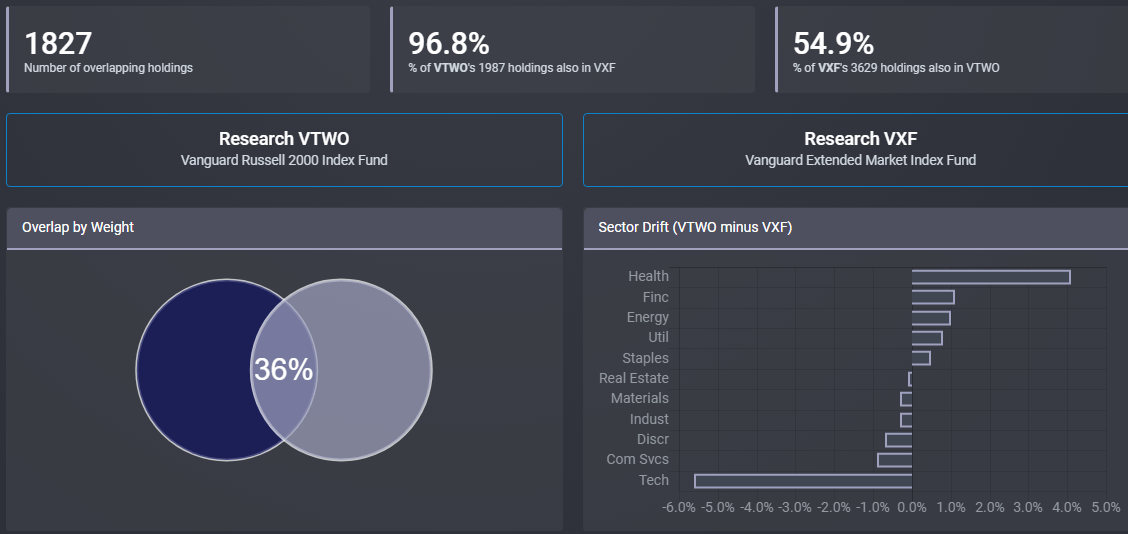
By holding VXF, an investor owns almost 97% of the stocks in VTWO, so no need to own both. There are two sectors where the ETF allocations differ by over 4%: Health for VTWO and Technology for VXF. For overlapping stocks, this is how it affects the largest allocations.
ETFRC.com Seekingalpha.com VTWO homepage seekingalpha.com VXF homepage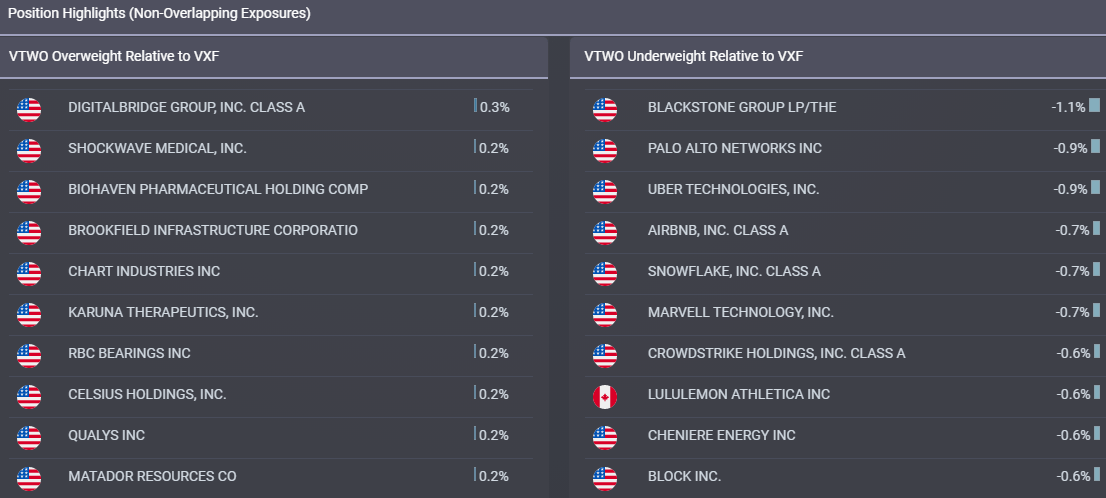
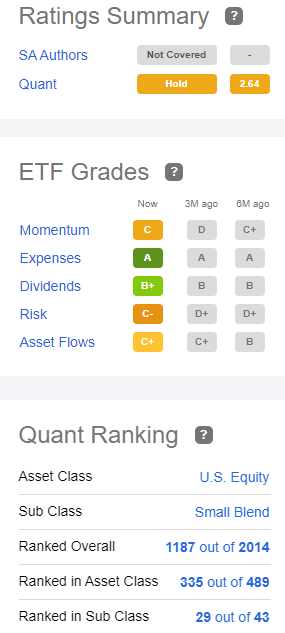
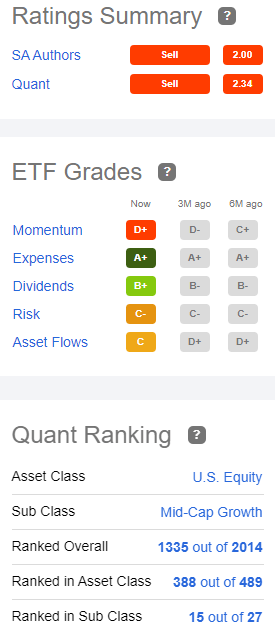
The Quant ranking system rates VTWO (#335) and VXF (#388) in the same Asset class. Like Vanguard, Seeking Alpha has them in a different sub-class.
Portfolio strategy
Since VTWO started, VXF has provided better results. With the understanding the two ETFs common investment strategy is limiting Large-Cap exposure, VXF has a median market-cap more than 2X that of VTWO, so it’s more geared to investors wanting an even split between Mid- and Small-Cap stocks. Another strategy would be to use separate ETFs for Mid- and Small-Cap stocks and set your own allocation. Vanguard has choices for that option too:
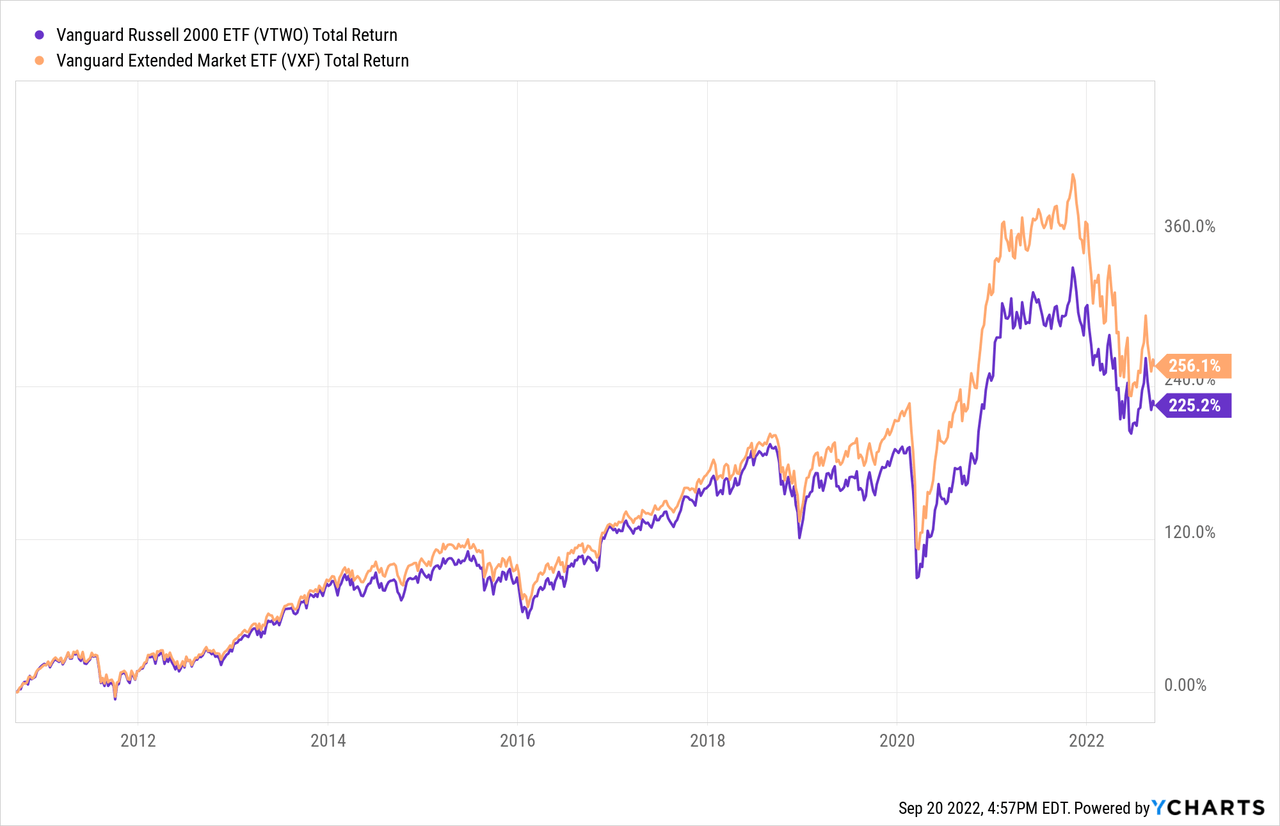
Since both hold Micro-Cap stocks, there is an ETF for that too: iShares Micro-Cap ETF (IWC). Here is how all five ETFs have performed since late 2010.
portfoliovisualizer.com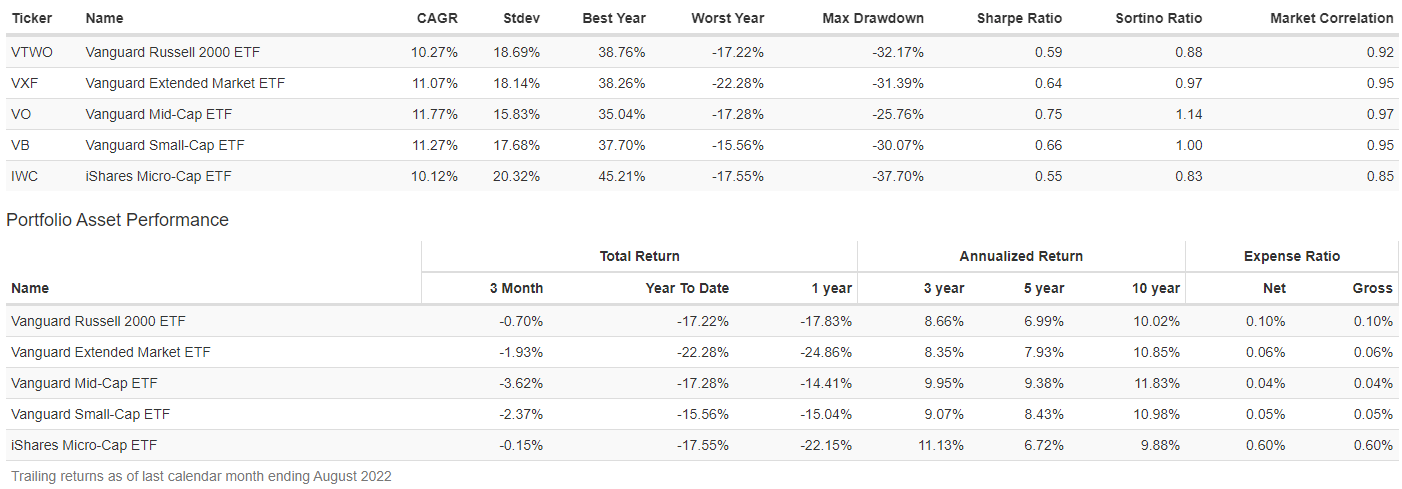
Over this time frame, as you go up the market-cap scale, performance improved, which explains why VXF did better than VTWO: allocation does matter. Looking at the monthly data, most times all three ETFs (VO, VB, IWC) moved in the same direction but not by the same degree.
Final thoughts
Between VTWO and VXF, the performance difference results in VXF being 9% ahead since 2010 when VTWO started. For investors with good timing models, using the three other ETFs makes more sense as they are single market-cap focused, unlike the two featured in this article. For others wanting a simple approach, the choice probably comes down to plugging a hole in one’s US equity allocation.
Be the first to comment