

sommart/iStock via Getty Images
Investment summary
As the market continues to digest a concrete set of macroeconomic variables unprofitable med-tech continues to remain out of fashion, by estimate. Our US equity strategy is seeking to position against long-term cash compounders that exhibit strengths in both earnings [realized and expected] and return on investment [ongoing and trailing]. After extensive examination, I’ve determined that InfuSystem Holdings, Inc (NYSE:INFU) displays a loose affinity to kind of equity premia described above. With narrowing ROIC and earnings trends there’s a lack of flesh to put on the skeleton in the investment debate here. Net-net, I’ve rated INFU a hold with a $4.40 price target.
Note: Before reading on, kindly remember that there are inherent risks when investing in small-cap equities. Our thesis is ‘neutral’, meaning it is suspect to both upside and downside risk. Price action can become disconnected from fundamentals and volatility can be higher than in more established markets. Whilst INFU’s extensive corporate history and deep customer networks offset this somewhat, these remain key risks to the investment thesis that must be considered.
INFU earnings pile – Q2 numbers give unique insights for FY22
INFU came in with a relatively soft set of numbers last quarter that missed consensus estimates both at the top and bottom lines. Net revenue of $27 million (“mm”) expanded 900bps YoY and was a quarterly record for the company. Segmentally, the bulk of upside was recognized in the biomed services business, locking in a c.36% YoY gain to $11.5mm. Revenue in this segment was booked under a new masters services agreement that started in April. INFU estimates a $10-12mm annual contribution in revenue from this contract “after an initial ramp-up period of approximately 15 months” per the 10-Q.
Meanwhile, due to the above-mentioned agreement, cost inputs were higher for Q2 and therefore cost of revenues and gross profit were higher and lower YoY respectively. Gross margin narrowed by ~500bps YoY to $14.9mm, or 55% of revenue. Moving down the P&L, and OPEX came in ~235bps higher from Q2 FY21, resulting in a net loss of $164mm or $0.01 loss per share, down substantially from the year prior at $820mm profit or $0.04/share.
In order get a truer understanding of what we are exactly buying in INFU, I’ve gone ahead and separated the numbers into an earnings and investment pile. With respect to the former, both revenue and earnings trends have levelled off to range on a sequential basis since FY20, as seen in Exhibit 1. Whilst realized FCF yields began to creep up from lows in FY19, these trends have reversed course from Q4 FY21 and are drifting lower.
Meanwhile, cash from operations has remained lumpy these past few quarters but isn’t showing signs of growing. Therefore, earnings-based valuation measures [P/E, PEG, earnings yield, etc] are presenting with less cash to back the actual valuation itself. To illustrate, as seen in Exhibit 2, the net income to cash flow ratio has drastically tightened on a quarterly basis since mid-FY21′. Meanwhile, Exhibit 3 illustrates INFU’s free cash flow bridge from revenue to the bottom line for Q2 FY22.
Exhibit 1. Quarterly cash flows and turnover have levelled off since FY20 producing lumpy FCF and realized FCF yield.
Note: All figures in $mm or [%]. Free cash flow calculated at [NOPAT – investments]. FCF yield calculated as a function of enterprise value. (Image: HB Insights. Data: INFU SEC Filings)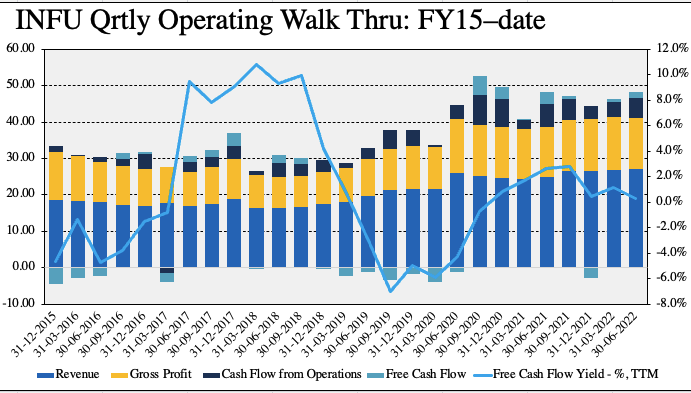
Exhibit 2. With less CFFO backing earnings [and P/E, earnings yield, etc.] This must be factored into the investment debate.
- Narrowing CFFO and earnings aren’t attractive features in the current climate.
- This is coupled by a tightening FCF yield.
Image: HB Insights. Data: HB Insights, INFU SEC filings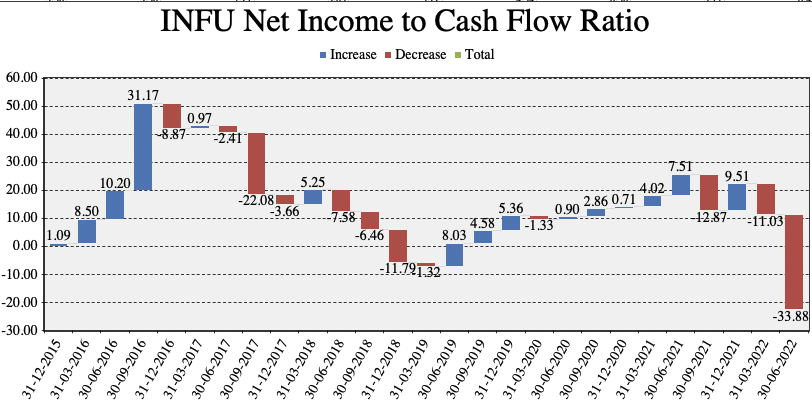
Exhibit 3. INFU FCF Bridge for the second quarter shows thin FCF conversion from revenue-CFFO.
Image: HB Insights. Data: HB Insights, INFU SEC filings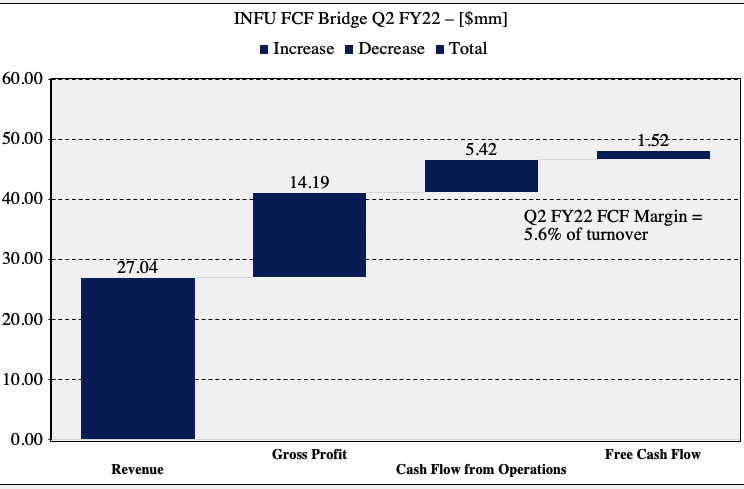
INFU investment pile – trends tightening
As observed in Exhibit 4, quarterly return on invested capital (“ROIC”) trends have narrowed since FY19. Excluding the Q2 FY17 and Q3 FY20 deviations in NOPAT trend, INFU’s realized return on investment has been on a sequential decline since FY15. It printed a ~30bps ROIC last quarter, down from 7% this time in FY20. At the same time, the company’s capital intensity has increased via the degree of invested capital made each quarter since FY18.
These are unfavorable trends by my estimation. Our US equity strategy is prioritizing long-term cash compounders that deliver substantial FCF below the bottom line. INFU misses this mark based on its capital budgeting decisions. Ideally, we’d see either a high degree of ROIC or at least see the number lifting a few points each period. Without the tangible cash flow to bolt onto the investment debate, this is a bearish tilt to the risk/reward calculus.
Exhibit 4.
Note: All figures in $mm or [%]. Return on invested capital calculated as net operating profit after tax / invested capital on a quarterly basis. (Image: HB Insights. Data: HB Insights, INFU SEC Filings)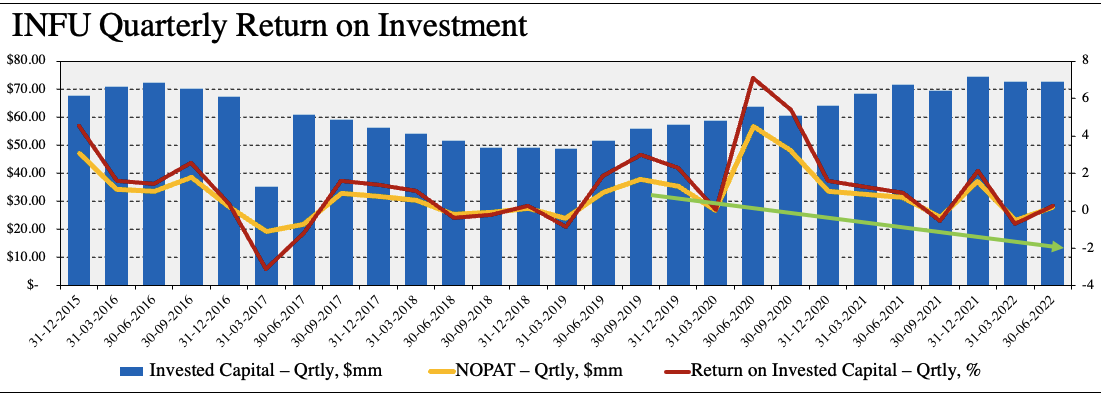
So INFU’s ongoing investment and capital budgeting trends are unappealing to our current strategy. What about its already existing investments/assets? As seen in Exhibit 5, the company’s return on average assets (“ROA”) and asset turnover have each taken a step back after peaking in FY20. Whilst TTM asset turnover is strong at $1.10 for every $1 in the asset base, the return on these prior investments/assets has dwindled into the red. Alas, these findings illustrate that return on INFU’s ongoing investment and its current asset base suggest a risk-adjustment to the valuation must be made.
Exhibit 5. Contrasting to INFU’s ongoing investment habits, the company’s return on prior investments/assets has also dwindled, accompanied with a reasonable asset turnover.
Image: HB Insights. Data: HB Insights, INFU SEC Filings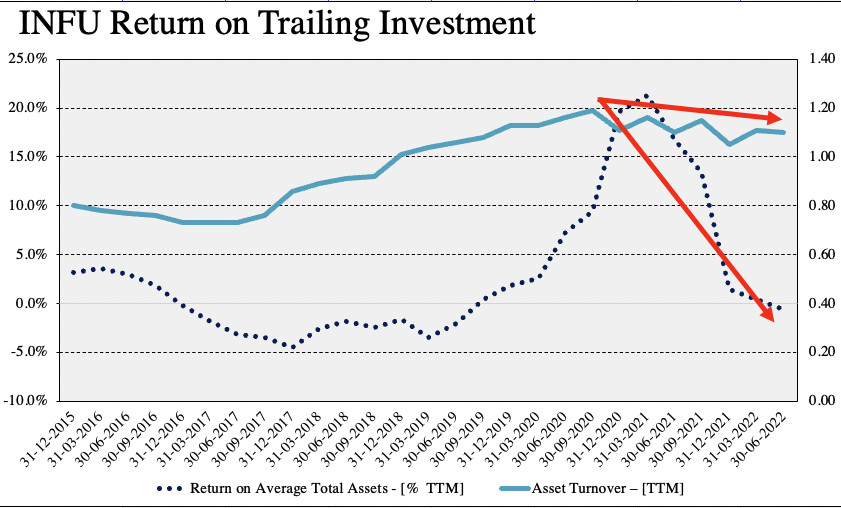
Valuation and conclusion
Shares are trading at a discount to GICS Industry peers used in this analysis, as seen in Exhibit 6. However, on a TTM basis [not shown], the stock trades at a substantial premium trailing P/E of ~117x. In addition, trading at ~3x book value and ~1.5x sales represent decent value relative to the peer group shown below.
Exhibit 6. Multiples and comps analysis
Data: HB Insights, Refinitiv Datastream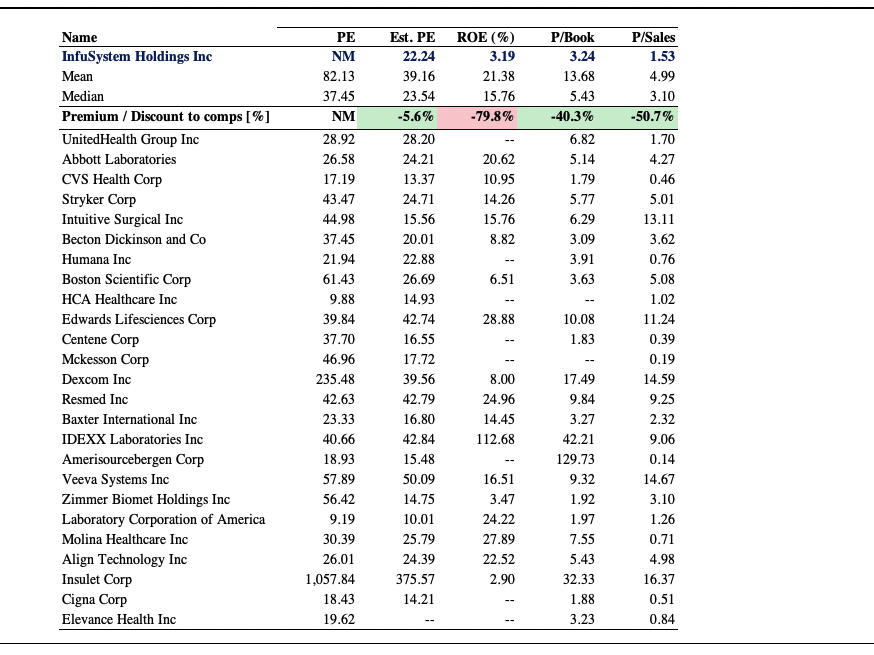
Consensus has INFU to print EPS of $0.06 in FY22 and $0.20 in FY23 and I’m satisfied with this number as it aligns with our own internal calculations for the stock looking ahead. At 22x this $0.06 estimate this sets a price objective of $1.33, well below the current market price. At 22x the FY23 estimates we’re at $4.40. In any sense, INFU looks overvalued considering the earnings and ROIC trends that have been outlined above. With a lack of flesh to put on the skeleton from all angles, I’ve re-rated INFU a hold with a $4.40 price target.
Be the first to comment