

S&P 500, FOMC, Dollar, USDCNH, Gold and USDJPY Talking Points:
- The Market Perspective: USDJPY Bearish Below 141.50; Gold Bearish Below 1,680
- While the S&P 500 led the risk-leaning spectrum to a modest slide this past session, a genuine trend will likely remain a stretch unless the fundamental upheaval can match FOMC expectations
- A full commitment from US indices or EURUSD may be a high threshold for motivation but USDCNH and gold have registered pro-Dollar breaks with Chinese and UofM data ahead
Trade Smarter – Sign up for the DailyFX Newsletter
Receive timely and compelling market commentary from the DailyFX team
Subscribe to Newsletter
Risk Assets Sink but Traction Remains a High Bar: S&P 500 and Event Risk
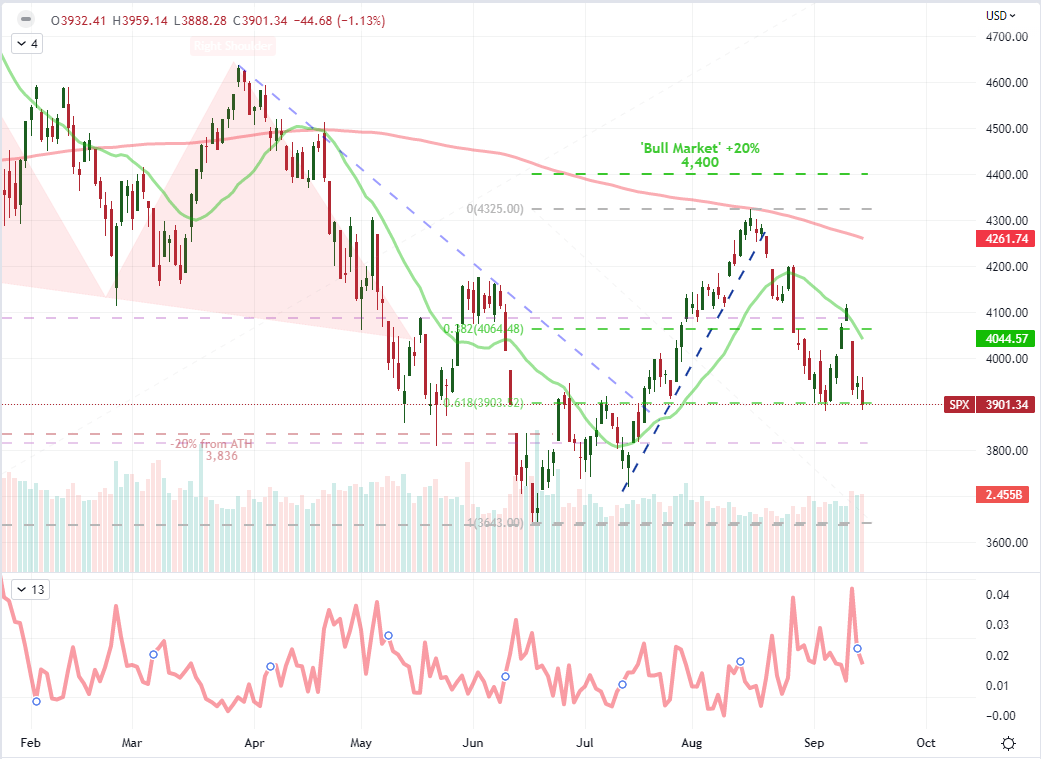
The FOMC rate decision is approximately three trading days away. Expecting the market to commit to a clear bearing on speculative trends before the fundamental wave hits seems impractical with the simple proposition of volatility. There remains unresolved fundamental themes and scheduled event risk Friday that can tap into serious interests, but that override the interest around and reach from the avalanche of interest rate announcements due next week starting in earnest with the US central bank Wednesday afternoon/evening. Practically, that translates into reticence for me. The S&P 500 technically dropped -1.1 percent this past session and is tentatively slipping below range support and the 61.8 percent Fibonacci retracement of the June 17 to August 16 bull trend. Volume behind the market was also remarkably robust. And yet, the market’s traction left much to be desired for those looking for conviction. The volatility (ATR) of the past 2 trading days relative to the previous two weeks registers a sharp slowdown. It is possible that we can upend confidence – bullish or bearish – before next week’s FOMC spark, but I remain skeptical.
Chart of S&P 500 Emini Futures with Volume, 50 and 200-Day- SMAs as well as 1-Day ROC (Daily)
Chart Created on Tradingview Platform
Looking to the economic docket for next week, it should be clear why the markets are imbued with an artificial sense of resilience. Given the most productive general fundamental themes these past weeks and months have focused on the complications of monetary policy and the risk of recession, the items on deck should clearly stir concern. The focus of rate speculation moving forward will principally fall on the Federal Reserve Wednesday at 18:00 GMT. Fed Fund futures are still pricing in an approximate 20 percent probability of a 100 basis point rate hike while the subsequent update on forecasts from the SEP (summary of economic projections) will be closely observed. Beyond that single release, the PBOC and BOJ will be pressed for their dovish credentials. On the hawkish side, the BOE is seen hiking 50bp, the SNB is expected to lift 75bp to follow its Euro-Area counterpart and numerous emerging market groups will be dealing with high volatility. On the growth side, in addition to the SEP, the developed world PMIs for September on Friday will be an important run.
Critical Macro Event Risk on Global Economic Calendar for Next Week
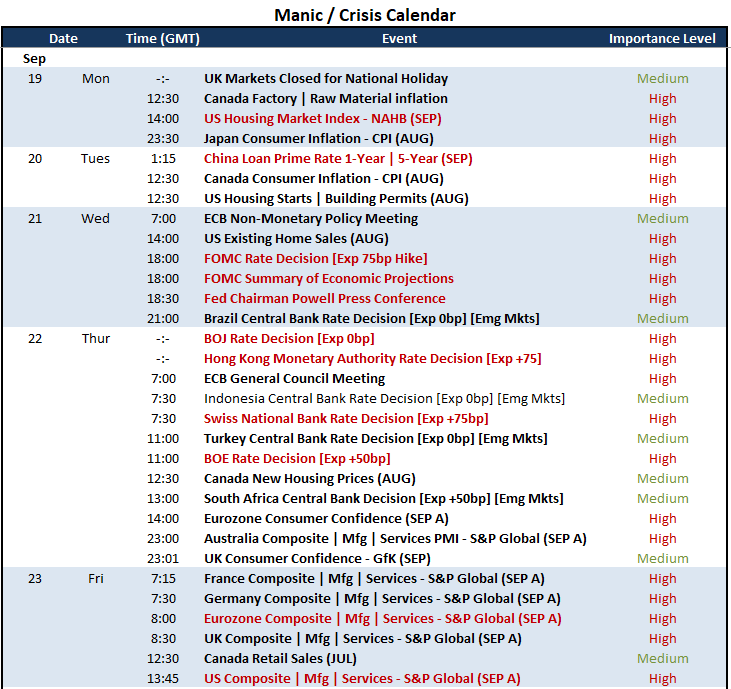
Calendar Created by John Kicklighter
Markets Like Gold are Still Moving: Gold and USDCNH
As we monitor the markets, attention principally focuses on the top-level assets, naturally. Yet, the more liquid and fundamentally prolific the assets, the more dependent they will be on the resolution of next week’s critical event risk. Yet, not all markets are relegated to the speculative gridlock. One very remarkable technical development this past session was Gold’s slide through 1,675. That level was a range floor for the commodity stretching back two-and-a-half years. There was also the technical relevance of a long-term Fibonacci level and the 200-week moving average in the same area. Slipping that level, in other words, was no small feat. That said, it isn’t exactly the greatest fundamental surprise given that global interest rates are rising rapidly. This ‘alternative to fiat’ struggles when yields are on the rise because gold doesn’t offer interest like financial assets.
Recommended by John Kicklighter
How to Trade Gold
Chart of Gold Futures 20 and 200-Week SMAs with Volume, COT Net Spec Positioning (Weekly)
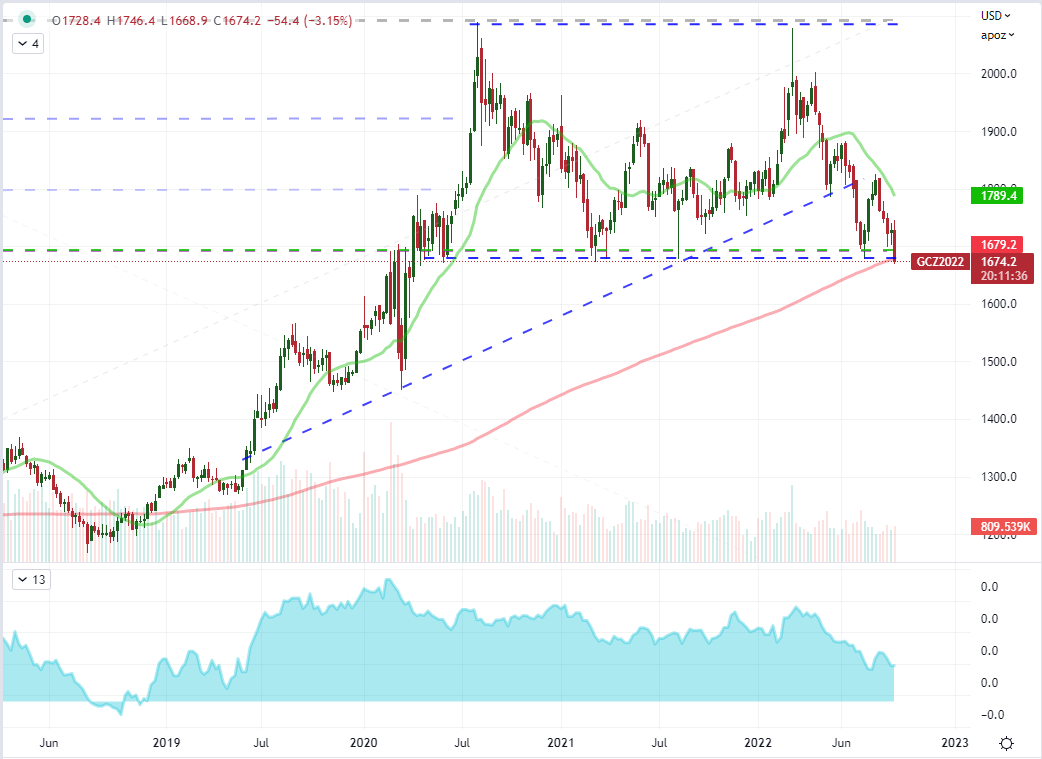
Chart Created on Tradingview Platform
Another technical development that stood out to those that have been tracking macro developments before the pandemic was the advance Thursday of USDCNH through the 7.0000-mark. Historically, that particular level on the US-China exchange rate was held out as a political tipping point whereby it was believed by Western observers that China was making a point to devalue its local currency in order to blatantly offset the sanctions placed on its own exports. This past session, US President Biden announced that he had signed an order to further screen Chinese investment to the United States tech sector. I don’t think the same level holds the same degree of consequence that it had previously, but many of the issues remain. Nevertheless, with a clear disparity in monetary policies, an appetite for safety and trade issues; the charge is not outside expectation.
Chart of USDCNH with 20 and 200-Day SMAs (Daily)
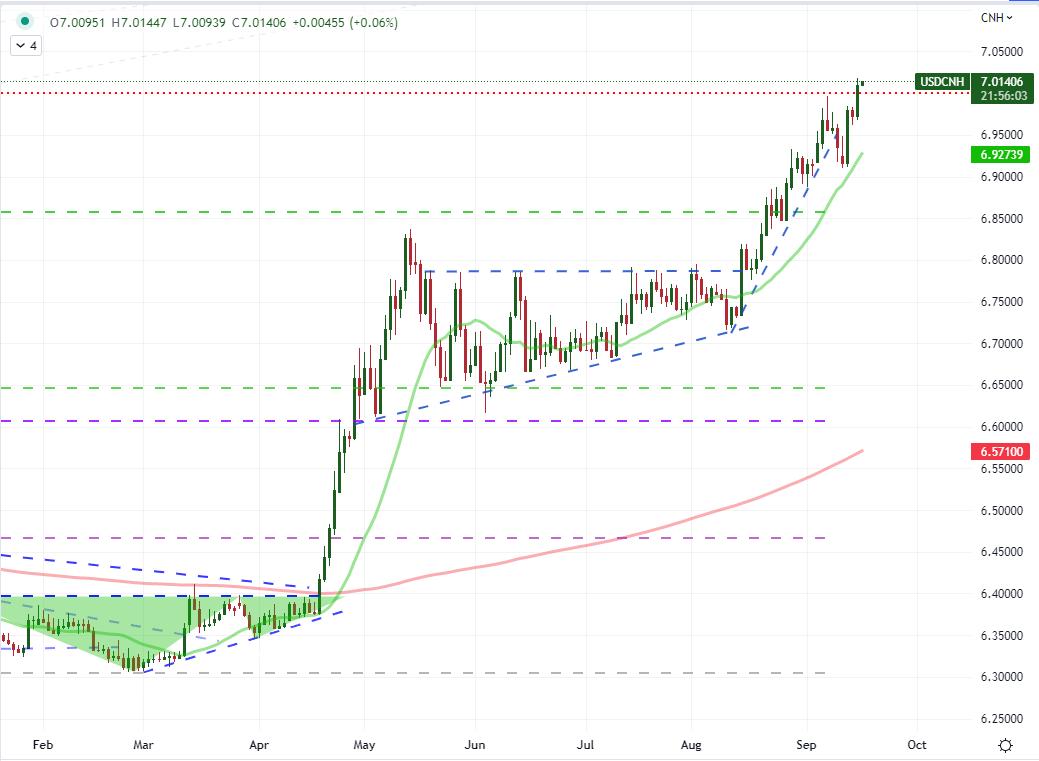
Chart Created on Tradingview Platform
For Friday: Volatility Risks in Chinese Data and the University of Michigan Sentiment Survey
While I don’t believe this final 24 hours docket can systemically override the combination of the anticipated weekend liquidity drain and next week’s overwhelming fundamental run to produce a serious trend, it can reasonably urge volatility. There is a range of event risk worth watching, but separating the economically important from the market-moving is an important exercise. For example, the UK retail sales report, New Zealand business sentiment survey and Canadian capital flows are all interesting given the relative position of their respective currencies. However, the run of Chinese data for August is a big picture update on the second largest economy in the world while the US sentiment survey is only one degree of separation from inflation and recession fears.
Critical Macro Event Risk on Global Economic Calendar for Friday
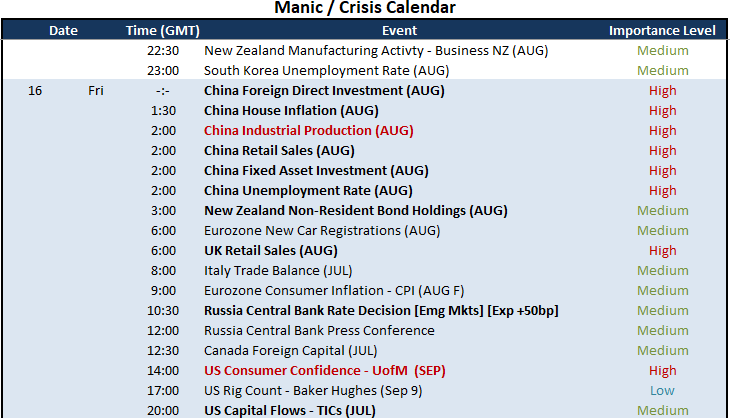
Calendar Created by John Kicklighter
Top event risk for me is the University of Michigan sentiment report. At the last update, the US consumer reported a big jump in confidence to help pull us up from a multi-decade slump in confidence. That rebound played a critical roll in the market’s interpretation of inflation figures that turned from a possible peak which leveraged a serious market move. However, the falter from the CPI bearish trajectory has shaken convictions. If the UofM reinforces that skepticism around recovery given that it is a forward looking indicator, it could tip a more exposed nerve around ‘fear’ that actually caters to the market’s liquidity state. Beyond the headline figure, watch the expectations and inflation components.
Chart of UofM Consumer Confidence Overlaid with US GDP (Monthly)
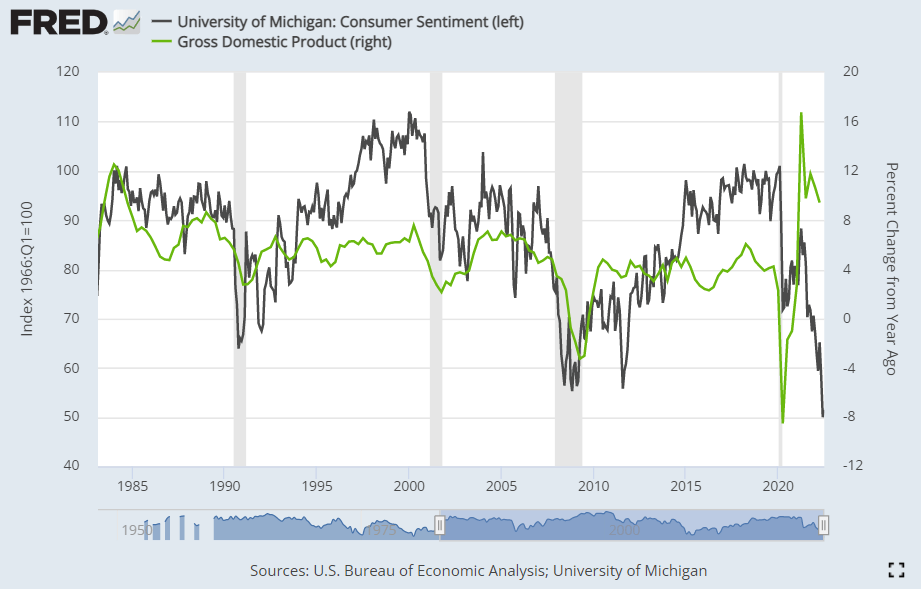
Chart from the St Louis Federal Reserve Economic Database with Data from BEA and UofM
Be the first to comment