

RichVintage/E+ via Getty Images
It’s been another rough couple of weeks for U.S. stocks since my last update. A clear absence of upside momentum ideas has existed on the drawdown in pricing. With no new VBR selections showing up in my mechanical momentum screens, dependent on rising prices and buying trends, I decided to bypass posting any article last weekend. What’s the point, if I cannot find new and engaging bullish setups. Unfortunately, I only have one name to analyze again in the middle of September, Comstock Holding (CHCI).
Pick Performance Review
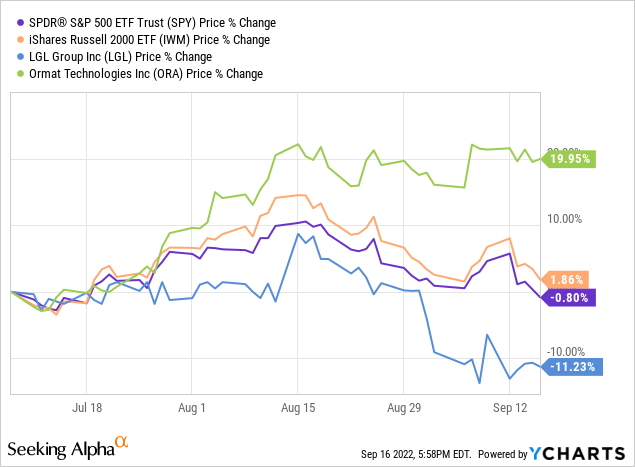
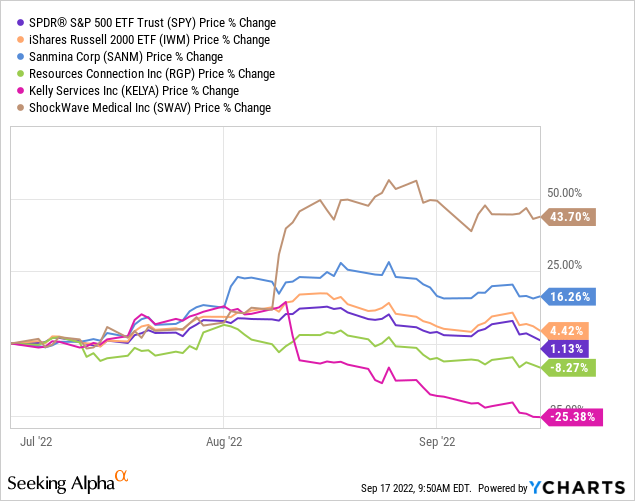
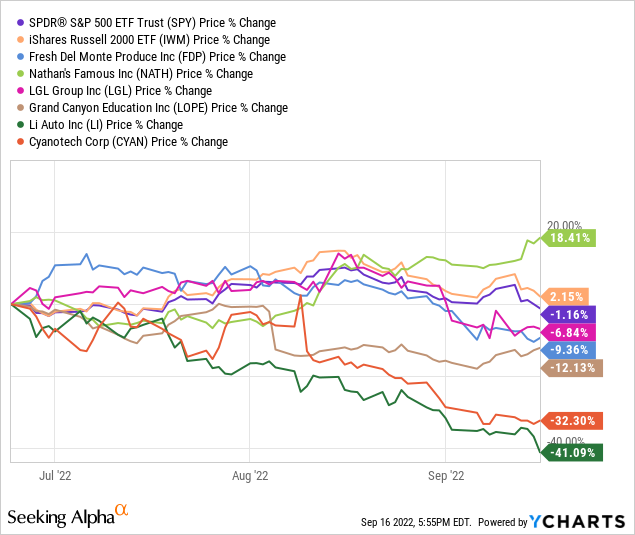
Lacking an article effort over two weeks, I thought I could post some charts on all the previous picks since June 25th, comparing price performance to the SPDR S&P 500 ETF (SPY) and iShares Russell 2000 ETF (IWM).
Again, I will mention the volume breakouts I am searching for, tend to perform best (earning a trading/investing profit) when the market overall is stable to rising. When we experience volatility on the downside for Wall Street, my VBR picks tend to have a more difficult time historically making headway vs. the market index averages. Evidence of this outcome can be found in the sliding relative performance from the summer market peak 3-4 weeks ago. Going into the August high, VBR outperformance numbers were quite positive.
I would term the performance of all 45 picks in the group as “acceptable” (44 names, with one picked twice in different weeks). The mean average return has beaten the Russell 2000 by +0.36%, using price only (excluding dividends and trading costs), when measured from the Friday closing values before VBR updates posted each weekend into Friday, September 16th’s close. The small cap Russell has held up far better than the S&P 500 in price since late June. So, the VBR lists have outperformed by +1.95% for a mean average, over periods ranging from 2 weeks ago to less than 3 months held.
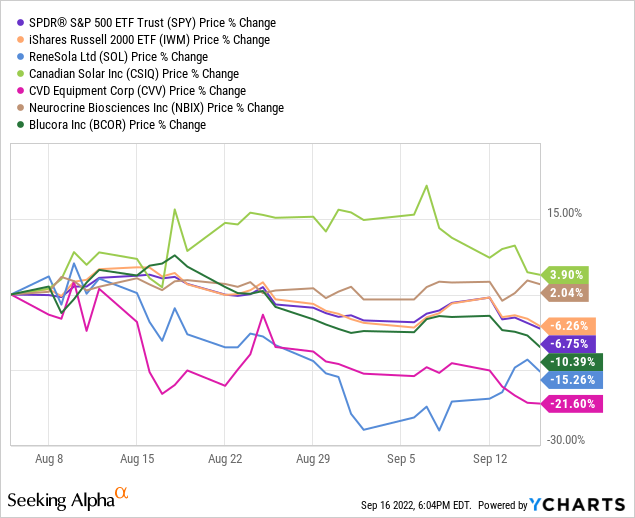
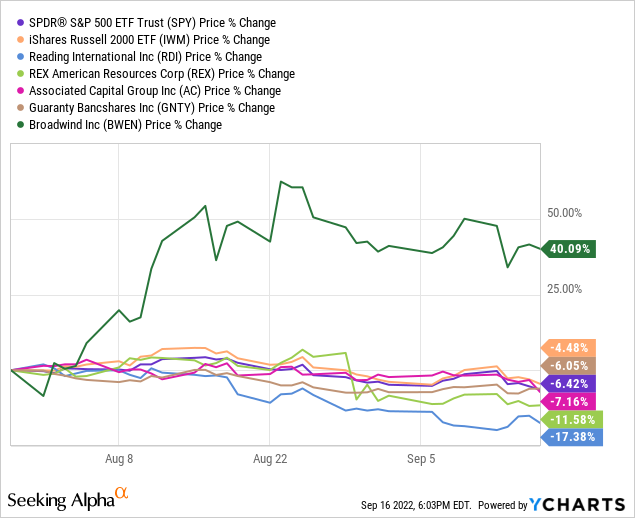
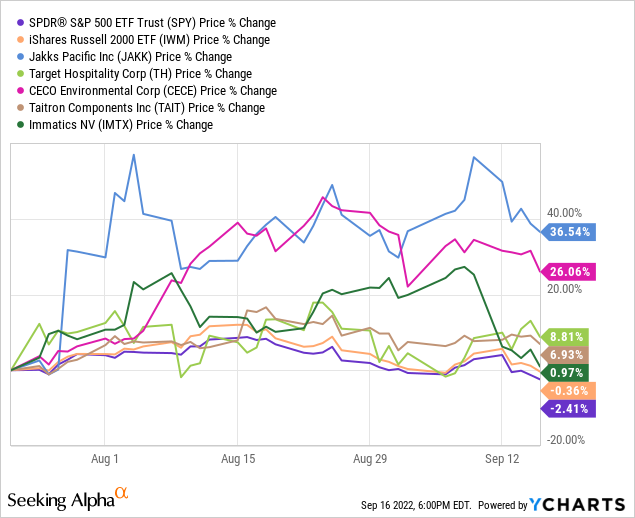
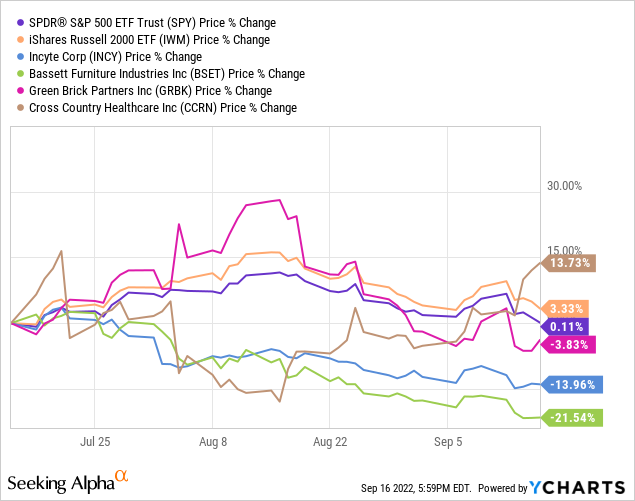
Below I have graphed each weekly VBR list, using price only for comparisons. Of course, the first week has turned out to be a real stinker (as luck would have it). Actively cutting losses in several names beyond 20% or 30% dips like I have suggested, could have improved the buy-and-hold performance by about +0.5% for the group. I did specifically talk about selling Li Auto (LI) a month after the VBR buy signal. In addition, not mentioning Target Hospitality (TH) sooner was a mistake that cost better than 1% in the total outperformance calculations above. So, statistically speaking, given the weakening market backdrop, the returns have been OK, although far from spectacular.
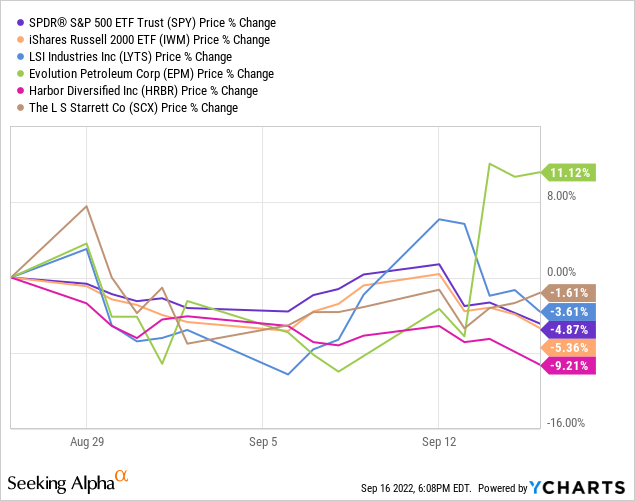
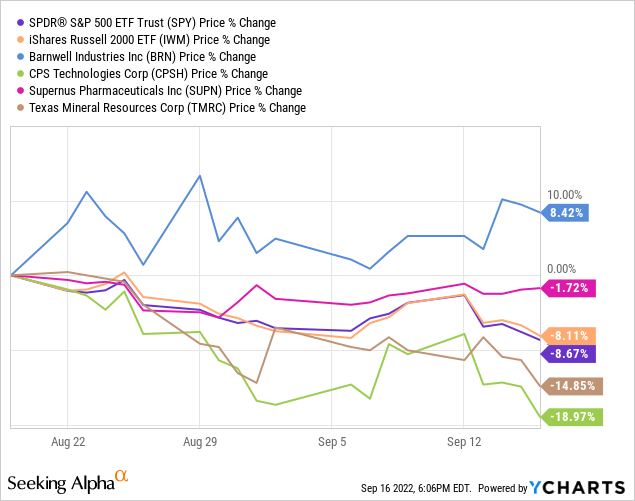
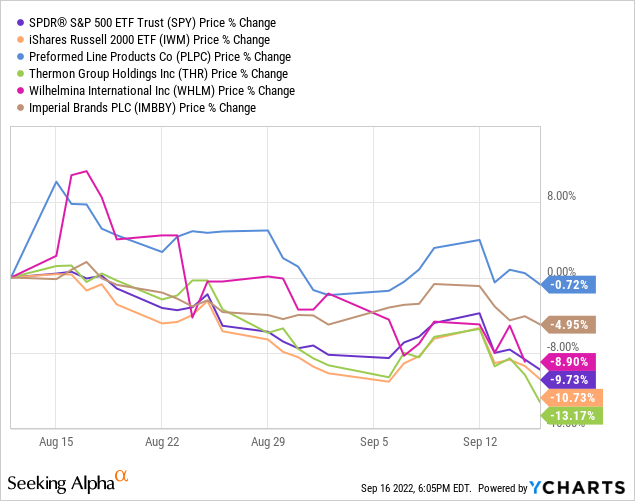
VBR Pick Performance – September 2nd, 2022 VBR Pick Performance – August 26th, 2022 VBR Pick Performance – August 19th, 2022 VBR Pick Performance – August 12th, 2022 VBR Pick Performance – August 5th, 2022 VBR Pick Performance – July 29th, 2022 VBR Pick Performance – July 22nd, 2022 VBR Pick Performance – July 15th, 2022 VBR Pick Performance – July 8th, 2022 VBR Pick Performance – July 1st, 2022 VBR Pick Performance – June 24th, 2022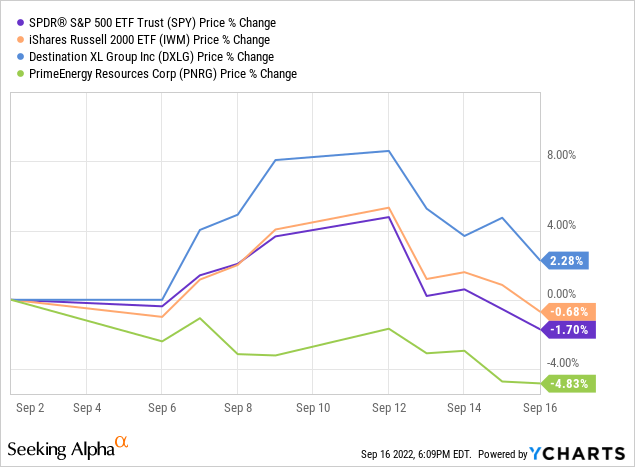
New Buy Pick – Comstock Holding
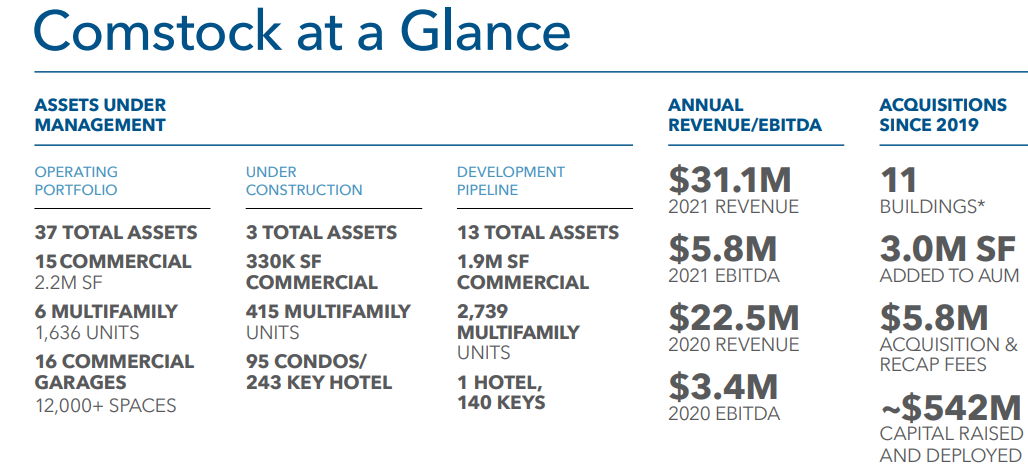
Comstock Holding Companies is listed as a home construction organization by most Wall Street firms and financial data sources. In fact, the company moved into real estate development and management services in 2018. It focuses on property holdings in the high-growth, technology company rental areas around Washington DC. The enterprise is a micro-cap, sizing a market capitalization of just $47 million at $4.80 per share on Friday. However, you are getting experienced and skilled managers focused on growing the business quickly in the years ahead. For investors searching for hard assets, real estate exposure should continue to be an efficient inflation hedge into the future.
Comstock – June Investor Presentation Comstock – June Investor Presentation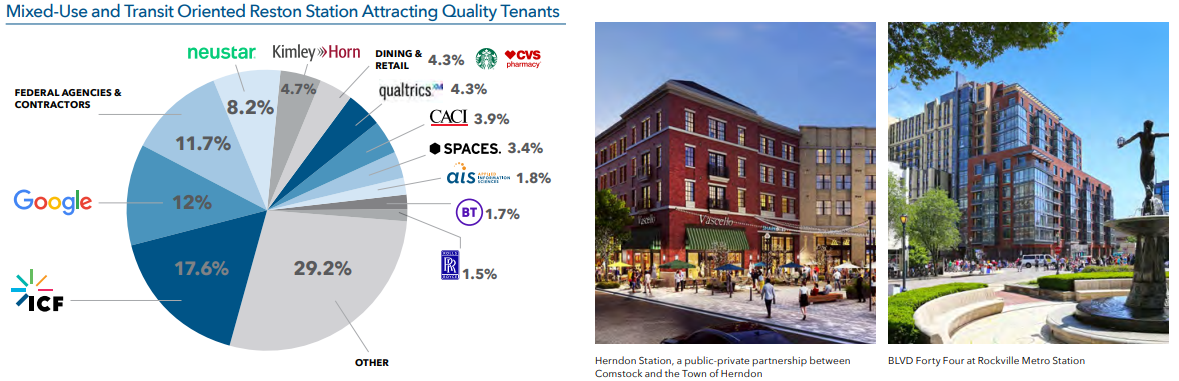
Looking at valuation ratios, the stock appears quite cheap if total assets, sales and earnings are in the early stages of ramping higher. Price to trailing earnings, sales, cash flow and book value are all far, far below U.S. equity market averages, between 50% and 70% discounts to the S&P 500 index.
YCharts, NVR Fundamental Valuation Ratios – 3 Years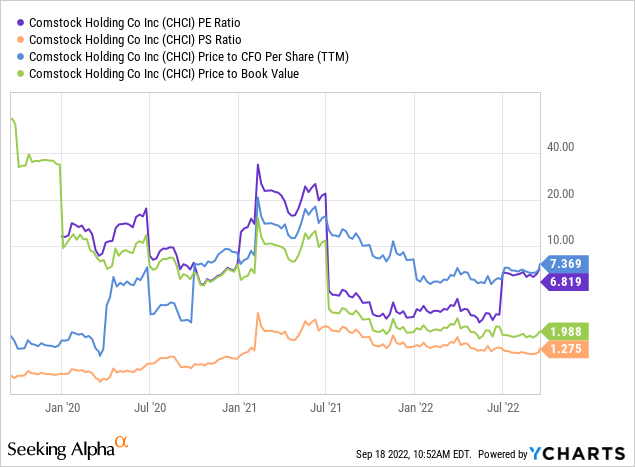
Seeking Alpha contributor Ryan Bowen wrote an excellent piece on the fundamental undervaluation of the company several weeks ago here. Below are some of the key highlights for Comstock from his research:
EBITDA grew to $5.8m in 2021 versus $3.4m the year before, 71% growth. Enterprise value of $25.51m implies a EV/EBITDA multiple of 4.4x. Earnings should grow in coming years as construction finishes on buildings that are already leased up. Q1 earnings were $1.75m.
Strong balance sheet with $11.560m in cash and $5.5m in debt.
As an asset management company, they are incredibly capital light having spent an average of $112,000 annually on capital expenditures over the last five years. That represents just 2% of FY22 EBITDA.
Synergies in the business model allow Comstock to acquire minority ownership in a building and get paid to manage it. Asset management agreement in place to manage core portfolio of assets at least until 2035.
This agreement also ensures at least an annual $1m payment plus various fees related to maintaining the property which helps to mitigate downside risk.
Another interesting angle that should support the price long term revolves around the ownership structure. New 31% owner Dwight Schar, a billionaire who founded one of the most successful homebuilders in America, NVR (NVR), purchased Comstock shares in the low $4 per share zone during 2022. Schar and CEO Chris Clemente own the Anchor Portfolio assets that Comstock manages. Schar is also Clemente’s father-in-law, with a similar 31% ownership stake in Comstock. It appears Schar’s retirement from NVR this year has opened up time and energy for new ventures like Comstock. The good news is investors can now team up with these two real estate investment experts and coattail ride any large equity gain in Comstock from today. Below is a graph of how successful Schar’s main real estate company has been over the last 20 years, looking at total investment returns vs. the leading S&P 500 ETF and SPDR Homebuilders ETF (XHB).
YCharts, NVR Total Returns vs. U.S. S&P 500 and Homebuilder Peers – 20 Years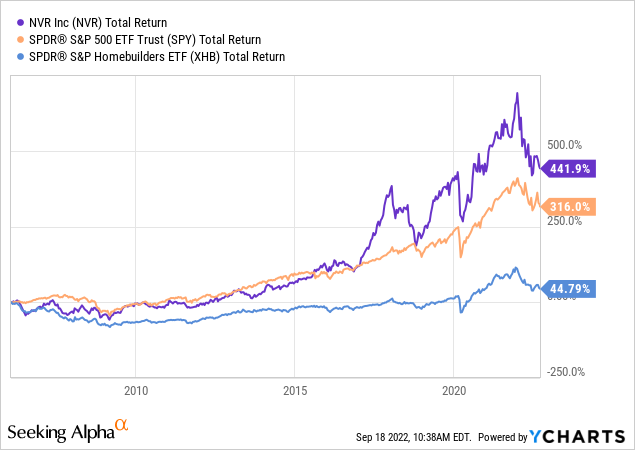
In terms of buying momentum, the stock quote on Friday broke out to a new multi-month high, despite a serious Wall Street selloff. The 50-day moving average is turning higher, and the 200-day will reverse into an uptrend on further price advances in the weeks ahead. I also like price breaking above the basing “triangle” pattern since May.
StockCharts, CHCI – 1 Year of Daily Changes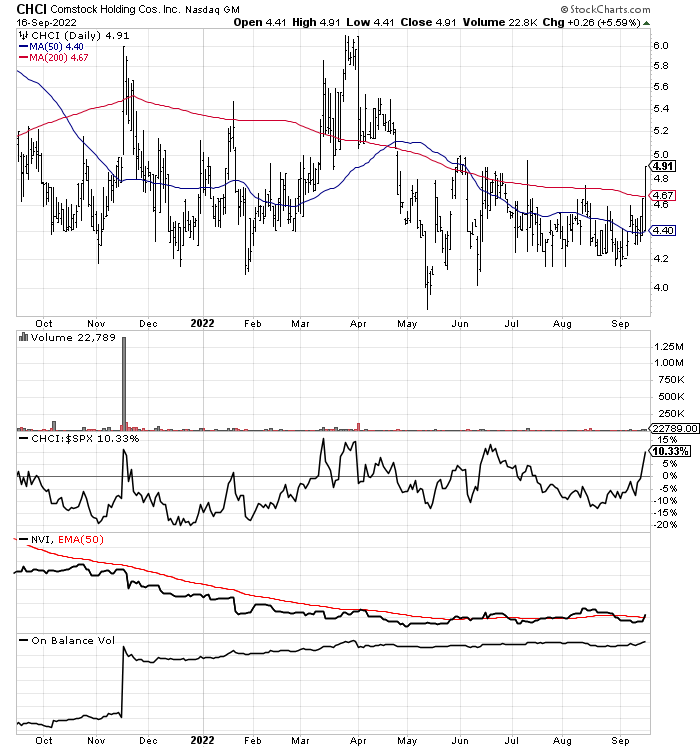
Final Thoughts
If the market continues to crater over coming weeks, I do not expect big things from the VBR list for performance. In addition, new picks may be limited until Wall Street can find a meaningful bottom. When new momentum choices show up in my computer sorting formulas, I will continue to write about them. However, we may have to bide our time waiting for better investment opportunities.
If new to the Volume Breakout Report series, you can read past efforts to get a better understanding of this research effort. The July 9th update is a good place to start, with strategies on how to use VBR picks. High-volume advances in price are just one part of the system and proprietary formulas. Daily computer searches that utilize as many as 15 indicators of technical trading momentum are ranked against thousands of equities, to find the best opportunities. Then, a review of company fundamentals and growth prospects narrows each list to the picks I write about.
Please consider using preset stop-loss sell orders to reduce downside potential in individual names. Depending on your risk tolerance, 20% to 30% stop levels are recommended. Cutting your losses quickly is an important part of the investing process, while winners should be allowed to run for a spell. My goal is VBR selections can deliver a win/loss success rate of 60% over 6-8 weeks of trading. A diversified basket of selections (at least 20-30 names) is the smartest way to reduce risk, as smaller companies can experience wild price swings, with minor dollar amounts able to move marketplace equilibrium quickly. By the time good news events are released to the public, insiders and knowledgeable long-term investors in each company have often purchased shares before the typical retail investor can act. The VBR is an early signal tool for investors looking for a trading edge.
Thanks for reading. Please consider this article a first step in your due diligence process. Consulting with a registered and experienced investment advisor is recommended before making any trade.
Be the first to comment