

Dow, GBPUSD, VIX, Dollar, EURUSD and Recession Talking Points:
- The Market Perspective: USDJPY Bearish Below 141.50; Gold Bearish Below 1,680
- Seasonally, volatility has continued to climb into the 39th week of the year while SPX historically averages its worst loss – Monday seems to be living up to the norm
- For risk watchers, the Dow’s tip into a ‘bear market’, GBPUSD extreme volatility at record lows and the traction on recession worries can more than anchor fears
Discover what kind of forex trader you are
Risk Aversion Carries Over Into the New Trading Week
For anyone hoping for a ‘fire break’ from last week’s post-FOMC risk aversion outbreak, Monday’s volatility and general slide in most assets with a speculative designation would put to bed the fall back on hope. There was a broad struggle in the sentiment-oriented markets this past session, but I would say that the absolute highlight was the British Pound. In the past decade there are only a few times I can recall whereby the Sterling was the top designate risk trends (generally in a negative light). The Scottish referendum, general vote, Brexit vote and an acute flash crash were previous points in time GBP topped the global speculative conversion. Add Monday, September 26th, 2022 to that list. A push to record lows as the culmination of monetary policy discrepancy, growth under-performance and the failure of any safe haven status amplified some suspicious activity during very thin liquidity. Nonetheless, this is the third most liquid currency cross in the world comprised of the FX offering of the world’s largest and fifth largest economies. This kind of activity is worthy of our attention and concern.
Chart of GBPUSD with 20 and 100-Day SMAs, Daily ‘Tails’ (Daily)
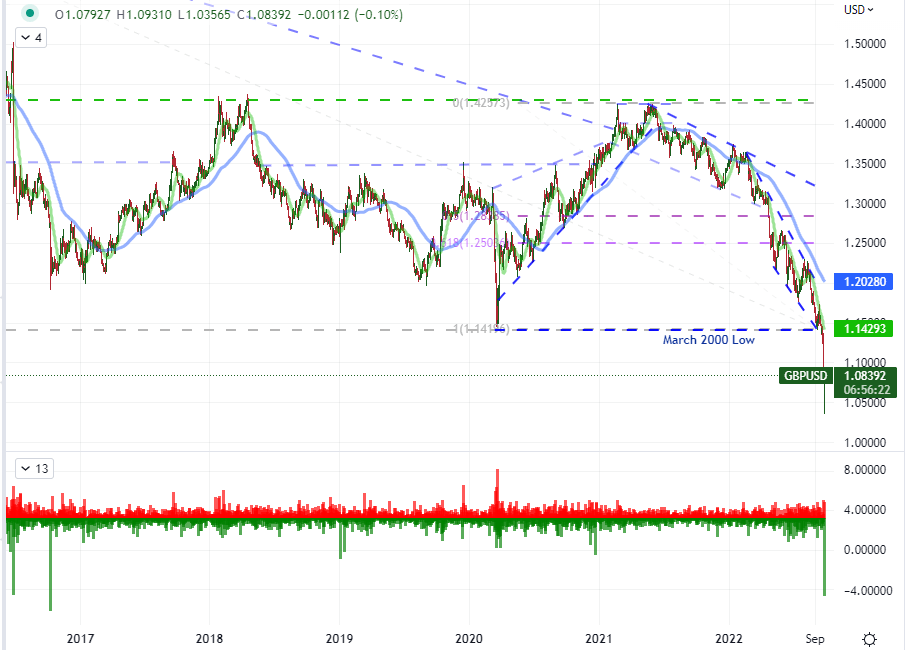
Chart Created on Tradingview Platform
While there is fraying in certain corners of the financial system, we should always keep track of the undercurrent. As a more traditional speculative milestone, the Dow Jones Industrial Average’s -1.1 percent drop this past session has officially pushed the so-called ‘value index’ into an official ‘bear market’ (defined by a 20 percent correction from all-time or cyclical highs). This is not exactly a surprise given the S&P 500 earned the unfavorable designation back in June and the Nasdaq 100 in March – almost seems a quarterly thing – but the erosion to confidence born of complacency and justification will take a serious hit. If the headlines continue to fill with reference to this blue chip’s capitulation, it can reach the ears of institutions representing larger pools of capital that can be urged to re-position as a move from noise to signal.
Chart of Dow Jones Industrial Average with 20 SMA, Consecutive Candles and 5-Day ROC (Daily)
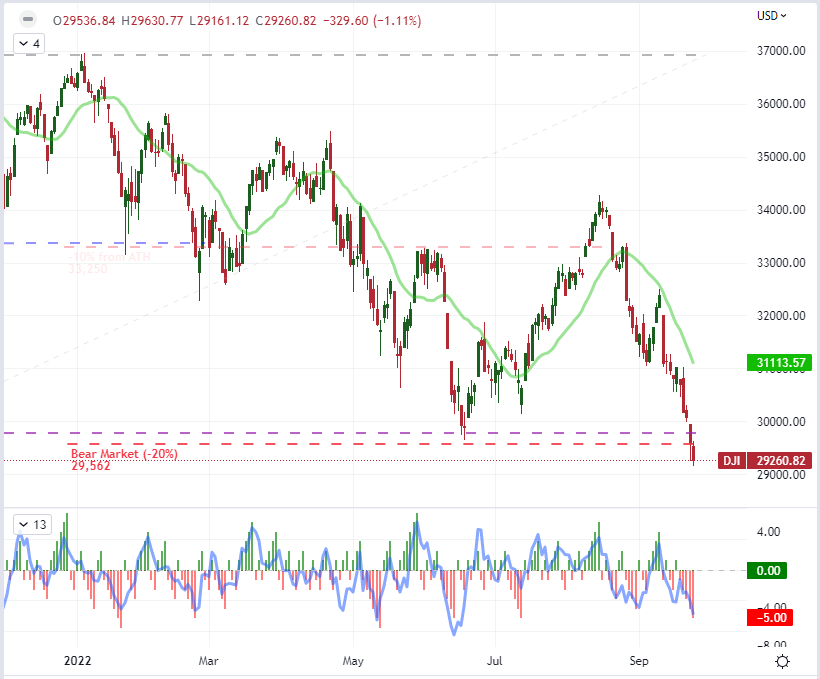
Chart Created on Tradingview Platform
The Severity of Risk Trends and Seasonality
Historically, we are moving into one of the worst periods of the year for the benchmark risk measures that I track. September represents the only month of the calendar year where the S&P 500 has averaged a loss back to 1980 while volume begins its recovery and volatility peaks in this month and into October – perhaps it is the volatility paired with the still thinned liquidity backdrop that renders such exceptional conditions. As I’ve been pointing out, the 39th week of the year (which we are currently traversing) is the worst overall in the year on average; and current conditions only amplify this possibility. This is the last week of September and any lingering fog around outright concern in the financial system is quickly burning off. While we don’t have to live up to historical averages, fighting the statistically relevant is just as dubious an approach.
Chart S&P 500 Average Weekly Historical Performance from 1900 to Present
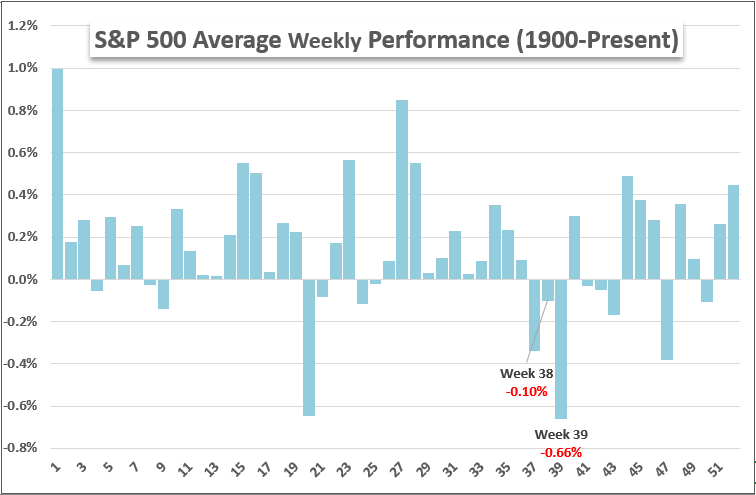
Chart Created by John Kicklighter
Visualizing the state of the markets, I have updated my ‘risk severity’ gauge. I believe we are seeing many of the hallmarks of a market environment that can break a severe and/or sustained unwinding of speculative exposure. Generally, a high correlation of risk-sensitive assets paired with severe moves from a number of those key players is the starting point of my assessment. I believe that is a fairly prolific sign at present with global equities, emerging market assets, junk bonds, speculative commodities and haven assets (with an inverse performance) all lining up. This sets the groundwork for a prolific development, but it does not have to keep the market’s head under water.
Chart of Market Risk Severity
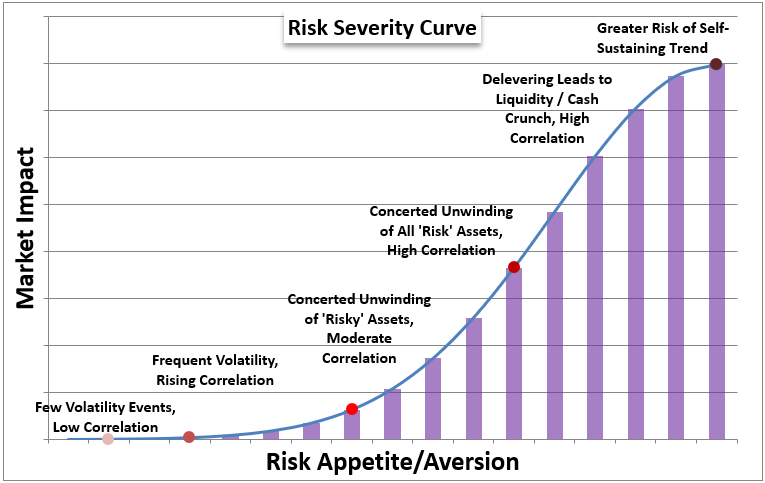
Chart Created by John Kicklighter
For a more practical and timely assessment of the otherwise abstract view of ‘risk trends’, volatility measures across the aforementioned asset types is useful. In the past week, there has been a decisive pick up in expected (implied) volatility measures lead by the FX market. With USDJPY suffering from the intervention impact, EURUSD marking progress in the drop through parity and GBPUSD’s extreme volatility at record lows; it should come as little surprise that currency traders are bolstering the hedging costs for such stability pressure on what are otherwise the most liquid assets in the financial system. The further these measures rise, the greater my concern will grow for a ‘financial crisis’.
Chart of Different Asset Class’s Volatility Measures Year-Over-Year
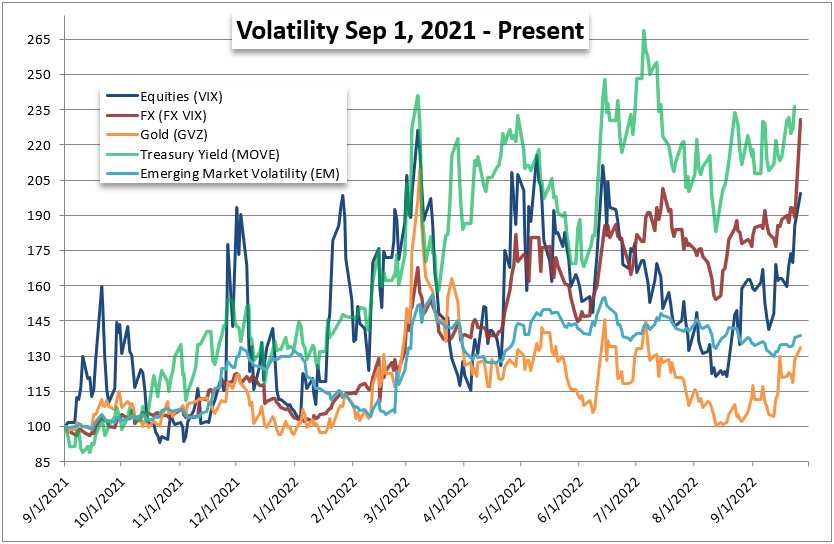
Chart Created by John Kicklighter
Fundamentals to Watch Moving Forward: Recession Fears Top the List
Fear does not develop in a vacuum – though panic can certainly derive from price alone. In reality, there are plenty of systemic issues that can pick up the torch of market fallout moving forward. I maintain that one of the broadest possible threats that is far from full discount in the global market is the risk of global recession. The imbalance between the outlook between the Eurozone and US economies (both generally negative) has personified this dimension of risk with the news that Italy’s election has put the Brothers party into power. The group has wed the Italian public and attempted to sooth concerns of a far-right lineage, but international investors are concerned that the political log jam will intensify and Europe’s economic struggle will only intensify. It is this backdrop that seems to align better to EURUSD performance than a simple EZ-US yield differential as a carry backdrop.
Chart of EURUSD with Italian Yield Premium and German-US Yield Differential (Daily)
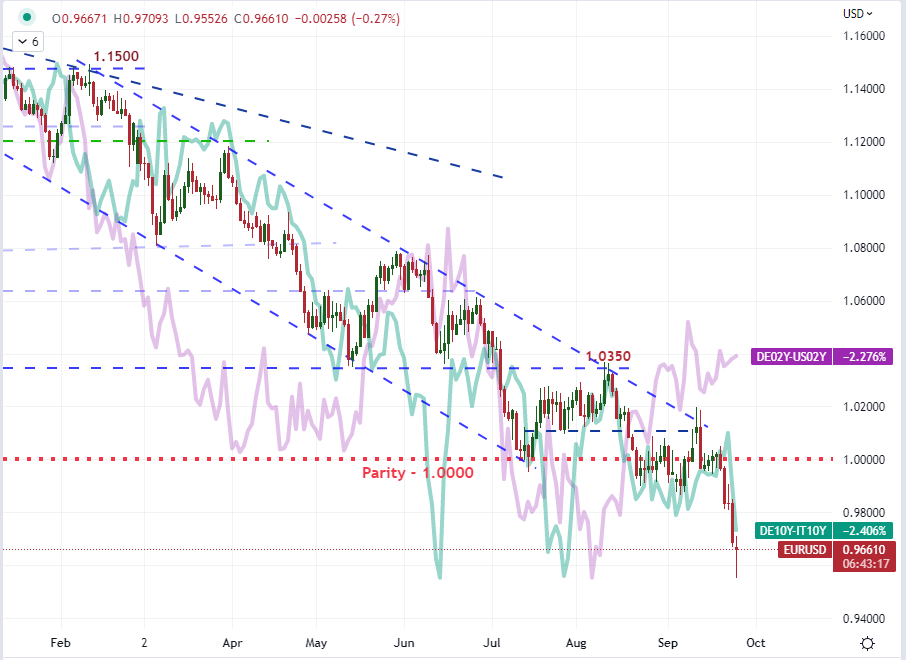
Chart Created on Tradingview Platform
Notably, the political power change didn’t square up to the OECD’s updated interim economic outlook. The ‘world’ outlook was unchanged from the June forecast at 3.0 percent while Italy’s 2022 projection actually rose 0.9 percentage points to 3.4 percent. The big hits were registered by China (-1.2 percentage points to 3.2 percent), the United States (-1.0 percentage point to 1.5 percent) and Germany (-0.7 percentage points to 1.2 percent). The forecast for 2023 was fairly universal in its significant downgrade. What is the probability that the world is facing a recession with this kind of course? A ‘soft landing’ looks increasingly like fanciful thinking.
Table of OECD’s Interim Economic Outlook Update
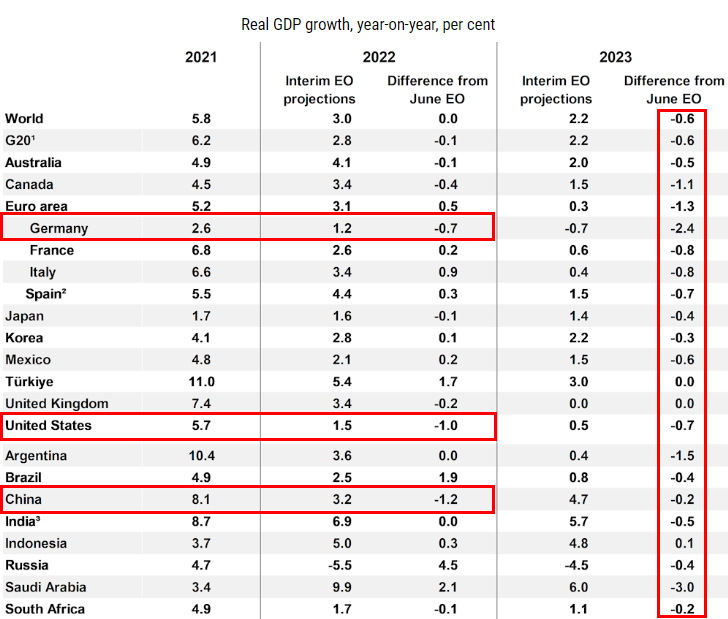
Table from OECD’s Interim Economic Outlook Update for September 2022
For fundamental weather patterns over the coming 24 hours, I’m going to be monitoring closely the intangible elements of liquidity and the general consensus of sentiment. Meanwhile, the economic docket can tap into more traditional matters. On the economic front, the Chinese industrial profits figures will hit at the heart of assessment in the world’s second largest economy while the combination of consumer confidence, home sales and durable goods orders gives a fairly broad view of the United states. Another area of critical importance is monetary policy perspective. Following some fairly overt Fed member commitment to inflation and ECB President Lagarde’s assessment that the outlook is darkening, I believe St Louis Fed President James Bullard’s views and BOE Chief Economist Pill can tap into serious underlying fundamental concerns.
Critical Macro Event Risk on Global Economic Calendar for Next Week
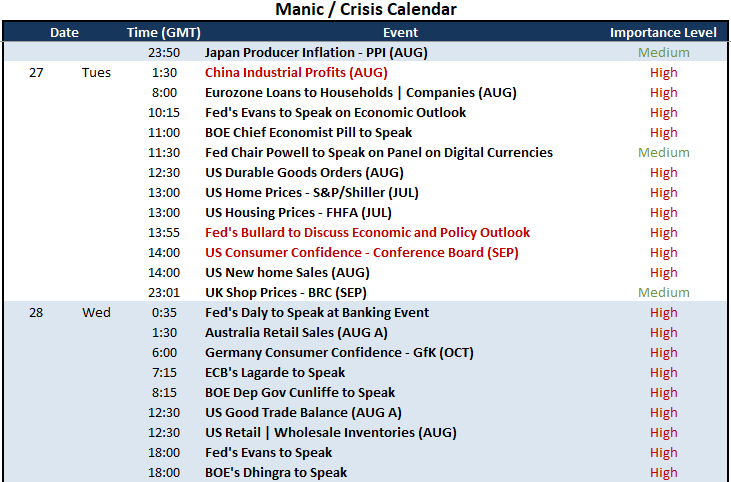
Calendar Created by John Kicklighter
Trade Smarter – Sign up for the DailyFX Newsletter
Receive timely and compelling market commentary from the DailyFX team
Subscribe to Newsletter
Be the first to comment