

FinkAvenue/iStock Editorial via Getty Images
By The Valuentum Team
The payment processing and payment solutions space is attractive. Companies operating in this industry have asset-light business models with relatively modest capital-expenditure requirements to maintain a given level of revenues, making free cash flows easier to come by. Additionally, the industry’s growth outlook is incredibly bright and supported by secular tailwinds as the world continues to shift away from cash and towards other payment options (card, mobile apps, QR codes, online payment platforms). One of our favorite names in this space is Visa (NYSE:V). We value shares at $227 each, implying potential upside relative to where shares are currently trading at the time of this writing ($206 each). The company also offers a rock-solid dividend, with shares yielding ~0.7% at the moment.
Visa’s Key Investment Considerations
Image Source: Valuentum. The key investment considerations we look at with respect to Visa. (Image Source: Valuentum)
Visa is the largest retail electronic payments network based on payments volume, total volume and number of transactions. The company benefits from one of the strongest competitive advantages out there – the network effect. As more consumers use credit/debit cards, more merchants accept them, thereby creating a virtuous cycle.
Visa is not a bank and does not issue credit cards. Visa takes on no credit risk–unlike American Express (AXP) and Discover Financial (DFS)–yet it is an integral part of the growing cashless society. Sales are primarily generated from payments volume on Visa-branded cards.
Visa acquired Visa Europe through a transaction valued at $23+ billion back in June 2016 which unified the brand globally. Visa was compelled to drop its potential acquisition of Plaid due to antitrust concerns, though we still view the company’s growth outlook quite favorably as international travel activities are steadily resuming.
Visa is well-positioned to capitalize on the ongoing shift towards a cashless society. Surging e-commerce demand represents a major growth opportunity for Visa. Please note our valuation model assumes Visa significantly grows its revenues over the coming fiscal years, aided by secular growth tailwinds.
Visa is a stellar company with a rock-solid cash flow profile, ample liquidity on hand, impressive operating margins, promising growth outlook and numerous competitive advantages. This company is one of the best operators in one of the strongest industries.
Latest Quarterly Assessment of Visa
On April 26, Visa reported second-quarter earnings for fiscal 2022 (period ended March 31, 2022) that beat both consensus top- and bottom-line estimates. Visa is benefiting from the resumption of travel activities worldwide as cross-border payment volumes were up 38% year-over-year (and up 47% excluding intra-European transactions) last quarter on a constant currency basis.
Visa contended with sizable foreign currency headwinds last fiscal quarter, though robust demand for Visa’s offerings enabled the firm to adeptly navigate those hurdles. The company’s total processed transactions increased 19% year-over-year and its payment volumes grew 17% in the first quarter on a constant currency basis, which helped drive its GAAP revenues higher by 25% year-over-year. Growth in Visa’s nominal payments volume (up 14% year-over-year) and total cross-border volumes (up 31% year-over-year) were moderately lower than its constant currency growth rates last fiscal quarter.
As an aside, Visa suspended its operations in Russia in March 2022 in the wake of the Russian invasion of Ukraine. Visa was still able to put up solid performance in the fiscal second quarter and its promising longer term growth runway remains intact. However, this decision will create near term headwinds for its financial performance.
Last fiscal quarter, Visa’s card-not-present transactions, which is effectively a benchmark for its performance in the realm of online shopping, held up quite well in the US and overseas. We appreciate Visa’s strong performance on multiple fronts within the payment processing and payment solutions arena.
Visa’s GAAP diluted EPS rose 23% and its non-GAAP adjusted EPS rose by 30% year-over-year last fiscal quarter as the firm benefited from a combination of revenue growth and improving economies of scale. Its GAAP earnings performance was held back by a decrease in its non-operating ‘investment income and other’ line-item and a higher corporate income tax provision. We appreciate that Visa’s business is in the rebound.
The company generated $7.3 billion in free cash flow during the first half of fiscal 2022 while spending $1.6 billion covering its total dividend obligations and an additional $7.1 billion buying back its Class A common stock. Visa’s cash flow profile is phenomenal.
At the end of March 2022, Visa had a net debt position of $5.2 billion (inclusive of short-term debt, current investment securities, and noncurrent investment securities). Please note that the lion’s share of its investment securities portfolio is made up of US Treasury holdings. Visa had $15.8 billion in cash-like assets on the books at the end of March 2022, providing it with ample liquidity, and we view its net debt load as manageable.
During Visa’s fiscal second quarter earnings call, management offered up guidance for the firm’s fiscal third quarter and fiscal 2022 performance. For the current fiscal quarter, Visa is guiding for revenue growth in “the upper end of the mid-teens range in constant dollars” terms as the uplift from recovering global travel activities along with recent acquisitions (such as its deals for Tink and Currencycloud) support its outlook.
As it concerns Visa’s outlook for fiscal 2022, here is what management had to say during the company’s latest earnings call:
Moving now to our outlook for the rest of fiscal 2022. Just as 2021 was a year of 2 distinct halves, due to the recovery, 2022 will be a year of 2 halves due to Russia. The suspension of our business in Russia will reduce second half revenues by about 4%. Russia will also negatively impact the payments volume and cross-border volume index to 2019, each by 4 points. The impact on process transactions index to 2019 will be under 1 point since we did not process domestic transactions in Russia. Ex-Russia and Ukraine, our domestic volume growth has stayed robust and stable for the past 4 quarters relative to 2019.
Our outlook for the second half assumes that these trends are sustained. While there are uncertainties created by high inflation, supply chain disruptions, rising interest rates and the invasion of Ukraine, there is no evident impact on our global payments volumes. E-commerce spend, both domestic and cross-border has remained strong and stable relative to 2019 at well above the pre-COVID trend line, even as pandemic effects fade, and we are assuming this will continue.
In line with payments volumes, we expect processed transactions growth relative to 2019 to remain strong and stable with the variability largely driven by the extent to which small ticket card-present everyday spend comes back. It is important to note that year-over-year growth rates will moderate as we lap the strong second half recovery in fiscal year ’21.
Ex Russia and Ukraine we’re assuming no spillover effects on other corridors in our cross-border business. Given where we ended the second quarter, we now expect cross-border travel ex intra-Europe to fully recover to 2019 levels by the end of our fiscal year despite the loss of Russian business. Including intra-Europe, that would put cross-border travel above 2019 levels.” — Vasant Prabhu, Vice Chairman and CFO of Visa
As noted earlier, our fair value estimate for Visa stands at $257 per share, comfortably above where shares of V are trading at as of this writing. Additionally, shares of Visa yield ~0.7% as of this writing, and Visa offers investors incremental dividend growth upside alongside its powerful capital appreciation upside. In moderation, we view Visa’s share repurchases quite favorably given its strong free cash flow generating abilities and manageable net debt load.
Visa’s Economic Profit Analysis
The best measure of a company’s ability to create value for shareholders is expressed by comparing its return on invested capital with its weighted average cost of capital. The gap or difference between ROIC and WACC is called the firm’s economic profit spread. Visa’s 3-year historical return on invested capital (without goodwill) is 53.9%, which is above the estimate of its cost of capital of 8.9%.
As such, we assign Visa a ValueCreation rating of EXCELLENT. In the image below, we show the probable path of ROIC in the years ahead based on the estimated volatility of key drivers behind the measure. The solid grey line reflects the most likely outcome, in our opinion, and represents the scenario that results in our fair value estimate. We expect Visa to remain a strong economic-profit creator in coming years.
Image Source: Valuentum. Our forecasts for Visa’s economic profit stream in coming years. (Image Source: Valuentum)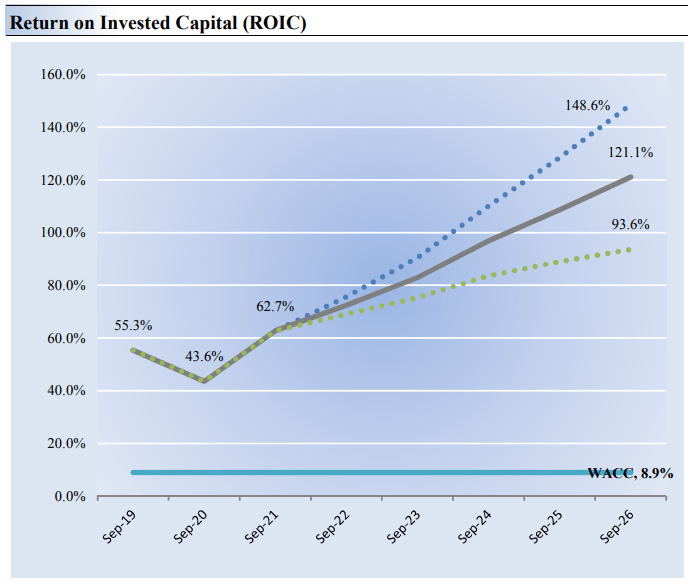
Visa’s Cash Flow Valuation Analysis
Image Source: Valuentum. Visa remains a very strong free cash flow generator. (Image Source: Valuentum)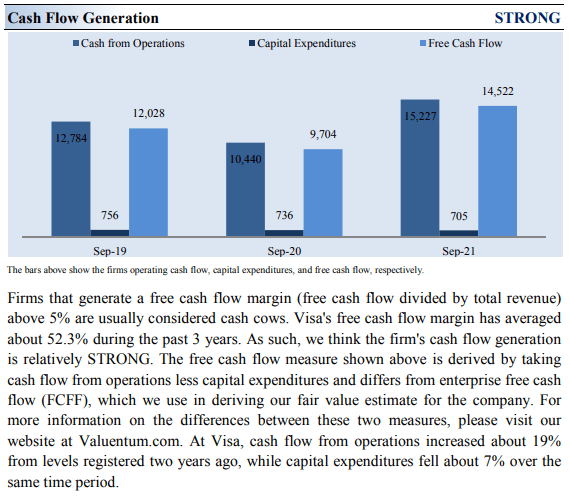
We think Visa is worth $227 per share with a fair value range of $182-$272. The margin of safety around our fair value estimate is driven by the firm’s LOW ValueRisk™ rating, which is derived from an evaluation of the historical volatility of key valuation drivers and a future assessment of them.
Our near-term operating forecasts, including revenue and earnings, do not differ much from consensus estimates or management guidance. Our model reflects a compound annual revenue growth rate of 13% during the next five years, a pace that is higher than the firm’s 3-year historical compound annual growth rate of 5.4%.
Our valuation model reflects a 5-year projected average operating margin of 66.1%, which is above Visa’s trailing 3-year average. Beyond year 5, we assume free cash flow will grow at an annual rate of 5.3% for the next 15 years and 3% in perpetuity. For Visa, we use a 8.9% weighted average cost of capital to discount future free cash flows.
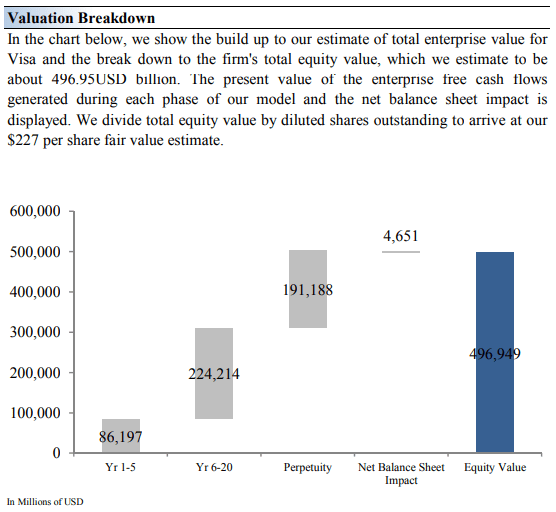
Image Source: Valuentum. The key summary valuation assumptions we use to derive our fair value estimate for Visa. (Image Source: Valuentum) Image Source: Valuentum. The duration of value composition on the basis of our discounted cash flow process for Visa. (Image Source: Valuentum)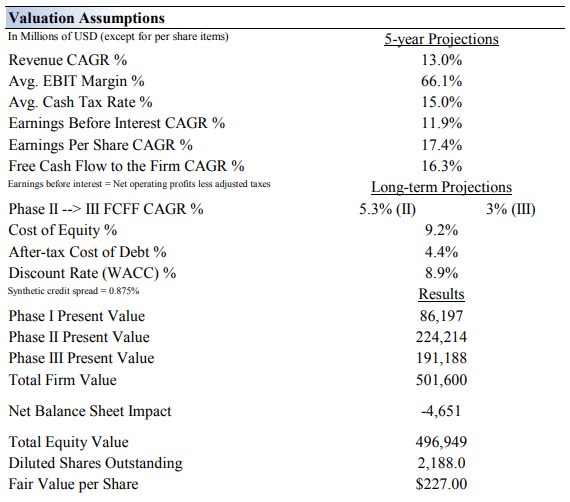
Visa’s Margin of Safety Analysis
Image Source: Valuentum. The fair value range we apply to our point fair value estimate of Visa. (Image Source: Valuentum)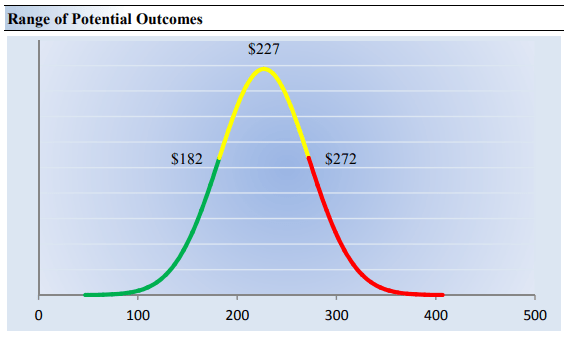
Our discounted cash flow process values each firm on the basis of the present value of all future free cash flows. Although we estimate Visa’s fair value at about $227 per share, every company has a range of probable fair values that’s created by the uncertainty of key valuation drivers (like future revenue or earnings, for example). After all, if the future were known with certainty, we wouldn’t see much volatility in the markets as stocks would trade precisely at their known fair values.
Our ValueRisk rating sets the margin of safety or the fair value range we assign to each stock. In the graph above, we show this probable range of fair values for Visa. We think the firm is attractive below $182 per share (the green line), but quite expensive above $272 per share (the red line). The prices that fall along the yellow line, which includes our fair value estimate, represent a reasonable valuation for the firm, in our opinion.
Concluding Thoughts
Visa’s rock-solid fundamentals provide the ultimate base for its dividend health. We think the firm’s business model is one of the best in one of the strongest industries, and its Dividend Cushion ratio is among the highest in our coverage universe at 5.2. The fact that the company does not issue credit cards like Discover or American Express keeps it from taking on credit risk that would otherwise harm its dividend potential. Visa’s per share dividend has grown significantly in recent fiscal years, and its robust free cash flow generation gives it significant capacity for years of increases moving forward. Secular growth tailwinds such as the rising e-commerce demand supports Visa’s outlook.
Image Source: Valuentum. The Dividend Cushion Cash Flow Bridge illustrates the components of the Dividend Cushion ratio and highlights in detail the many drivers behind it. Visa’s Dividend Cushion Cash Flow Bridge reveals that the sum of the company’s 5-year cumulative free cash flow generation, as measured by cash flow from operations less all capital spending, plus its net cash/debt position on the balance sheet, as of the last fiscal year, is greater than the sum of the next 5 years of expected cash dividends paid. (Image Source: Valuentum)
Based on its Dividend Cushion ratio, Visa clearly has tremendous dividend growth potential. However, management continues to choose to allocate its capital towards investments into its business and share repurchases. Management’s willingness to increase the magnitude of its payout seems to be the largest obstacle preventing dividend growth, from our point of view. Visa had a relatively modest net debt position and ample liquidity on hand at the end of fiscal 2021. M&A activity competes with Visa’s dividend program for capital, though given its stellar cash flow profile, the firm should still be able to continue pushing through meaningful payout increases going forward. With just about everything going for it, we like Visa’s prospects over the long run.
This article or report and any links within are for information purposes only and should not be considered a solicitation to buy or sell any security. Valuentum is not responsible for any errors or omissions or for results obtained from the use of this article and accepts no liability for how readers may choose to utilize the content. Assumptions, opinions, and estimates are based on our judgment as of the date of the article and are subject to change without notice.
Be the first to comment