

JasonDoiy
A more in-depth version of this report, including metric definitions and targets, was first shared with members of my Quality + Value Strategies subscription service in the Seeking Alpha Marketplace on October 13, 2022.
Visa, Inc. (NYSE:V) is a poster child for Peter Lynch’s “buy what you know” mantra. Consumer or merchant Visa accounts exist in most wallets and checkouts, whether on-ground or digital. The payment processor’s high-quality business model is textbook. However, is it available at a value price for new or existing shareholders in this endemic bear market?
In this initial primary ticker research report, I put Visa and its Class A common shares through my market-beating, data-driven investment research checklist of the value proposition, shareholder yields, fundamentals, valuation, and downside risk.
The resulting investment thesis:
Visa’s high-quality business model and growth profile currently price the stock above a disciplined value investor’s preferred entry point. Nevertheless, the stock rewards long-term shareholders with market-beating capital gains and an attractive dividend yield on cost.
My current overall rating: Hold, based on a bullish view of the company and a neutral view of the stock.
Unless noted, all data presented is sourced from Seeking Alpha Premium as of the market close on October 21, 2022; and intended for illustration only.
Dynamic Business Model or Highway Robbery?
V (Class A shares) is a dividend-paying large-cap stock in the information technology sector’s data processing and outsourced services industry.
Visa Inc. operates as a payments technology company worldwide and facilitates digital payments among consumers, merchants, financial institutions, businesses, strategic partners, and government entities. Visa was founded in 1958 and is headquartered in San Francisco, California, USA.
My value proposition elevator pitch for Visa:
Household name in payment processing has half its revenues dropping to the bottom line. Now that’s a dynamic business model if not legal highway robbery.
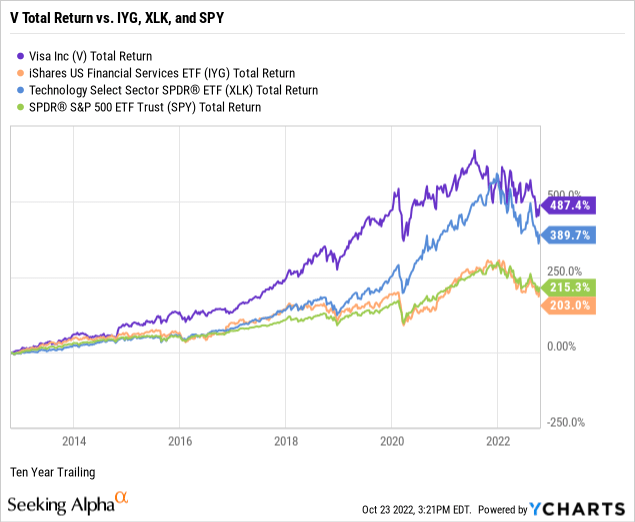
The chart below illustrates the stock’s performance against the iShares U.S. Financial Services ETF (NYSE:IYG), the Technology Select Sector SPDR Fund ETF (NYSE:XLK), and the SPDR S&P 500 ETF Trust (NYSE:SPY) over the past ten years.
Ultimately, I aim to beat the benchmark indices over time when investing in individual common stocks. For example, V has outperformed the total returns of its industry, sector, and market, reflecting its positioning as a core portfolio holding.
My value proposition rating for Visa: Bullish.
Yields Underperforming the 10-Year Treasury
As part of my due diligence, I average the total shareholder yields on earnings, free cash flow, and dividends to measure how a targeted stock compares to the prevailing yield on the 10-Year Treasury benchmark note. In other words, what is the equity bond rate of the common shares?
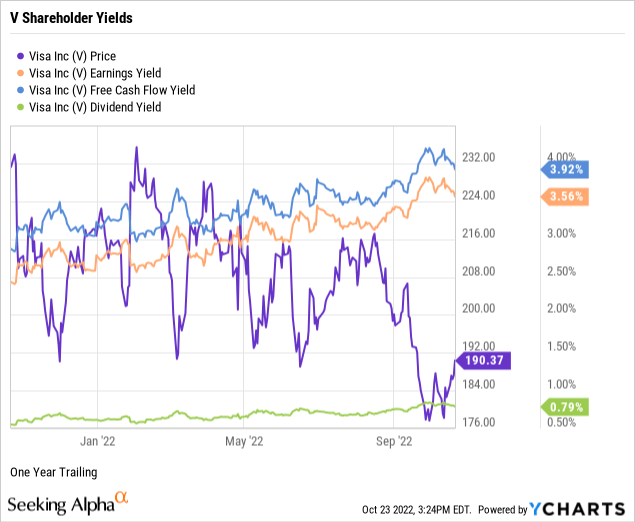
V was trading at an earnings yield of 3.56% and a free cash flow yield of 3.92%, as demonstrated in the below chart.
Visa offers a modest forward dividend yield of 0.79%. However, its conservative 20.83% payout ratio indicates a safe, well-covered dividend with plenty of room for annual raises.
I prefer high dividend yields only when calculated on a cost basis. Notably, V was yielding 4.60% on an annual payout of $1.50 and split- and dividend-adjusted 10-year cost basis of $32.63 per share, or 381 basis points above the forward yield.
Next, I take the average of the three shareholder yields to measure how the stock compares to the prevailing yield of 4.22% on the 10-Year Treasury benchmark note. For example, the average shareholder yield for V was 2.76% or 4.03% if using a ten-year cost basis.
Conventional market wisdom holds equities as riskier than U.S. bonds. Thus, securities such as V, which reward shareholders with yields at or below the government benchmark, argue for owning the bond instead of the stock.
Remember that earnings and free cash flow yields are inverse valuation multiples, suggesting that V trades at a premium. I’ll further explore valuation later in this report.
My shareholder yields rating for V: Neutral.
Exceptional Performance in Golden Gate City
Now, I will explore the fundamentals of Visa, uncovering the performance strength of the company’s senior management.
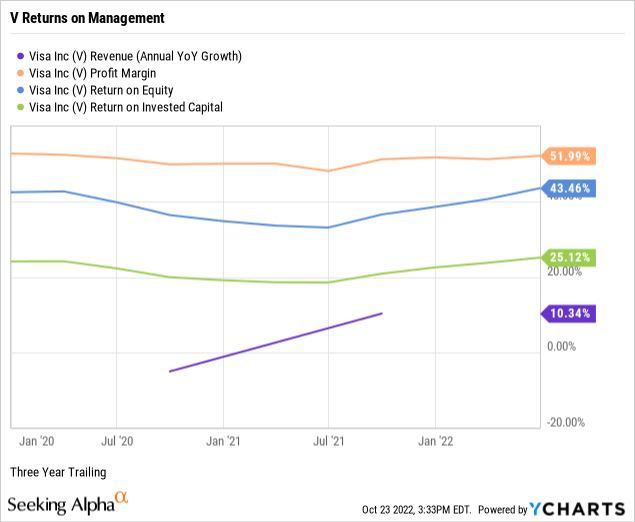
Per the below chart, Visa had three-year annualized revenue growth of 10.34%, exceeding the 6.23% median growth for the information technology sector.
Visa had a trailing three-year double-digit pre-tax net profit margin of an astounding 51.99%, far outperforming the sector’s modest median net margin of 3.87%.
Visa was producing a trailing three-year return on equity or ROE at a resounding 43.46% against a median ROE of just 6.51% for the sector.
Notably, Visa is amidst a $12 billion share buyback program with no expiration date. Nonetheless, is the board buying their shares at a premium?
At 25.12%, Visa six-packs the sector’s median return on invested capital or ROIC of 3.80%, indicating that its senior executives are competent capital allocators.
ROIC needs to exceed the weighted average cost of capital or WACC by a comfortable margin, confirming management’s ability to outperform its capital costs. For example, Visa’s ROIC comfortably exceeds its trailing WACC of 9.49%, an otherwise high capital cost basis. (Source: GuruFocus).
The double-digit revenue growth, super net profit margin, and outstanding returns on equity and capital indicate exceptional management performance in The Golden Gate City.
My fundamentals rating for Visa: Bullish.
An Overpriced Fintech Juggernaut
I have built and maintained a market-beating family portfolio of the common shares of enduring enterprises since 2009, relying on just four valuation multiples to estimate the intrinsic value of a targeted quality company’s stock price.
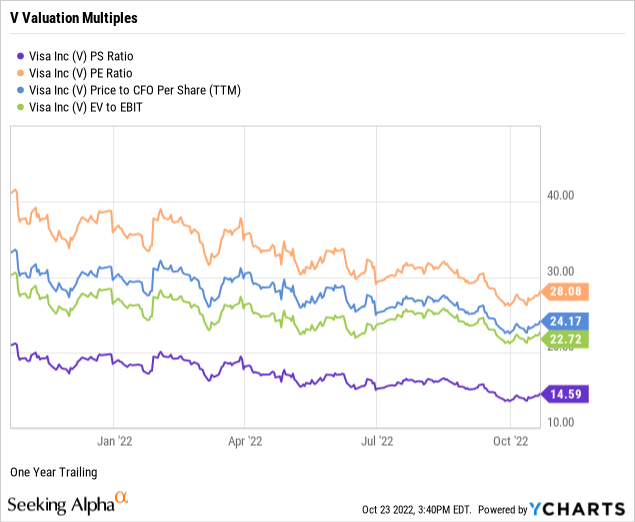
V was trading at a price-to-sales ratio or P/S of 14.59 times, significantly higher than 2.48 times for the information technology sector and 2.15 times for the S&P 500. (Source of S&P 500 P/S: Charles Schwab & Co.) Thus, the weighted industry plus market sentiment suggests a premium-priced stock relative to Visa’s topline.
V had a price-to-earnings multiple or P/E of 28.08 times against a sector median P/E of 20.32, indicating investor sentiment overvalues the stock price relative to earnings per share. Further, V was trading at a premium multiple to the S&P 500’s overall P/E of 18.27. (Source of S&P 500 P/E: Barron’s).
At 24.17 times, V’s price-to-operating cash flow multiple was trading at a premium to the sector’s median of 18.65, indicating that the market prices the stock above fair value relative to current cash flows.
Against the broader sector median of 17.31, V was trading at 22.72 times enterprise value to operating earnings or EV/EBIT, signaling the stock was overbought or undersold by the market.
Weighting my preferred valuation multiples suggests the market assigns a hefty premium to Visa’s stock price relative to sales, earnings, cash flow, and enterprise value. Therefore, based on the fundamentals and valuation metrics uncovered in this report, risks and potential catalysts notwithstanding, I would call V an overpriced stock of a legacy A-rated fintech juggernaut.
My valuation rating for V: Bearish.
Liquidity and Moat Drive Below Average Risk
When assessing the downside risks of a company and its common shares, I focus on five metrics that, in my experience as an individual investor and market observer, often predict the potential risk/reward of the investment. Hence, I assign a downside risk-weighted rating of above average, average, below average, or low, biased toward below average and low risk profiles.
Alpha-rich investors target companies with clear competitive advantages from their products or services. An investor or analyst can streamline the value proposition of an enterprise with an economic moat assignment of wide, narrow, or none. Morningstar assigns V a wide moat rating.
Long-term debt coverage demonstrates balance sheet liquidity or a company’s capacity to pay down debt in a crisis. Notably, as reported on its June 2022 quarterly financial statements, at 1.41 times, Visa’s long-term debt coverage could pay off 100% of its longer-term debt obligations in a crisis using its liquid assets, such as cash and equivalents, short-term investments, and accounts receivables.
In a further test of its paydown capacity, Visa’s long-term debt to equity was a manageable 57.90%.
Visa’s short-term debt coverage or current ratio was 1.43 times. Thus, its balance sheet provides significant liquid assets to pay down 100% of its current liabilities, including accounts payable, accrued expenses, short-term borrowings, and income taxes.
As a long-term investor, I use a five-year beta trend line, and V’s 60-month trailing beta was 0.92. At 1.01, its shorter-term 24-month beta was about equal. With price volatility trading around the S&P 500 standard of 1.00, V presents as a market-average core portfolio holding.
The short interest percentage of the float for V was a mainly bear paws-off of 2.73%. So perhaps the near-sighted traders view the stock as a wide-moat fintech staple with a loyal and sustainable customer, merchant, and investor base. However, there may be some skepticism about Visa’s growth prospects in a recession.
Visa is a fundamentally superior company with a consumer/merchant market-dominating value proposition and an attractive risk profile against a broader bear market.
My downside risk rating for Visa: Below Average.
Visa Catalysts and Final Thoughts
Catalysts confirming or contradicting my overall hold investment thesis on Visa, Inc.’s Class A common shares include, but are not limited to:
- Confirmations: Visa’s leading market share creates more opportunities for loss than gain. The oligopolistic nature of the industry makes Visa and its competitors targets for regulators, potentially resulting in hefty fines. Governments could shut Visa out of some emerging-market opportunities. Continued high inflation and economic recession could slow growth and profitability.
- Contradictions: Visa has a commanding market share in a scalable industry, allowing improvement of its already impressive margins. There are still plenty of opportunities for growth in electronic payments, which have surpassed cash payments globally. Although still elevated to the sector and the broader market, current valuation multiples are at five-year lows. Visa is a market leader providing enormous financial strength and profitability.
(Additional source of catalysts: Morningstar.)
Visa’s high-quality business model and growth profile currently price the stock above a disciplined value investor’s preferred entry point. The household name in payment processing has half its revenues dropping to the bottom line, a dynamic business model if not legal highway robbery. Visa’s value proposition is highly sustainable, fundamentals are solid, and downside risks are below average. However, shareholder yields underperform the 10-Year Treasury.
Nevertheless, the stock rewards long-term shareholders with market-beating capital gains and an attractive dividend yield on a cost basis.
Be the first to comment