

syahrir maulana
(This article was co-produced with Hoya Capital Real Estate)
Introduction
There are over 140 ETFs with $350b in AUM that focus on the Small-Cap space in the US, Globally, or just overseas. Since I covered other parts of the Small-Cap Value market, I chose here to review two US-only Small-Cap Value ETFs that use very similar S&P SCV indices but have produced unsimilar results. They are the:
- Vanguard S&P Small-Cap 600 Value ETF (NYSEARCA:VIOV)
- Invesco S&P SmallCap 600 Pure Value ETF (NYSEARCA:RZV)
In short, the index used by RZV is a subset of the stocks in the index used by VIOV. So far, the broader index has better results so between these two SCV ETFs, I would own the Vanguard S&P Small-Cap 600 Value ETF, though I mention a potential 3rd choice at the end of this article.
Vanguard S&P Small-Cap 600 Value ETF review
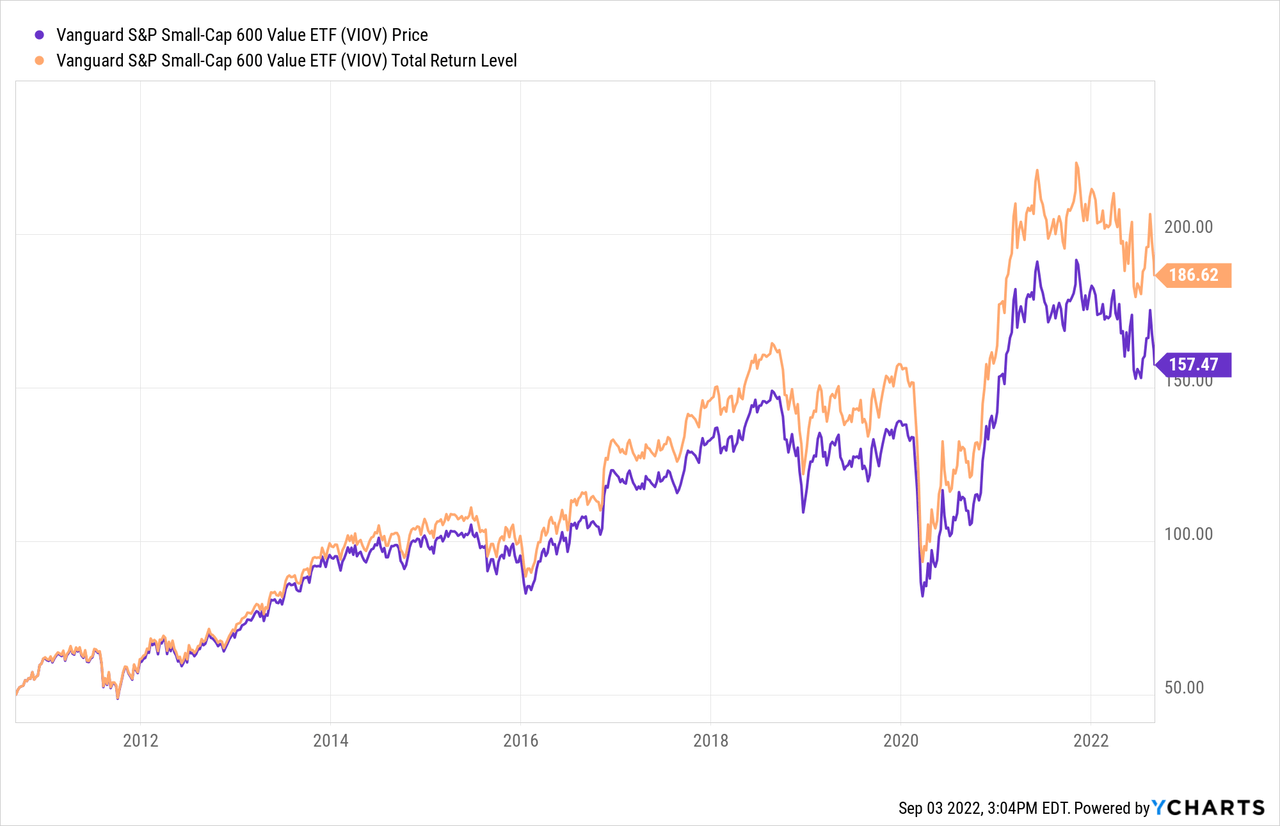
Seeking Alpha describes this ETF as:
The Vanguard S&P Small-Cap 600 Value ETF invests in value stocks of small-cap companies. It seeks to track the performance of the S&P SmallCap 600 Value Index, which includes value companies, as determined by the index sponsor. VIOV started in 2010.
Source: seekingalpha.com VIOV
VIOV has $1.3b in AUM and incurs 15bps in fees. The present TTM yield is 1.8%.
Index review
With both ETFs using SCV indices from the same provider, reviewing how they differ is critical. S&P describes the S&P SmallCap 600 Value Index as:
We measure value stocks using three factors: the ratios of book value, earnings, and sales to price. S&P Style Indices divide the complete market capitalization of each parent index into growth and value indices. Constituents are drawn from the S&P SmallCap 600®.
Source: spglobal.com SPSV index
They provide this basic data:
spglobal.com SPSV index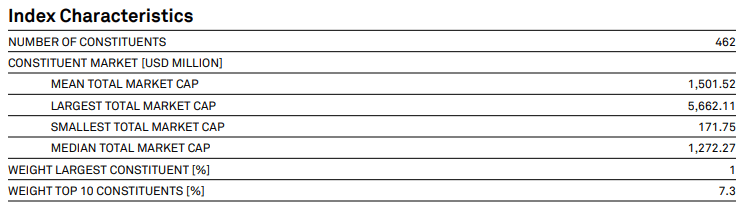
As detailed below, the apparent difference between the two indices is how S&P evaluates stocks. Any stock can be rated as having Growth and/or Value attributes. As long as there are Value attributes, this index can include it. That difference is shown in the number of stocks held out of the 600 Small-Cap stocks: 462 here; only 168 in the “pure” index.
VIOV holdings review
advisors.vanguard.com; compiled by Author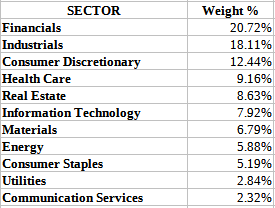
The top three sectors dominate the allocation, accounting for 51% of the portfolio. Not surprising, few Utilities or Communication Services stocks are small enough to qualify. Using holdings data, I was able to get Industry-level allocations too.
advisors.vanguard.com; compiled by Author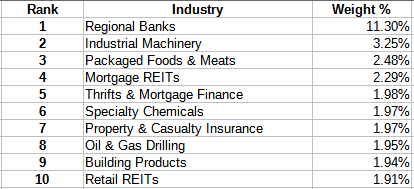
Regional Banks account for half the Financials sector allocation; Industrials is much more diversified. Vanguard listed over 110 Industry classifications.
Top holdings
advisors.vanguard.com; compiled by Author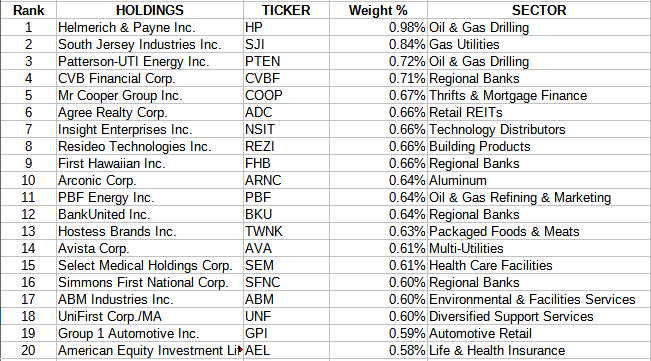
With over 450 stocks, the Top 20 are only 13.3% of the portfolio, with no holding breaking the 1% level.
VIOV distribution review
seekingalpha.com VIOV DVDs
VIOV switched from annual to quarterly payouts in 2018. Overall, the growth in payouts has been very erratic, though Seeking Alpha still rates VIOV a B+ for this factor.
seekingalpha.com VIOV scorecard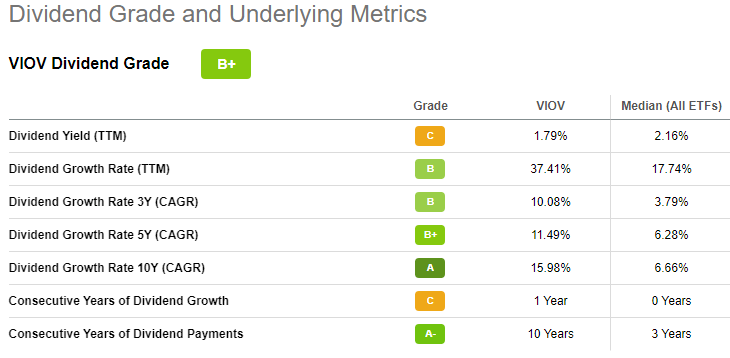
Invesco S&P SmallCap 600 Pure Value ETF review
Seeking Alpha describes this ETF as:
The Invesco S&P SmallCap 600 Pure Value ETF that invests in a subset of stocks of the main S&P 600 index, which make up the S&P SmallCap 600® Pure Value Index. RZV started in 2006.
Source: seekingalpha.com RZV
RZV has $277m in AUM and incurs 35bps in fees, putting it at a 20bps annual disadvantage to VIOV from the start. The present Forward yield is 1.3%. Neither ETF would be good for income seeking investors.
Index review
S&P describes this index as:
We measure value stocks using three factors: the ratios of book value, earnings, and sales to price. S&P Pure Value Indices include only those components of the parent index that exhibit strong value characteristics, and weights them by value score. Constituents are drawn from the S&P SmallCap 600®.
Source: spglobal.com SPSPV index
The basic data for this index is:
spglobal.com SPSPV index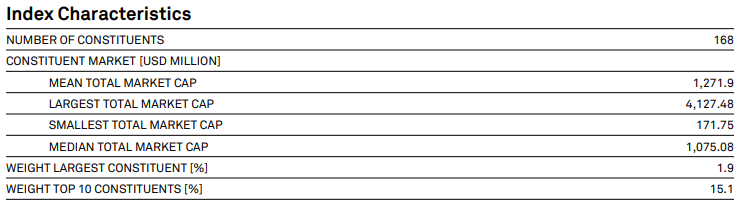
Key differences are the small weighted market-caps and number of holdings here versus the other index. Selection criteria include the following points:
- Universe: Stocks within the S&P SmallCap 600 Index with the strongest Value characteristics.
- Value factors: Using the three factors listed above, a value score is derived. The highest scores from all the parent indices are selected, subject to the next point.
- Constituent selection: Only stocks with a 100% of their market-cap in the SC600 Value index are eligible. There are stocks with both Value and Growth scores, thus in both the SCV and SCG S&P indices.
- Style Weighting: Each stock is weighted by the value score.
For more on how S&P constructs their indices, they provide a Methodology PDF.
RZV holdings review
invesco.com; compiled by Author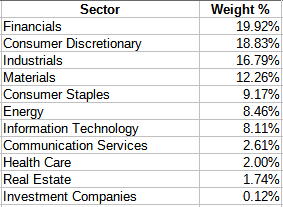
Even more than VIOV, the top three sectors hold 54% of the portfolio, with #4 adding another 12+%. I will compare these to VIOV later. Invesco doesn’t provide Industry-level data, but I found those allocations on Fidelity. These are the one with at least a 3% allocation.
Fidelity.com; compiled by Author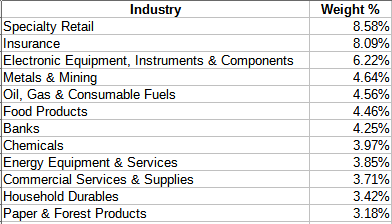
Top holdings
invesco.com; compiled by Author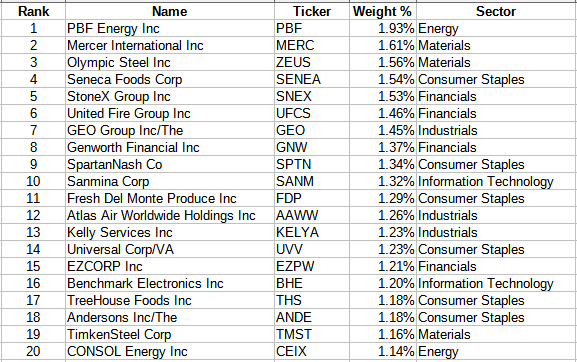
With hundreds less in positions, the Top 20 here account for 27% of the portfolio, with 23 stocks topping the 1% allocation level.
RZV distribution review
seekingalpha.com RZV DVDs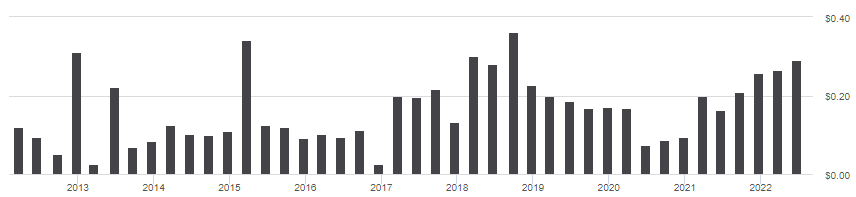
RZV shows even a more erratic payout pattern than VIOV does; not for investors seeking steady income flows. RZV scored a C+ from Seeking Alpha.
seekingalpha.com RZV scorecard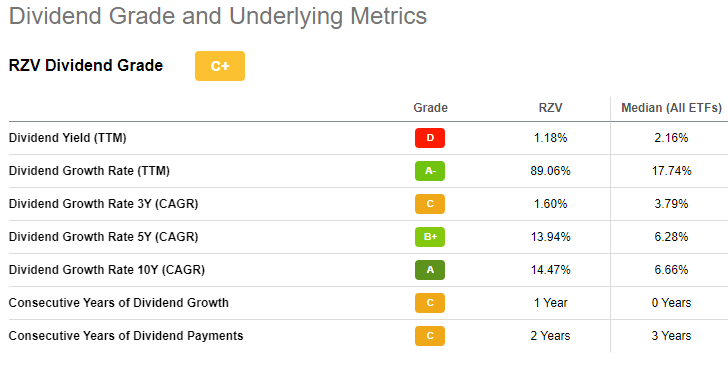
Comparing ETFs
Since index performance will drive ETF performance, over the last ten years, the SCV index has a CAGE of 11.98%, while the SCPV index is only 10.75%. Here is how the actual ETFs have performed.
PortfolioVisualizer.com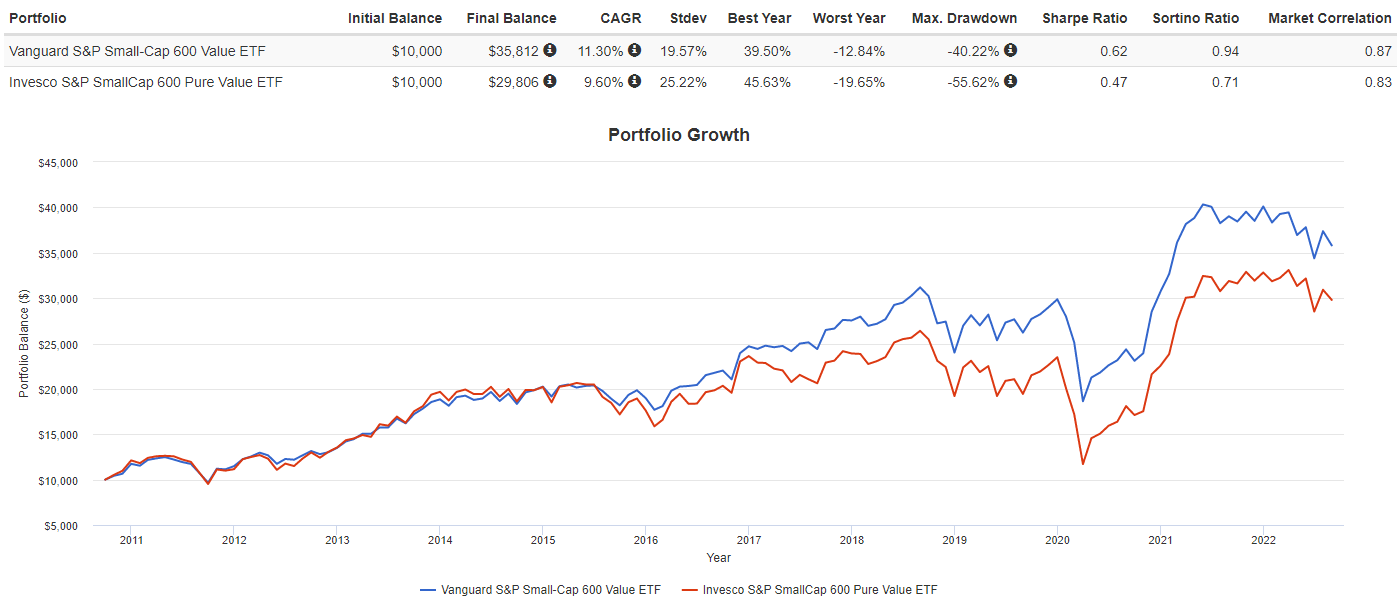
Both showed similar results until 2018. Since then, VIOV has done better. With the difference based on “pure” and “mixed” Small-Cap, I ran the following and added the Vanguard S&P Small-Cap 600 Growth ETF (VIOG).
PortfolioVisualizer.com
With RZV having no “growth” exposure, when VIOG started outperforming VIOV, it pulled it up compared to RZV. That concept holds up well looking at annual data.
PortfolioVisualizer.com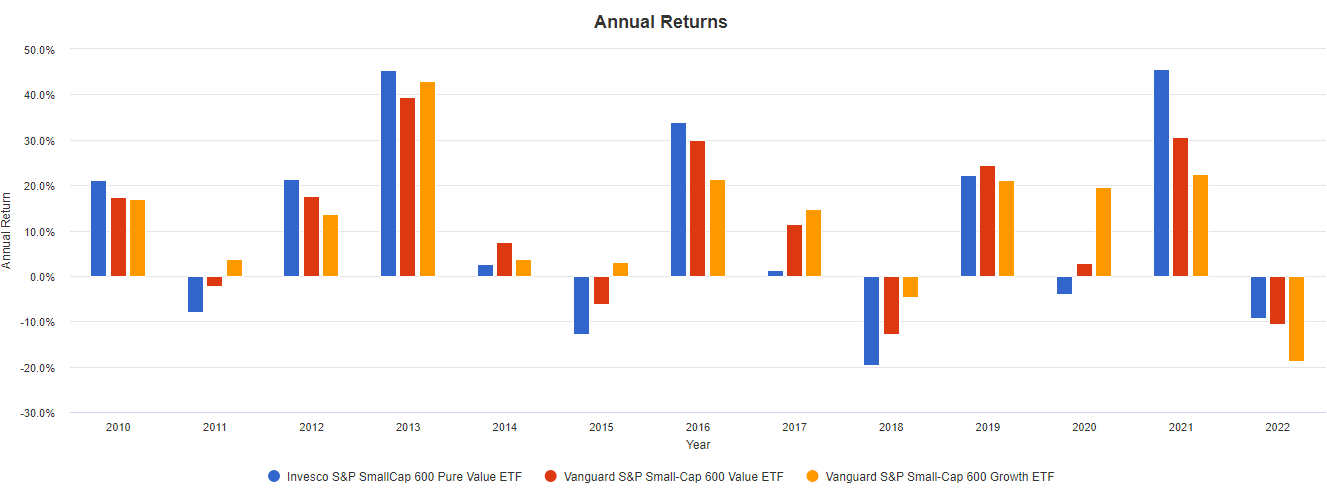
Looking at the current portfolios, shows the expected overlap in holdings but also sector weights differ between the two; which can cause performance differences.
ETFRC.com seekingalpha.com home pages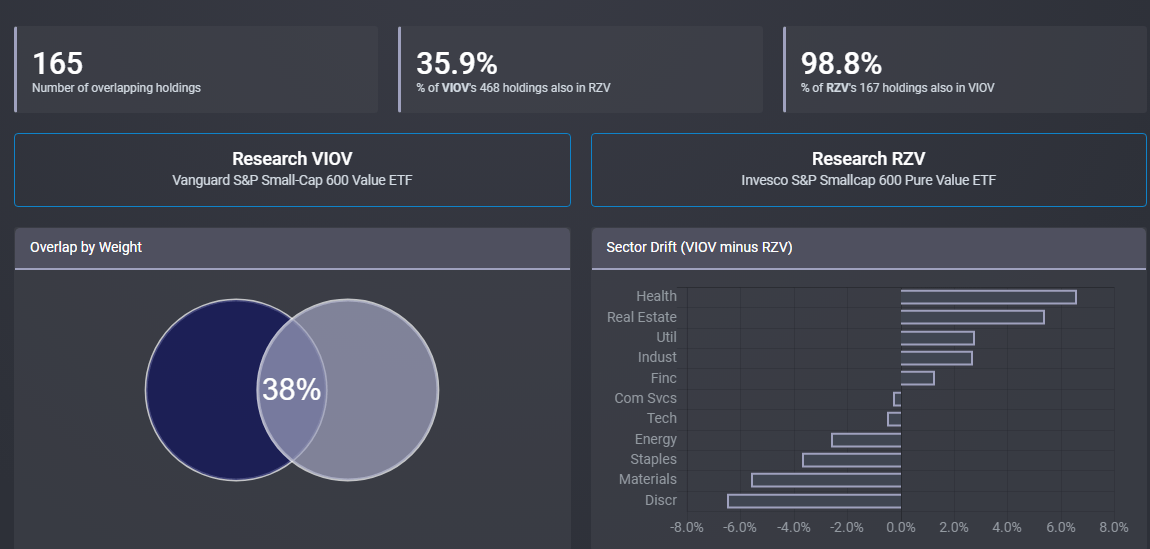
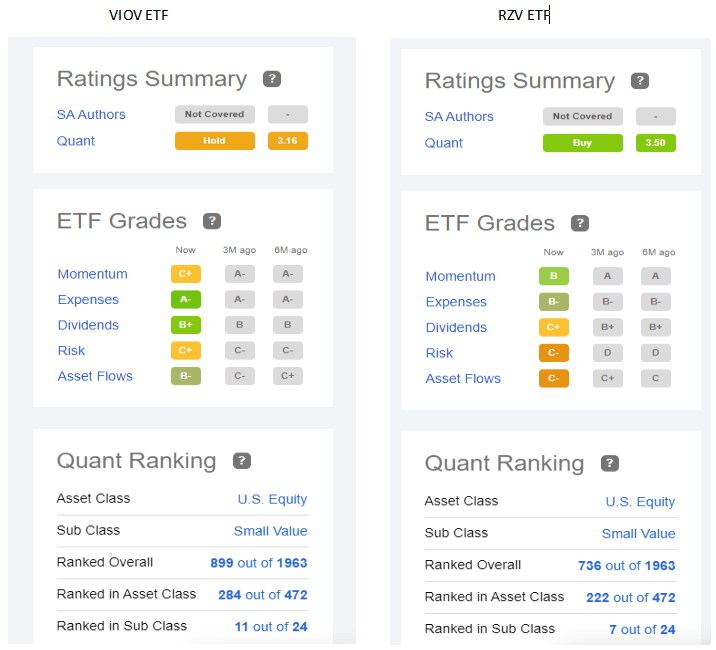
The Quant Rankings are based on the underlying rating of each stock and provides the overall rank order of the stock within the sector and overall stock universe. Currently, these rankings prefer RZV over VIOV.
Portfolio strategy
While there are duplicates (same index, different manager), there are still many strategies available to Small-Cap investors, including actively managed ETFs that have done well. Of course, there are ones that take the simple approach and cover what they define as the Small-Cap market, US or otherwise. I did not give either a Buy rating as another one I covered in the past, the Avantis U.S. Small Cap Value Fund (AVUV) has shown better results but it is just reaching its 3rd anniversary: Avantis U.S. Small Cap Value Fund Provides Non-Indexed Exposure To This Market Segment.
PortfolioVisualizer.com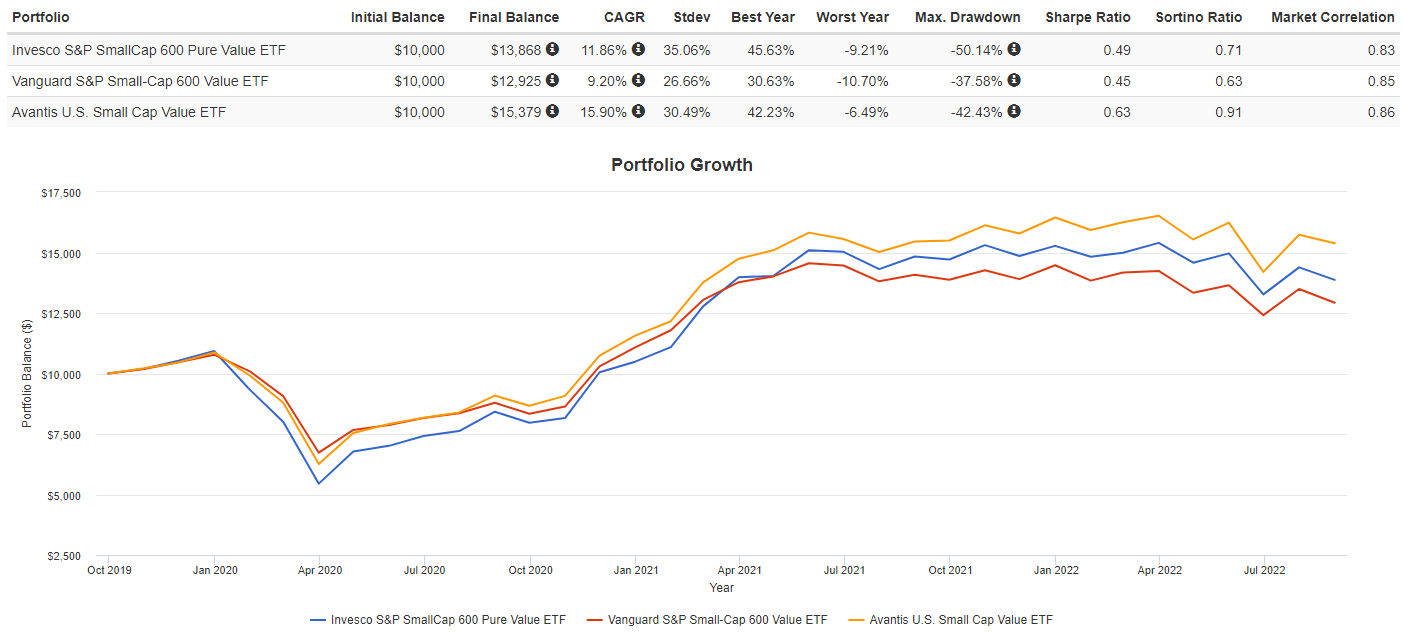
Final thoughts
Institutional investors having an outsized influence over markets, as they own over 75% of the market value, do Small-Cap stocks stand a chance, in the long run, when competing for investor dollars? With many institutions over $1t in AUM, owning shares in <$10b stocks won’t affect performance much and become difficult to buy/sell in large quantities. This might explain why SCV stocks have gone from the best performing market-cap segment since 1972 to last in the past decade.
One of my fellow Hoya Capital Income Builder contributors published the following article as I submitted this one to Seeking Alpha. If my above contention is correct and SC not the best choice going forward, it is the perfect article: Value ETFs: A Beginner’s Guide.
Be the first to comment