

GoodLifeStudio/E+ via Getty Images
Introduction
The Estée Lauder Companies Inc. (NYSE:EL) released Q1 FY23 (July-September 2022) results on November 2. EL shares initially fell by more than 10%, before recovering to close down 5.6% that day; they have since recovered, including rising 11% in two days in last week’s market rally, but the share price is still down 37% in the past year:
|
Librarian Capital’s EL Rating History vs. Share Price (Last 1 Year) 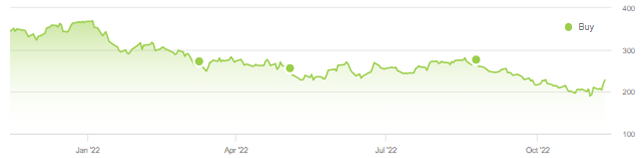 Source: Seeking Alpha (14-Nov-22). |
We initiated our Buy rating on Estée Lauder in early April 2020 (PRO subscription required). Since then EL shares have gained 38% in 2.5 years, though they have lost 16% (after dividends) since the end of 2021.
Q1 FY23 results were poor, though attributed to one-offs and not entirely unexpected. Sales fell 5% year-on-year organically, compared to a 9% growth at peers, and Adjusted EBIT fell 26%. EL’s 34% sales exposure to China (as of FY22) explained part of the underperformance, but EL sales also fell 3% organically in the Americas, supposedly due to inventory tightening at some U.S. retailers. FY23 outlook has been cut significantly, now with a flat to +2% organic sales growth and a 25-27% Adjusted EPS decline.
EL’s more premium-focused portfolio may mean a higher vulnerability to brick-and-mortar problems. There were anecdotal datapoints of good performance in areas not affected by one-off headwinds. EL is also guiding to a resumption of low-double-digit organic sales growth and high-teens Adjusted EPS growth in H1 FY23.
For now, we give management benefit of the doubt. Relative to CY21 financials, EL stock has a P/E of 29.7x. Our forecasts indicate a total return of 52% (12.5% annualized) by June 2026. Buy.
Estée Lauder Buy Case Recap
Our investment case on EL is based on the following:
- The Beauty market will continue its strong structural growth, as an aspirational category for consumers, helped by growing demand from APAC (especially China) and premiumization (especially in Skin Care).
- EL has strong global franchises built on leading brands, high-quality products, scale, innovation and marketing capabilities, and will therefore grow sales faster than the market
- Natural operational leverage on EL’s platform will enable it to grow earnings faster than sales
- EL’s focus on the Prestige segment and its higher exposure to Skin Care will also enable it to grow faster than its main rival L’Oréal, in line with its longer-term track record
Prior to COVID-19, EL targeted Net Sales growth of 6-8% and EBIT Margin expansion of approx. 50 bps annually (in constant currency), which (with an EBIT margin of around 20%) imply an annual EBIT growth of approximately 11%:
|
EL FY20-22 Outlook (Before COVID-19) 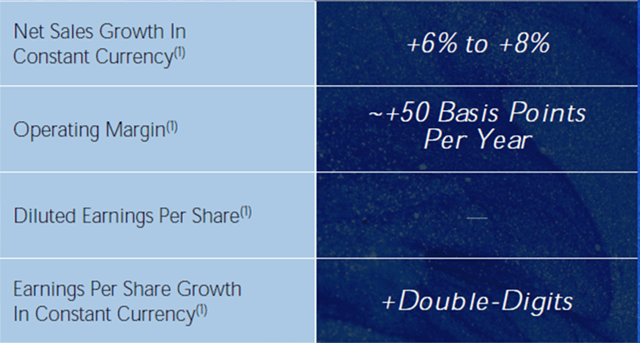 Source: EL presentation at Bernstein conference (May-19). |
EL achieved much higher growth rates than these in FY18 and FY19, growing sales by more than 10% and EBIT by high-teens each year (excluding currency); growth fell in FY20 due to COVID-21, but more than recovered in FY21:
|
EL Net Sales & EBIT Growth Y/Y (ex. FX) (FY15-22) 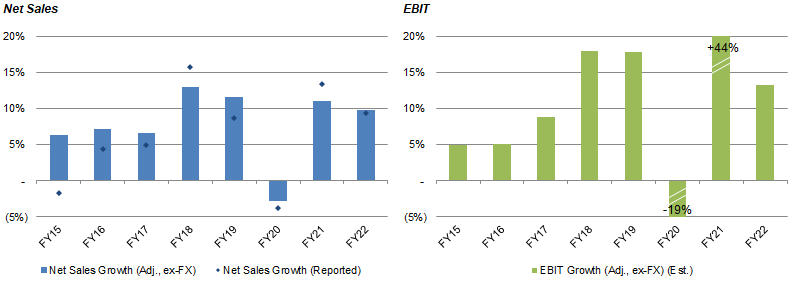 Source: EL company filings. NB. FY ends 30 Jun. |
Asia/Pacific was key behind the acceleration to double-digit growth from FY18 (excluding FY20). Asia/Pacific Travel Retail, reported as part of the EMEA region, helped accelerate EMEA ex-currency sales growth accelerate to double-digits from FY16, and Asia/Pacific ex-currency sales growth accelerated to double-digits from FY18, before both were interrupted by COVID-19. As of FY22, EL’s largest markets are China (34% of sales), the U.S. (23%) and Korea (11%).
Q1 FY23 results were poor, though attributed to one-offs and not entirely unexpected.
Estée Lauder Q1 FY23 Results Headlines
In Q1 FY23, EL Net Sales fell 5% year-on-year organically, fell 6% at constant currency and fell 10.4% in USD:
|
EL Non-GAAP P&L (Q1 FY23 vs. Prior Year) 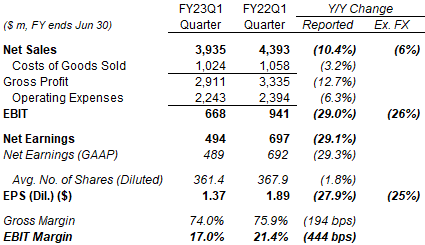 Source: EL results release (Q1 FY23). |
Gross Profit fell 12.7% in USD, with Gross Margin falling 194 bps, after “higher costs due to promotional items and inflation pressures” more than offset price increases. (EL has raised prices by 5.5% on average in July/August.)
Adjusted EBIT fell 29.0% in USD, with Adjusted EBIT margin falling 444 bps, due to negative operational leverage, as Operating Expenses fell by just 6.3%, less than the decline in Net Sales.
Adjusted EPS fell 27.9%, after Adjusted Net Earnings fell roughly in with Adjusted EBIT, mitigated by the share count having been reduced 1.8% year-on-year by share buybacks.
EL’s poor Q1 FY23 results were not entirely unexpected. Management had guided to an organic decline of 4-6% in Net Sales and an ex-currency decline of 28-34% in Adjusted EPS at FY22 results in August.
EL Sales Decline Much Worse Than Peers
EL’s sales decline was much worse than results at peers L’Oréal (OTCPK:LRLCY) and Coty (COTY), which both reported like-for-like year-on-year sales growth of 9% for the same quarter:
|
Sales Growth By Region – L’Oréal & Coty (Q3 CY22) 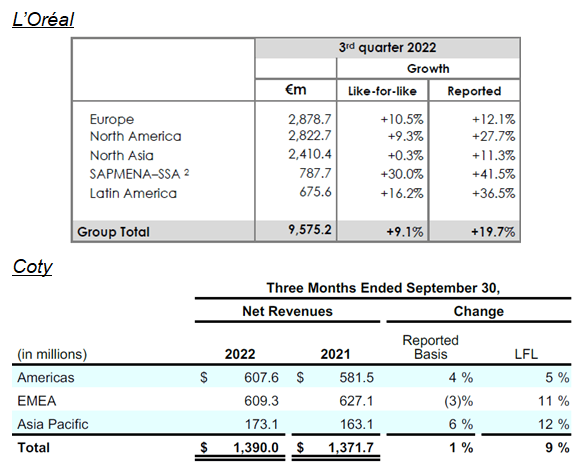 Source: Company results releases. NB. Coty figures are continuing operations only. |
EL’s uniquely large exposure to China explains part of its underperformance, given renewed COVID-19 disruption in that market. (EL generated 34% of FY22 sales in China, while L’Oréal had 20% of its 2021 sales in Chinese Yuan and Coty had just 12% of its most recent quarter’s sales in APAC.)
We review EL’s performance by region in detail.
Estée Lauder Sales Growth By Region
EL reported a year-on-year organic sales decline in every region in Q1 FY23, again worse than peers:
|
EL Net Sales by Region (Q1 FY23 vs. Prior Year) 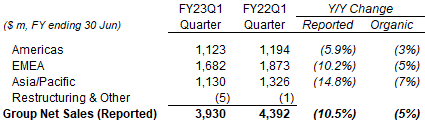 Source: EL results release (Q1 FY23). |
Declines in EMEA (which included global Travel Retail sales) and Asia/Pacific were explained by COVID-related disruption in China, while the decline in Americas was attributed to inventory tightening at U.S. retailers. There were also anecdotal datapoints showing good performance in areas not affected by one-off headwinds.
Americas sales fell 3% organically. Management attributed this to inventory tightening – in the prior-year quarter, U.S retailers stocking up ahead of potential supply chain issues was supposedly a 6 ppt benefit to Americas’ sales growth; this quarter, there was a “tightening of inventory” because “some” U.S. retailers expect slower traffic.
One problem with this explanation is that it is not supported by results at L’Oréal, which saw like-for-like sales growth of 9.3% in North America this quarter after one of 22.9% in the prior-year quarter; across 3 years, EL Americas sales have fallen by 6% organically while L’Oréal’s North America sales have grown by 36% on a like-for-like basis:
|
North America Net Sales Growth – EL vs. L’Oréal (Q3 CY20-22) 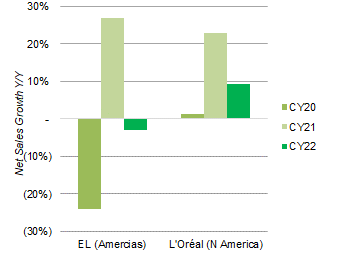 Source: Company results releases. |
More positively, EL stated that its North America retail sales (excluding inventory) grew mid-single-digits in the quarter, and that “nearly all markets” in Latin America grew double-digits (driven primarily by makeup).
EMEA sales fell 5% organically. Management attributed this “primarily” to weakness in APAC Travel Retail, as COVID restrictions in China kept most locations in Hainan closed for most of the quarter; and transactional currency impact was another negative 2 ppt. (EMEA includes all global Travel Retail sales except those at Dr. Jart+ in Korea.) Reported sales were even worse than retail sales, due to inventory, as Hainan retailers had stocked up in anticipation of a recovery.
More positively, Travel Retail sales were up triple-digits in Europe and double-digits in the Americas. EMEA brick-and-mortar sales were up double-digits, driven by post-COVID recovery (including the return of tourism) in key markets including India, the Middle East and Turkey. Sales also grew double-digits in the U.K.
Asia/Pacific sales fell 7% organically. Management attributed this to the impact of COVID restrictions on brick-and-mortar sales in Greater China and Travel Retail in Korea. EL’s domestic China sales were down low-single-digits organically (compared to down 13% in Q4 FY22).
More positively, management believes that EL’s retail sales for all Chinese consumers, including both domestic retail and Travel Retail locations, grew mid-single-digits in Q1 FY23. They believe EL online retail sales “grew nearly twice as fast as Prestige Beauty in China”, thus gaining market share. (L’Oréal also stated that the Chinese beauty market shrunk in the quarter). In Korea, excluding Dr. Jart+ with its Travel Retail business, “nearly all brands” grew double-digits; in the rest of Asia/Pacific, there was “strong” sales growth led by Thailand, Malaysia, and Japan.
FY23 Outlook Reduced Significantly
EL has reduced its FY23 outlook significantly, though it expects a recovery in H2 FY23.
FY23 Net sales are now expected to be flat to +2% organically (was 7-9% growth), or a decline of -8% to -6% as reported (was 3-5% growth); next quarter (Q2 FY23) is expected to see an organic sales decline of -11% to -9%:
|
EL FY23 Sales Outlook 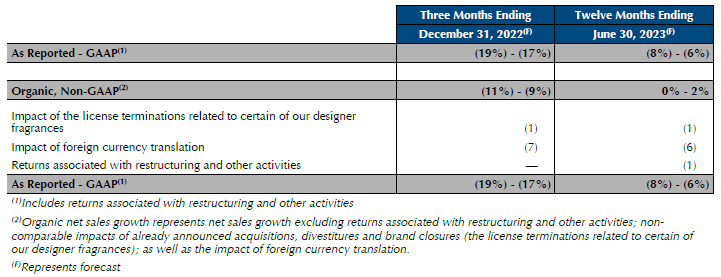 Source: EL results release (Q1 FY23). |
FY23 Adjusted EPS is now expected to decline by -21% to -17% on constant currency (was 5-7% growth), or to decline by -27% to -25% including currency (was 2-4% growth), largely due to a 50%+ decline in Q2 FY23:
|
EL FY23 EPS Outlook 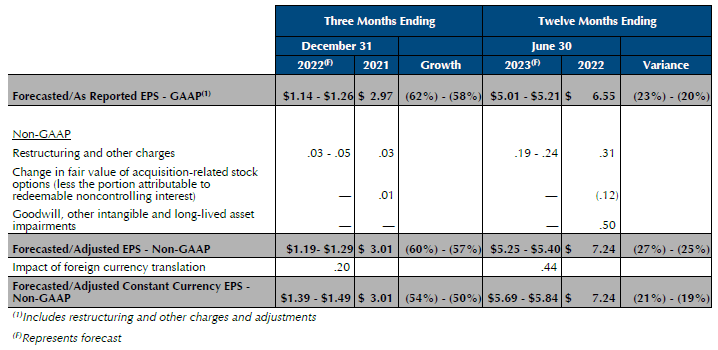 Source: EL results release (Q1 FY23). |
However, EL expects “a gradual sequential improvement to low-double digit organic sales growth and high-teens Adjusted EPS growth” in H2 FY23, based on an easing of COVID restrictions in China and an easing of inventory headwinds in the U.S. driven by continuing strong retail sales.
Giving EL Benefit of The Doubt
For the moment, we are giving EL management benefit of the doubt.
EL’s performance has been much worse than peers in recent quarters. It is possible that EL’s more premium-focused portfolio made it more vulnerable to brick-and-mortar problems. High-end skincare products do require higher-touch selling, and historically that has meant physical retail outlets staffed with trained salespeople. EL sales were much more dependent on department stores and Travel Retail in the “normal” years before COVID-19. That pattern has been playing out again. (On the other hand, digital channels like Instagram and TikTok have recently become more important.)
|
Net Sales by Channel – EL vs. L’Oréal (Pre-COVID) 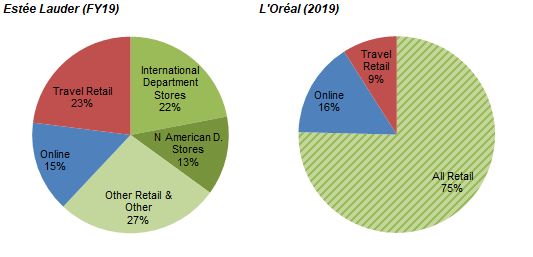 Source: Company filings. |
Some poor execution is likely to blame too, particularly in distribution in China and retailer inventory levels. However, the strength of EL’s brands, products and innovation capabilities mean the overall franchise should be resilient enough to endure periods of poor management. (Poor management may be more difficult to challenge in a family-controlled firm like EL.)
We will continue to monitor the situation closely.
Potential Tom Ford Acquisition
EL is reportedly in exclusive negotiations to acquire Tom Ford, a luxury fashion house running a sale process since earlier this year. EL is already selling a number of beauty and fragrance products under Tom Ford brands under a longstanding license agreement; acquiring Tom Ford will also take EL into the apparel part of the luxury market. The rumoured deal value is $2.8bn, which EL should be able to finance without equity. (EL has $2.44bn of Net Debt at present, about 0.6x of its FY22 EBITDA)
Is Estée Lauder Stock Overvalued?
At $220.67, relative to CY21 financials, EL stock is at a 29.7x P/E and an 2.8% Free Cash Flow (“FCF”) Yield:
|
EL Earnings, Cashflows & Valuation (FY19-22) 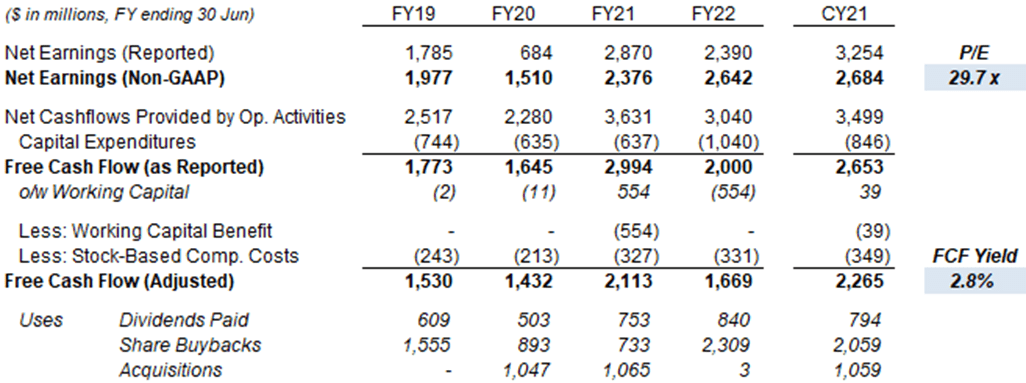 Source: EL company filings. |
FY22 Non-GAAP Net Earnings were similar to CY21’s, though FCF was much lower due to working capital increases related to efforts to manage supply chain disruptions and future growth.
New FY23 Non-GAAP EPS guidance ($5.25-5.40) implies a P/E of 41.4x at mid-point. FY23 includes two quarters of poor sales in China, the result of COVID restrictions, and we expect a quick recovery once these end.
The Dividend Yield is 1.2%, with a dividend of $0.66 per quarter ($2.64 annualized), after it was raised 10% year-on-year along with Q1 FY23 results.
Another $110m was repurchased in Q1 FY23, compared to $557m in the prior-year quarter. EL repurchased $2.3bn of its shares in FY22, equivalent to 2.9% of its current market capitalization.
Estée Lauder Stock Forecast
For our forecasts, we reduce our Net Income in FY23 again, but assume it will recover to FY22 level in FY24. We now assume the dividend will continue rising. We also reduce our exit multiple. Our key assumptions now include:
- FY23 EPS of $5.33 (was $7.47)
- FY24 Net Income of $2.642bn (was $3.192bn)
- From FY25, Net Income growth of 11.0% (unchanged)
- Share count to fall by 1.0% each year (was 0.7%)
- FY23 Dividend of $2.64 (was $2.46)
- From FY24, dividend to rise by 8% annually (was a 33% Payout Ratio)
- P/E to be at 35.0x at FY26 year-end (was 37.5x)
Our new FY26 EPS estimate is $9.29, 16% lower than before ($11.08):
|
Illustrative EL Return Forecasts 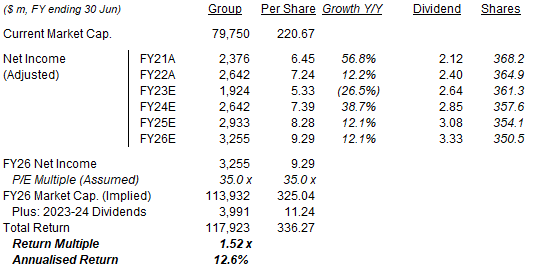 Source: Librarian Capital estimates. |
With shares at $220.67, we expect an exit price of $325 and a total return of 52% (12.5% annualized) by June 2026.
Is Estée Lauder Stock A Buy? Conclusion
We reiterate our Buy rating on Estée Lauder stock.
Be the first to comment