

PeopleImages/E+ via Getty Images
Thesis
We last wrote about the Vanguard Dividend Appreciation ETF (NYSEARCA:VIG) and Vanguard High Dividend Yield Index Fund ETF (NYSEARCA:VYM) on Feb 27, 2022. The thesis then was that it is still ok to hold both VIG and VYM because both were reasonably valued, or even a bit on the cheap side, judging from their yield spread relative to risk-free rates. Since that publication, as you can see from the following chart, indeed, both VIG and VYM share prices went up and outperformed the overall equity market.
Seeking Alpha data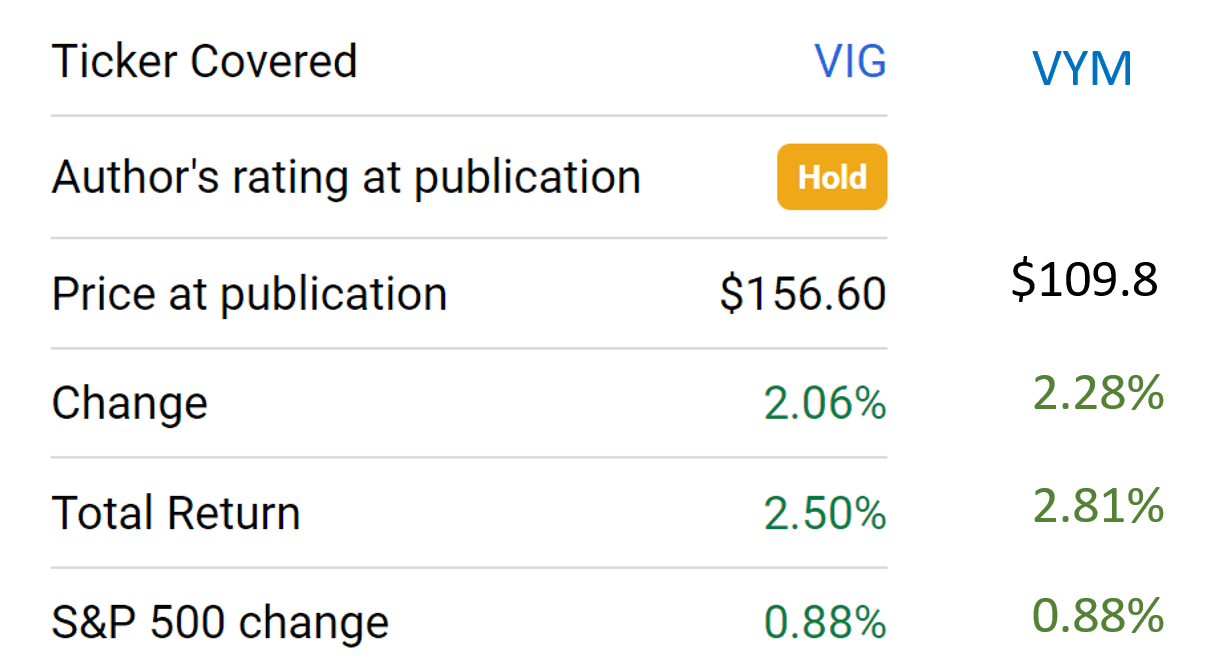
Now, we see the underlying dynamics changing rapidly with surging interest rates. And this article updates our assessment. In particular,
- We currently see the risks in VIG and VYM substantially higher than they were about two months due to the treasury rate hikes since then. Since then, the 10-year treasury rates have exceeded 2.8%, the highest level since 2018.
- And the surging Treasury rates have pushed the yield spread of both VIG and VYM to the thinnest level in a decade.
- On the other hand, we think treasury yields are close to their long-term targets already. At a very fundamental level, in the long term, treasury bond rates cannot rise above long-term inflation or GDP growth. Our government has been relying on inflation and GDP expansion to inflate away and outgrow its debt obligations for decades in the past. And it will (it will have to) continue doing so.
- As such, we recommend investors hedge their positions and begin to consider treasury bonds.
VIG and VYM: Key differences and highlights
Both funds are popular funds among dividend investors, and we assume they need little introduction. Here, we just highlight a few things for investors who are not familiar with them yet to facilitate a more in-depth discussion later.
- As the name suggests, VIG focuses more on the growth potential of dividends, and hence can be viewed as a growth-oriented fund. And VYM focuses more on the current dividend yield level, and hence can be viewed as a value-oriented fund. The valuation comparison shown in the chart below better elucidates such differences: VIG is valued at about 21.8x PE and is on par with the overall market while VYM is valued at only about 15.4x and is at a substantial discount from the overall market.
- Both VIG holds all US stocks and no foreign stocks, therefore the dividend is subject to a lower tax bracket than normal income for most investors. Also, note the 0.06% low cost – it is a major draw for many investors like ourselves who favor Vanguard products. Although VYM is more tax-efficient with its lower turnover rates, VIG has a much higher turnover rate of more than 25% while VYM’s turnover rates are only around 7%. Something to consider if you hold them in non-tax sheltered accounts.
Vanguard fund description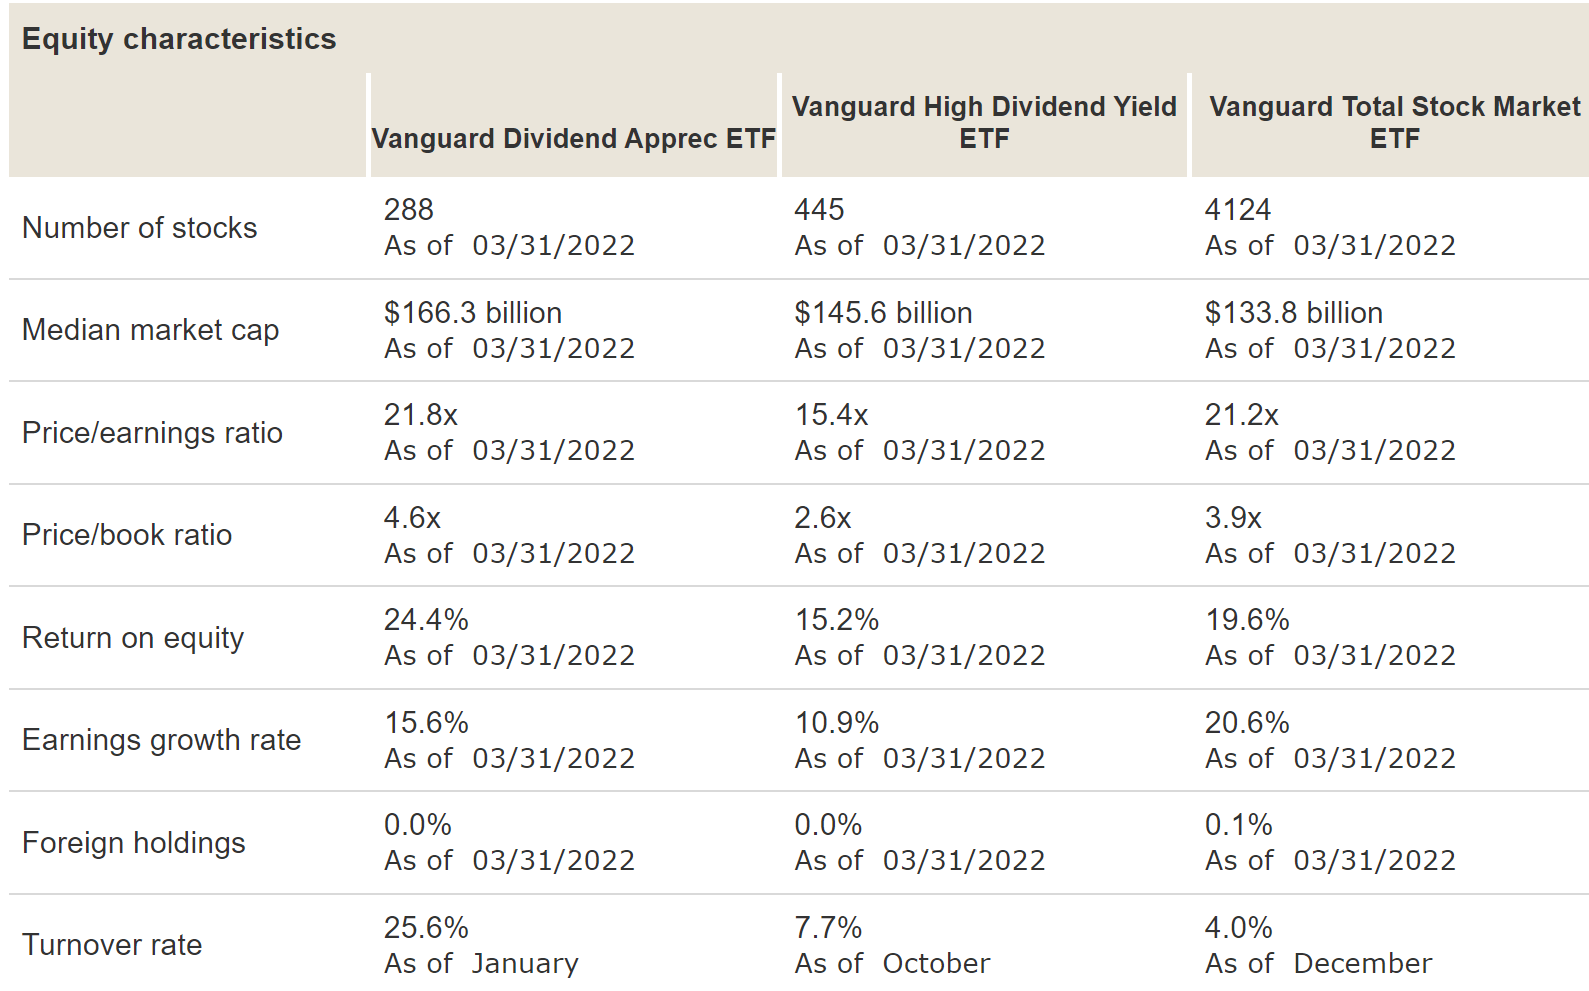
- Both funds have delivered excellent growth at reduced risk. As seen from the next chart, over the long term, both tracked the total return of the overall market represented by the S&P 500 but with significantly lower risks in terms of the standard deviation, worst year performance, maximum drawdown, et al. Although the value fund started to diverge since 2019. But I expected such divergence to be only temporary.
- Such long-term performance really displays the charm of dividend growth investing, and that is why I like dividend growth stocks and have been practicing this fundamental approach for many years. The consistent growth of dividends is a very reliable indicator of the moat, quality, corporate culture, and staying power of an excellent business.
www.portfoliovisualizer.com
VIG and VYM – Specific holdings
In terms of specific holdings, both funds are indexed by market capitalization. And as a result, both are top-heavy. The top 10 holdings are listed below, and they represent ~29% of the total net asset for VIG (almost a third) and about 22% for VYM (about a quarter).
Although, we won’t suggest investors worry too much about such top-heavy indexing for several reasons. Both our own accounts and the accounts we help to manage repeatedly show that sticking to fewer but well-understood holdings actually lowers risks. And as you can see, both VIG and VYM hold stable and well-established businesses as exemplified you can see from their top 10 holdings.
Although note that with its focus on dividend and growth, VIG’s holdings tend to include more tech-oriented stocks such as Microsoft (MSFT) and Visa (V).
ETF.com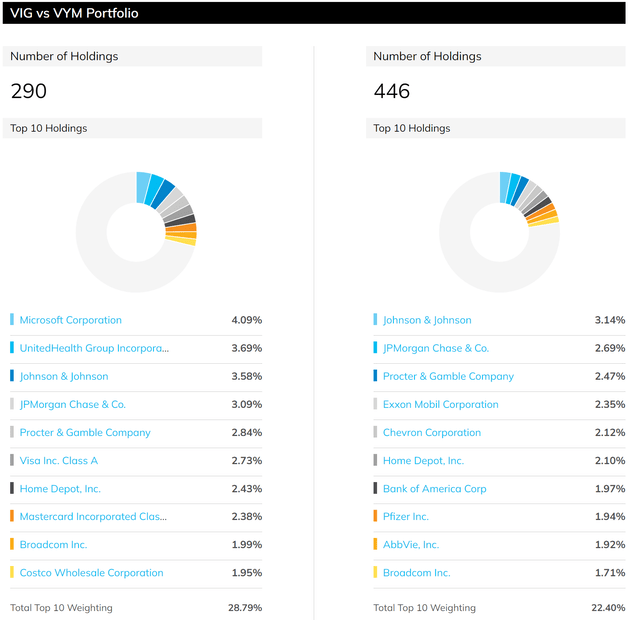
VIG and VYM – Valuation pressured by treasury rates
For bond-like equities funds such as VIG and VYM, an effective way to evaluate their valuation with interest rates adjusted is to calculate the yield spread. Details of the calculation and application of the yield spread have been provided in our earlier article. The yield spread is an indicator we first check before we make investment decisions. We’ve fortunately had very good success with this indicator because of:
- Its simplicity – it only relies on the most simple and reliable data points (treasury rates and dividends). In investing, we always prefer a simpler method that relies on fewer and unambiguous data points rather than a more complicated method that depends on more ambiguous data points.
- Its timeless intuition – no matter how times change, the risk-free rate serves as the gravity on all asset valuations and consequently, the spread always provides a measurement of the risk premium investors are paying relative to risk-free rates. A large spread provides a higher margin of safety and vice versa.
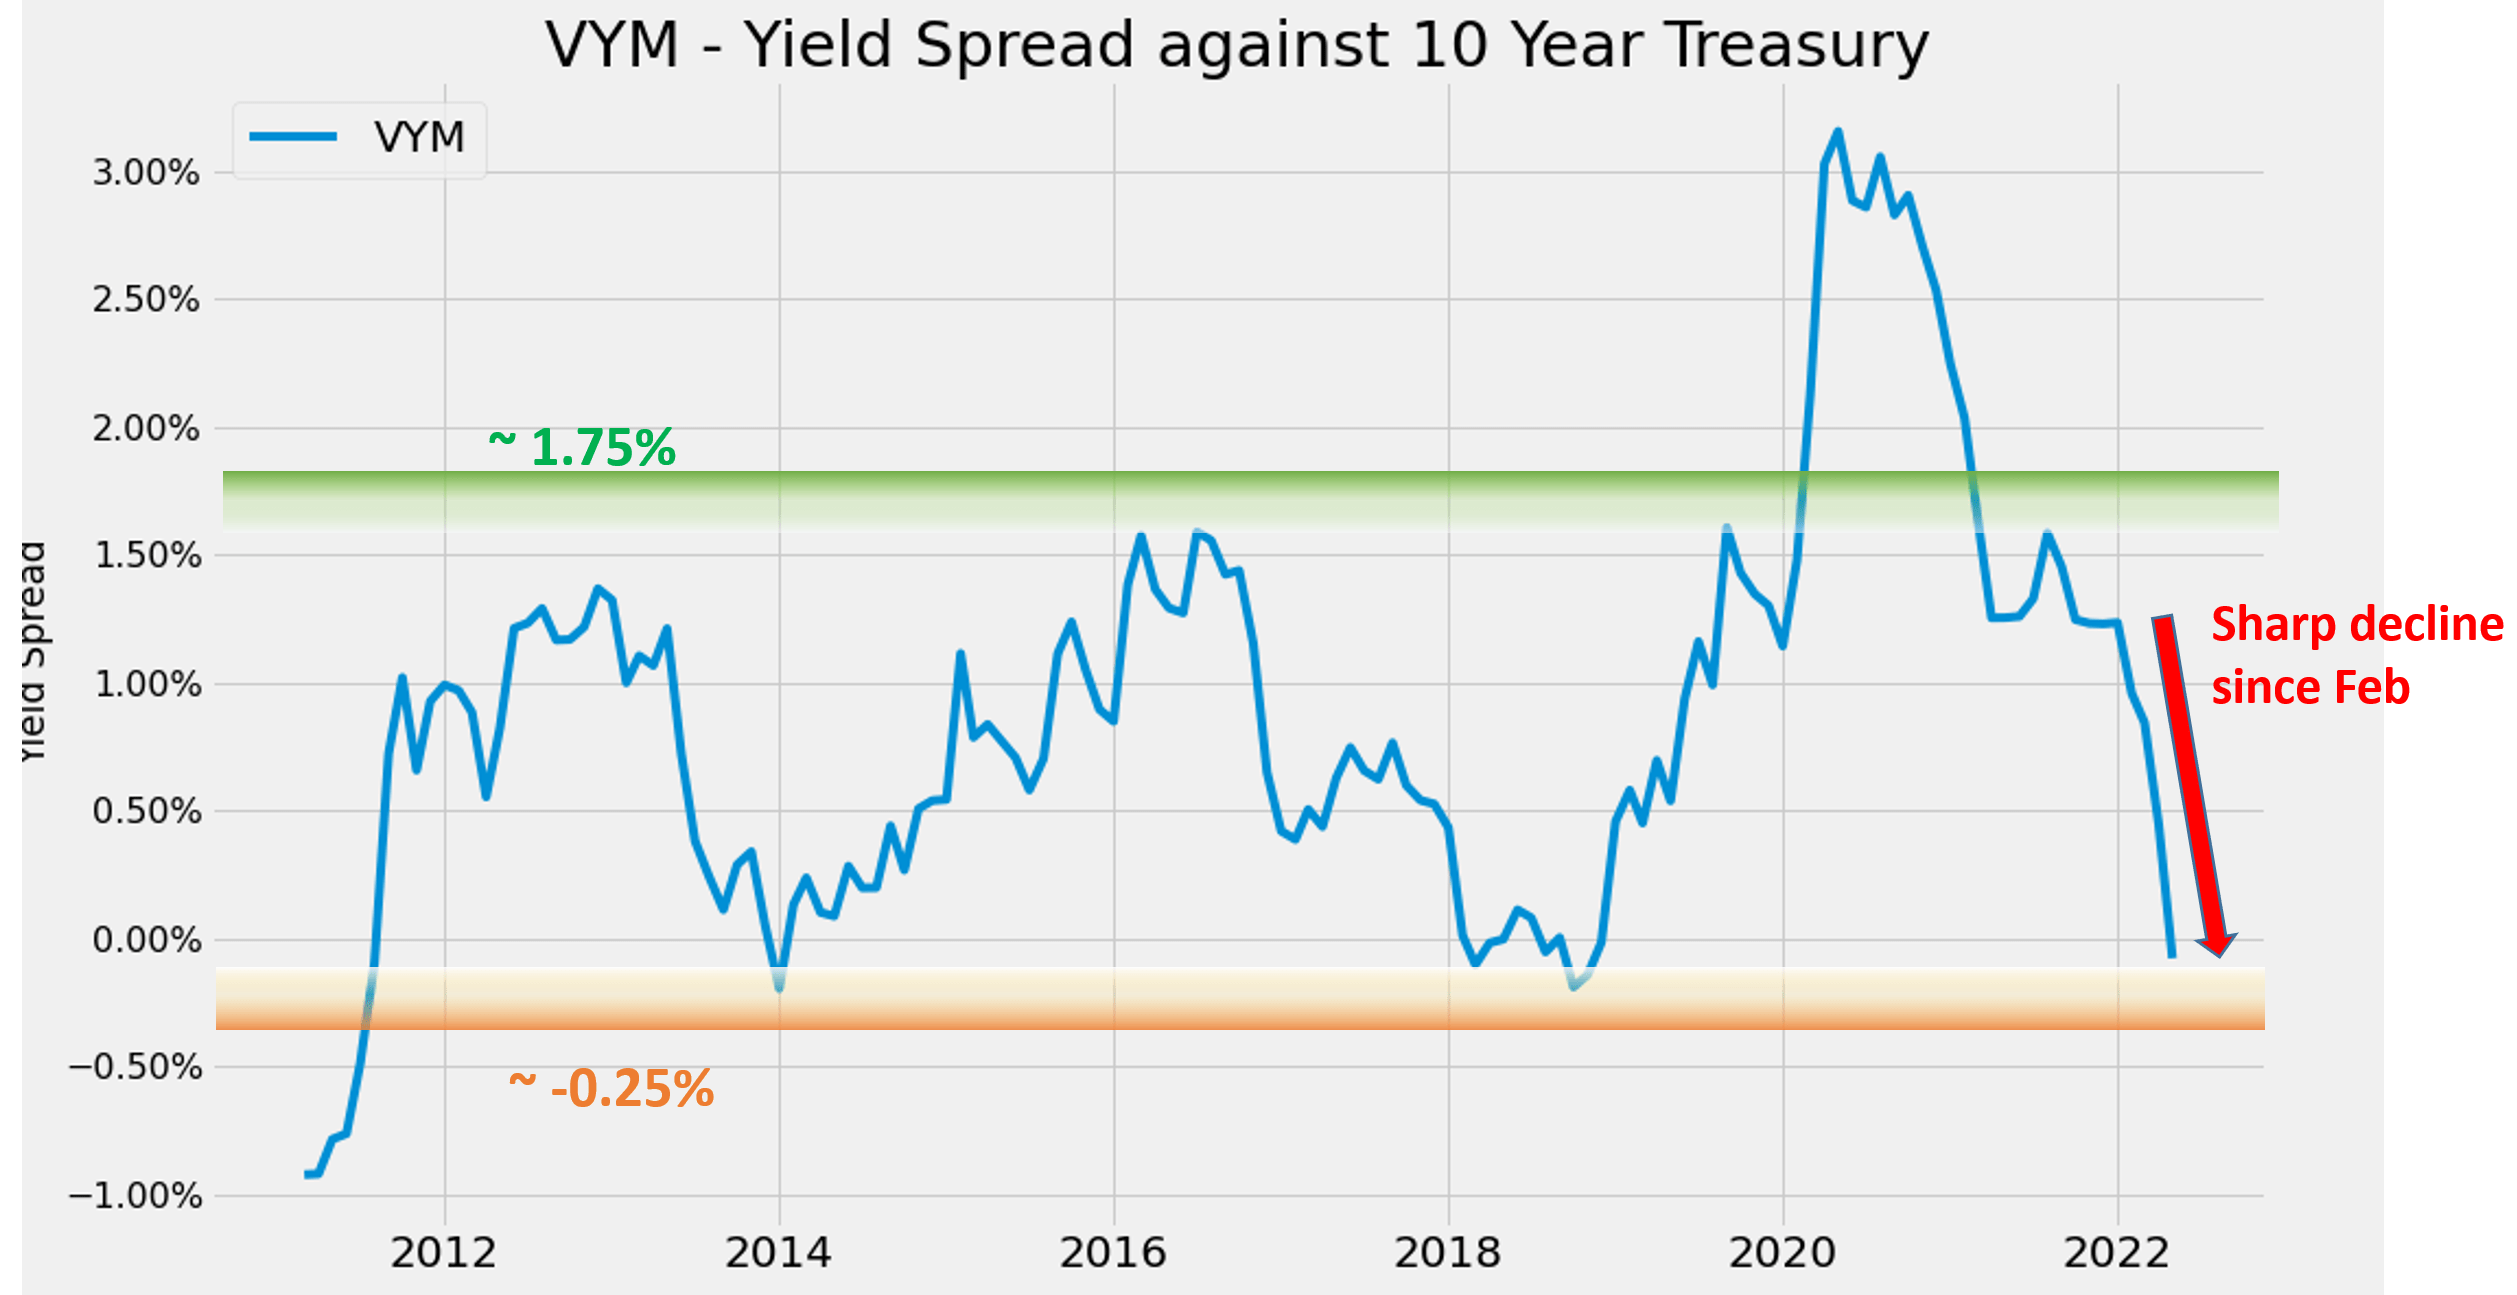
The following two charts show the yield spread between VIG and VYM against the 10-year treasury. The yield spread is defined as the TTM dividend yield of VIG minus the 10-year Treasury bond rate. As can be seen in the charts, the spread is bounded and tractable. For VIG, the spread has been in the range between about -1.25% and 0.75% the majority of the time. Suggesting that when the spread is near or above 0.75%, VIG is significantly undervalued relative to a 10-year treasury bond (i.e., I would sell a treasury bond and buy VIG). In another word, sellers of VIG are willing to sell it (essentially an equity bond) to me at a yield 0.75% above the risk-free yield. So it is a good bargain for me.
As you can see, the yield spread has sharply narrowed since our last writing due to the surging 10-year treasury rates. The yield spread has dropped to about -1% now, near the thinnest level in a decade. The picture for VYM is very similar. As of our last writing in Feb, the yield spread was close to or even above the historical mean. However, at this point, the yield spread has dropped to the thinnest level in a decade too.
To us, such a thin yield spread signals that the fundamental dynamics between the equity market and the bond market have changed already. And it is time for equity investors to consider hedging their positions and include (or increase) treasury bonds in their portfolio.
Author based on Seeking Alpha data Author based on Seeking Alpha data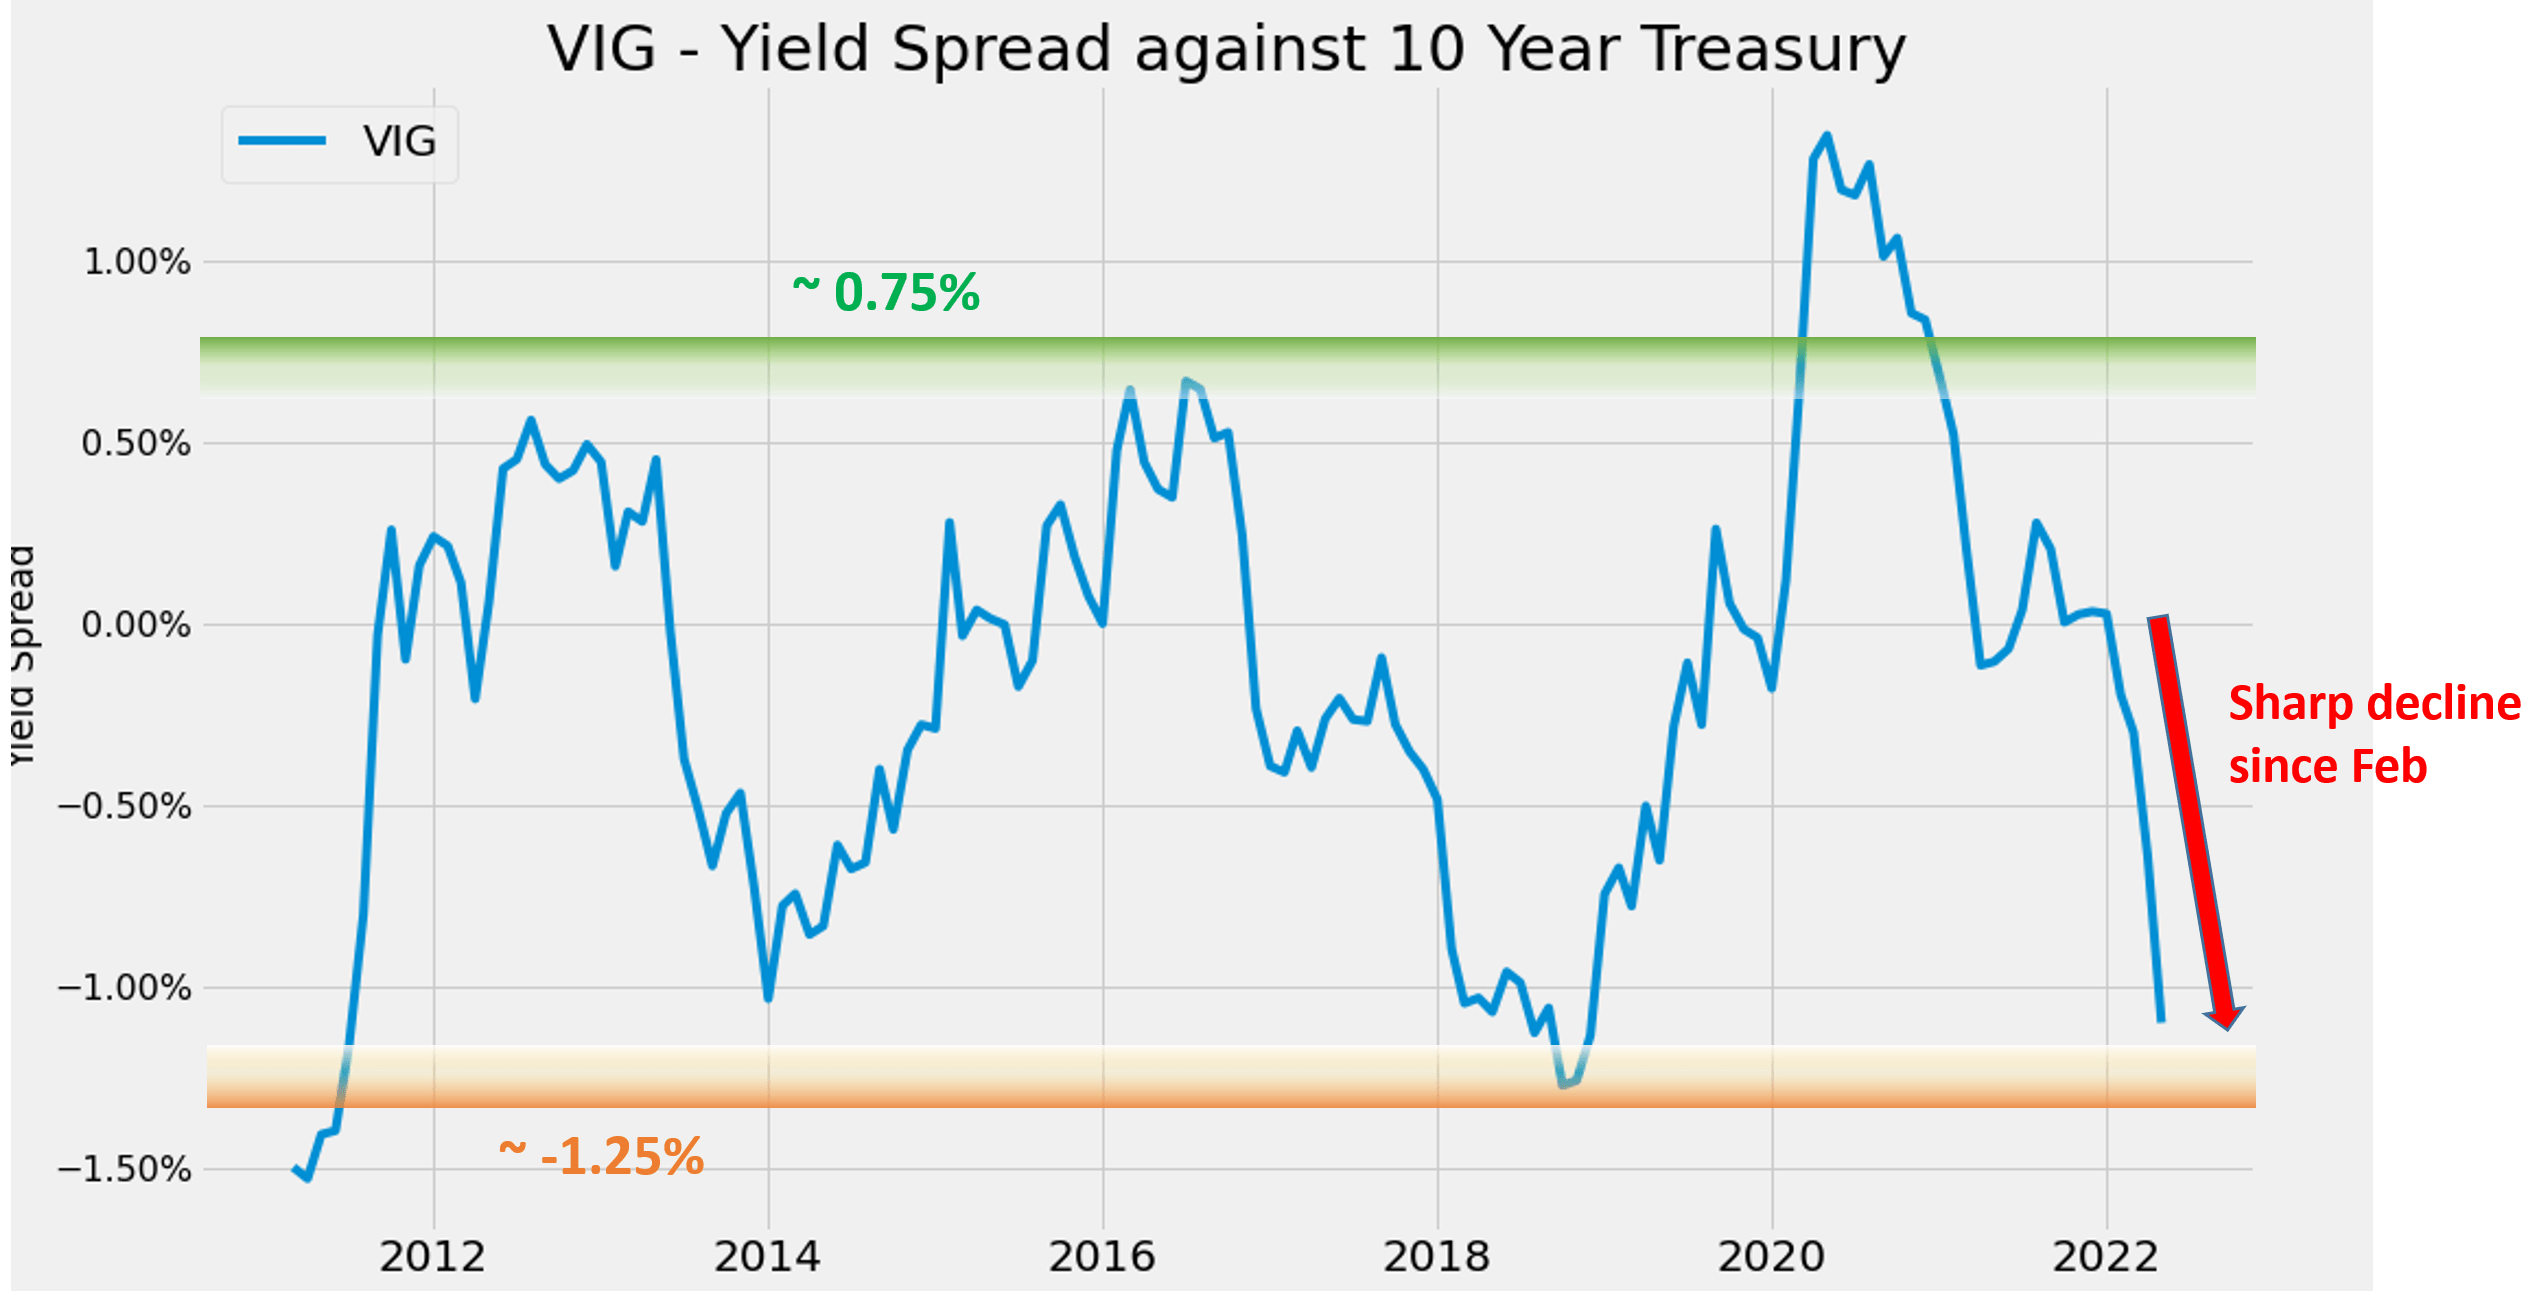
VIG and VYM: Relative valuation against each other
Finally, you might be wondering about their relative valuation and wondering if one is cheaper than the other in relative terms. The answer is that they are fairly valued against each other by the historical standard as shown in the chart below. The following chart shows the valuation gap between VYM and VIG using their yield spread relative to each other.
As can be seen, the spread bottomed around 0.6% about 10 years ago. And the gap has gradually widened to a peak above 1.8% during 2020 – a widening of a whopping 120 basis points. As we cautioned in our earlier article, we started seeing the reverse – the market rotation back to value stocks in Feb 2022. The spread yield has indeed narrowed rapidly to the current level of around 1%, very close to the long-term average of about 1.05%.
As such, we see that they are about fairly valued against each and feature approximately the same valuation risks.
Author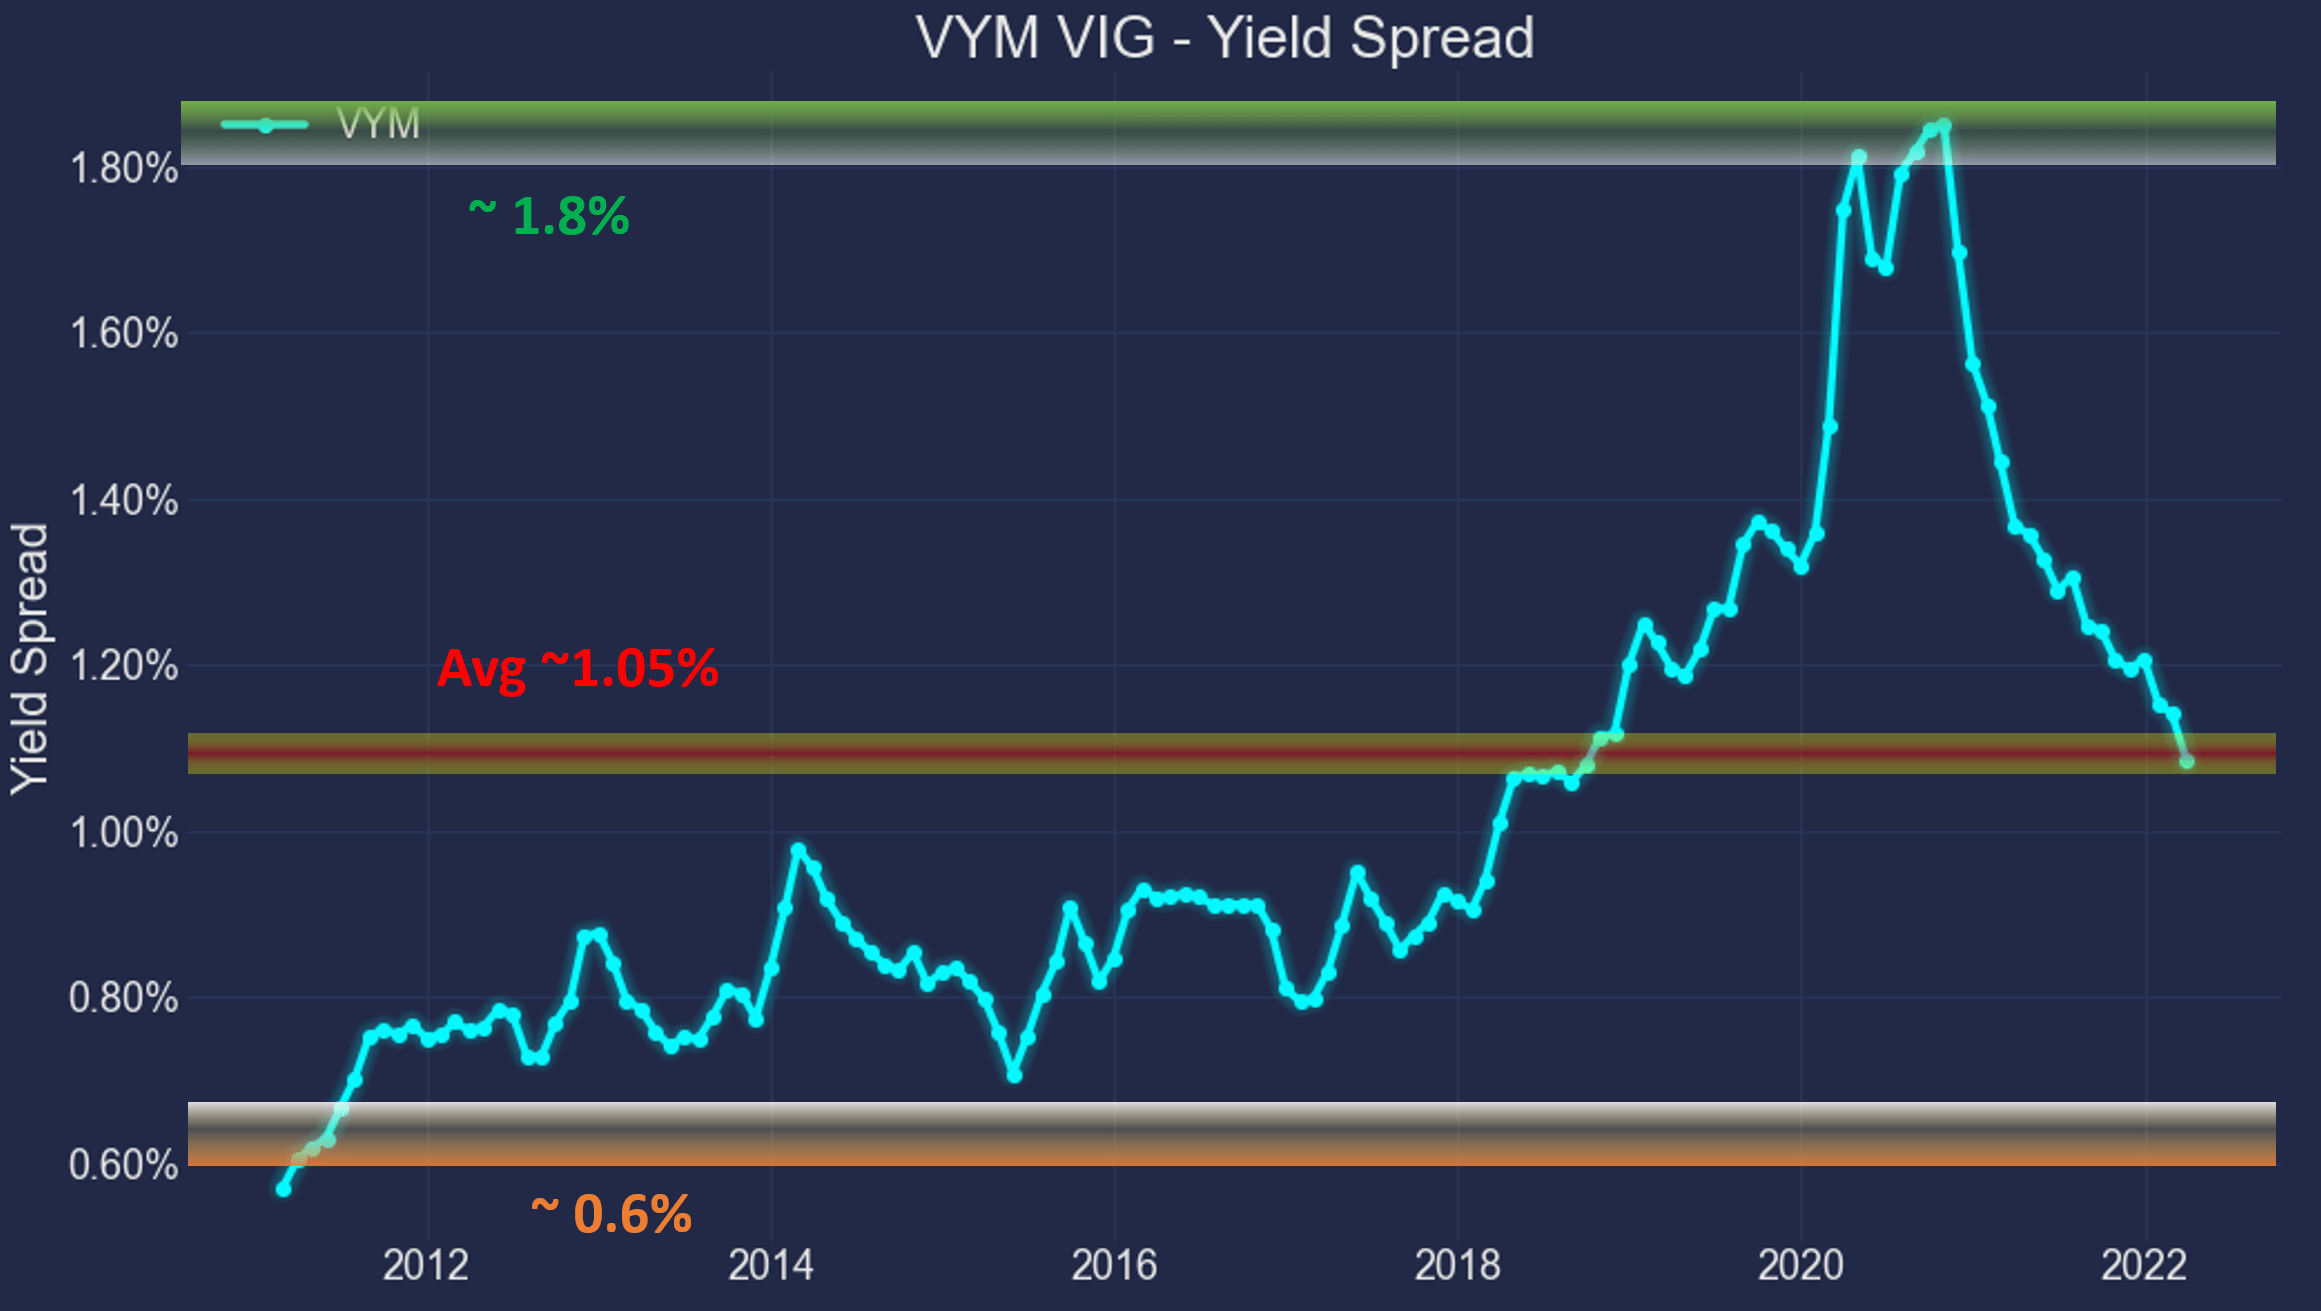
Conclusions and final thoughts
The treasury rates have increased substantially in the past few months. With the 10-year treasury rates exceeding 2.8% for the first time since 2018, now we see the underlying dynamics between equity and bonds changing rapidly. In particular,
- The recent surges of treasury rates have pushed the yield spread of both VIG and VYM to the thinnest level in a decade.
- At the same time, with 10-year treasury rates near 2.8%, we think treasury rates are close to their long-term targets already. At a very fundamental level, treasury bond rates cannot rise above long-term inflation or GDP growth in the long term.
- As such, we recommend investors to hedge their equity positions (either VYM or VIG) and begin to consider holding (or holding more) treasury bonds.
Be the first to comment