

simonkr
Investment summary
Defensive healthcare looks well positioned to catch a bid in the forward looking climate. A weaker economic outlook makes resilient real-earnings from niches like medical imagine look relatively more attractive to high-duration offerings. As such, we turn to ViewRay, Inc. (NASDAQ:VRAY) and note the risk/reward calculus remains balanced for this name. Whilst the company presents with differentiated strengths that warrant a speculative buy, forward price targets support a neutral view, not ideal for investors seeking to widen up their equity risk budget.
Exhibit 1. VRAY 6-month price action
Data: Refinitiv Eikon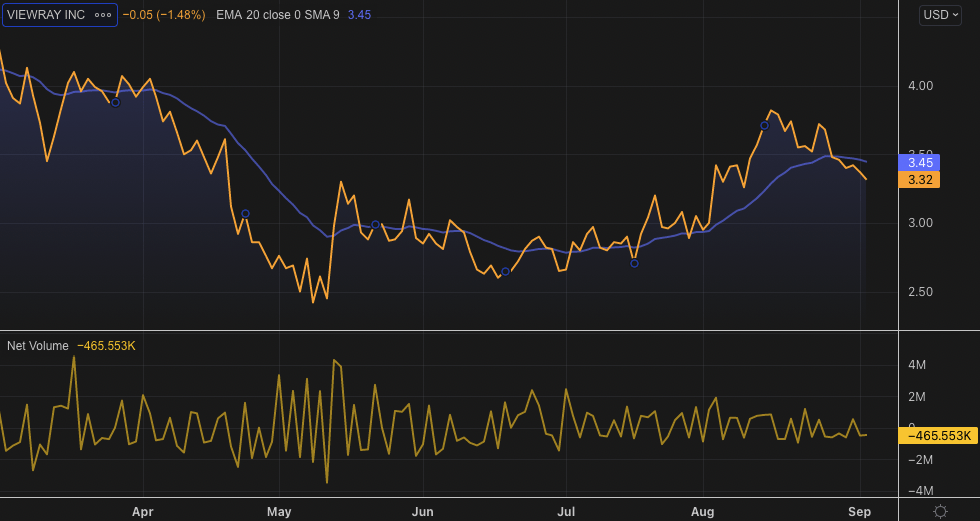
Q2 earnings comments
Total revenue came in with a 47% YoY growth and printed $22 million (“mm”) as unit volumes and revenue units recognized a higher clip for the quarter. The company placed 4 units and saw one upgrade during the period. Product revenue of $16.5mm saw a 51% YoY gain, whereas service revenue was 40% higher at $5.5mm for the quarter.
The bolus of revenue was recognized in the US. However, ex-US turnover increased more than 727% over the 12 months, as seen in Exhibit 2. Despite this, the bulk of sales [~$13mm] for the 6-months to date were seen in Q1 FY22. In total, the company’s units have treated ~25,000 patients to date.
Exhibit 2. Total sales growth reflected in both reporting segments
Data: VRAY 10-Q, Q2 FY22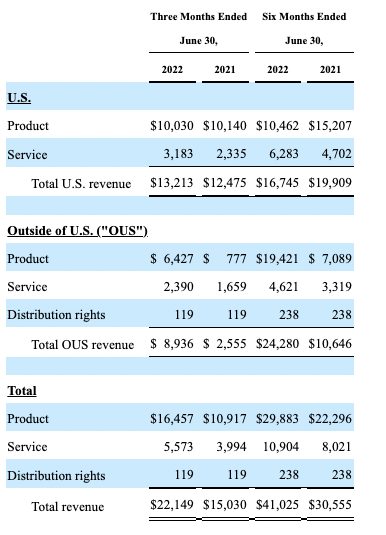
Order volume was strong too with a total 8 orders booked in Q2, surmounting to gross order value (“GOV”) of ~$46mm. Backlog ended the quarter at $353mm, up 27% over the year. The booked orders [whilst not delivered] have already generated a 5% gross margin due to timing effects. As seen in the Exhibit 3, VRAY booked an additional 8 orders during the period, up from 7 the year prior.
Exhibit 3.
Data: VRAY Q2 earnings investor presentation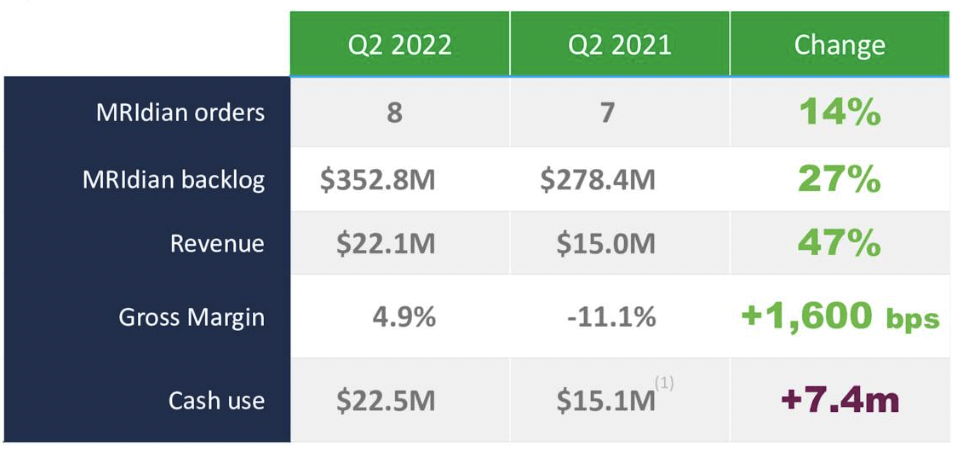
Strong quarterly results and favourable market outlook enabled management to revise guidance upward at the bottom end, now forecasting for $90mm-$104mm, calling for a range of 28-48% at the top line. It intends to use $68-$83mm in cash during the period to generate this.
Importantly, regarding the company’s strategy on managing supply chain headwinds moving forward, CFO Zach Stassen:
“[W]e continue to face a challenging supply chain environment that sometimes requires us to deploy more capital near term to solidify vendor supply. Despite these issues, we continue to expect a significant step down in cash burn in the second half of the year and remain confident we are well capitalized to achieve growth and reach cash flow breakeven.
The investments we are making are driving a positive return. The initial feedback on A3i in the market is strong and pairing that with our clinical data will no doubt drive meaningful growth.”
Valuation
Shares are currently trading at ~7x sales and are priced at 4.7x the company’s book value of equity. Lack of profitability, measures in terms of free cash flow and return on invested capital, makes prescribing a defensible valuation increasingly difficult. Nevertheless, both of these multiples are priced above the GICS Health Care sector peer median. Therefore, VRAY trades at a premium to peers.
Question is, is this premium justifiable or not? Ideally, this is done by analyzing a company’s earnings, the size of its investments, and the return on this invested capital. However, we’ve no figures for each of these given the company’s lack of profitability. We also estimate FY22 and FY23 sales of $98.7mm and $136.7mm respectively for VRAY looking ahead. The market consensus also has VRAY valued at 5.9x forward sales, and assigning this multiple to our FY22 and FY23 estimates sets price objectives of $3.20 and $4.45, respectively. The arithmetic mean of both is $3.80, our estimate of fair value.
Technical factors
There’s some interesting information to be extracted from the 12-month daily chart. First, retracing the downleg from the November FY21′ highs to the May FY22′ bottom, we note the stock has retraced 23% of the move and tested this level on the fibs before reverting to the downside. Meanwhile, on balance volume (”OBV”) continues in an uptrend despite having curled over in unison with the share price, as seen in the chart below. Shares might be oversold as seen in the stochastics RSI [bottom window, Exhibit 5] however there’s chance this may be confirmation of further weakness.
Exhibit 5. Technical factors for VRAY
Data: Refinitiv Eikon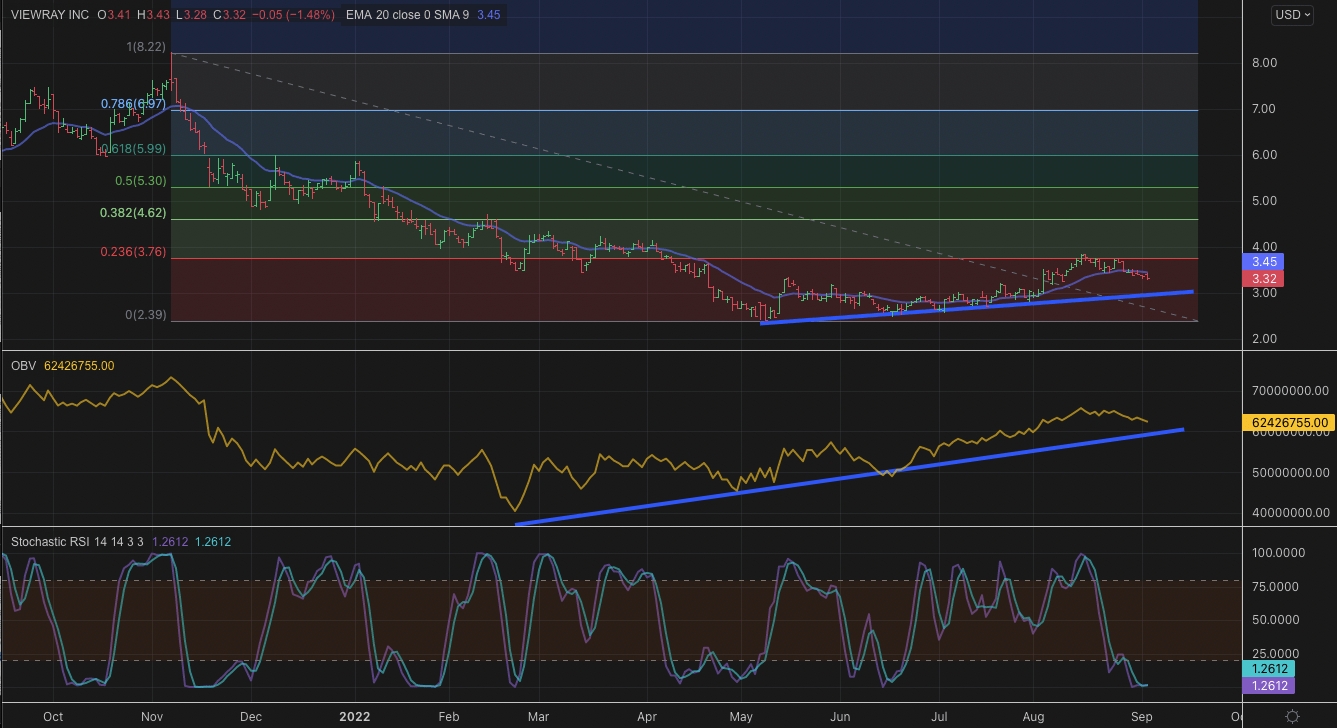
We need shares to break back past the lower tab on the fibonacci retracement shown above in order to justify further upside. Otherwise, the price action isn’t supportive of the same. Valuations are equally unsupportive at current multiples and, despite a potentially market-beating forward earnings yield on offer, there’s still a lack of tangible value to be found at this point. We note the company’s differentiated strength and fundamental performance, which are quality factors in the investment debate. With shares trading in-line with our valuation, rate VRAY neutral, price target $3.80
Be the first to comment